Characterising the epidemic spread of Influenza A/H3N2 within a city through phylogenetics

Nicola Felix Müller
PhD Student in the Stadler Group
Incidence data can inform us about how diseases are spread
map of the 1854 Broad Street cholera outbreak

Reconstructing the shared ancestry of pathogens from genetic sequence data allows us to see how these cases are connected

Bedford et al., 2010, PLoS Pathogens
Reconstructing the shared ancestry of pathogens from genetic sequence data allows us to see which regions are sources of influenza
Bedford et al., 2010, PLoS Pathogens

Using phylogenetics to study the global spread requires dense sampling on a global scale
- Having a couple of 100 influenza sequences of different regions over a few years allows to characterise the global spread of influenza viruses.
- The same datasets are not sufficiently dense to study how influenza spreads locally.
- However, most influenza transmission events happens locally.
How to characterise the spread of influenza on a city scale? By drastically improving the resolution
- We sequenced the full genomes of influenza viruses from every case with influenza like symptoms from the Hospitals in Basel in 2016/2017 (as well as some from private practitioners).
- We gathered a vast amount of information about the patients (age, kids in the same household, address etc.) to see what drives influenza cases.
Season dominated by 3 antigenically different clades, with a second wave being driven by A1a

We can build a phylogeny a all our sequences from Basel alongside sequences sampled from all around the world in a similar time frame. This allows us to study the diversity of influenza viruses present in Basel.
The diversity present in the city reflects a global diversity of Influenza A/H3N2
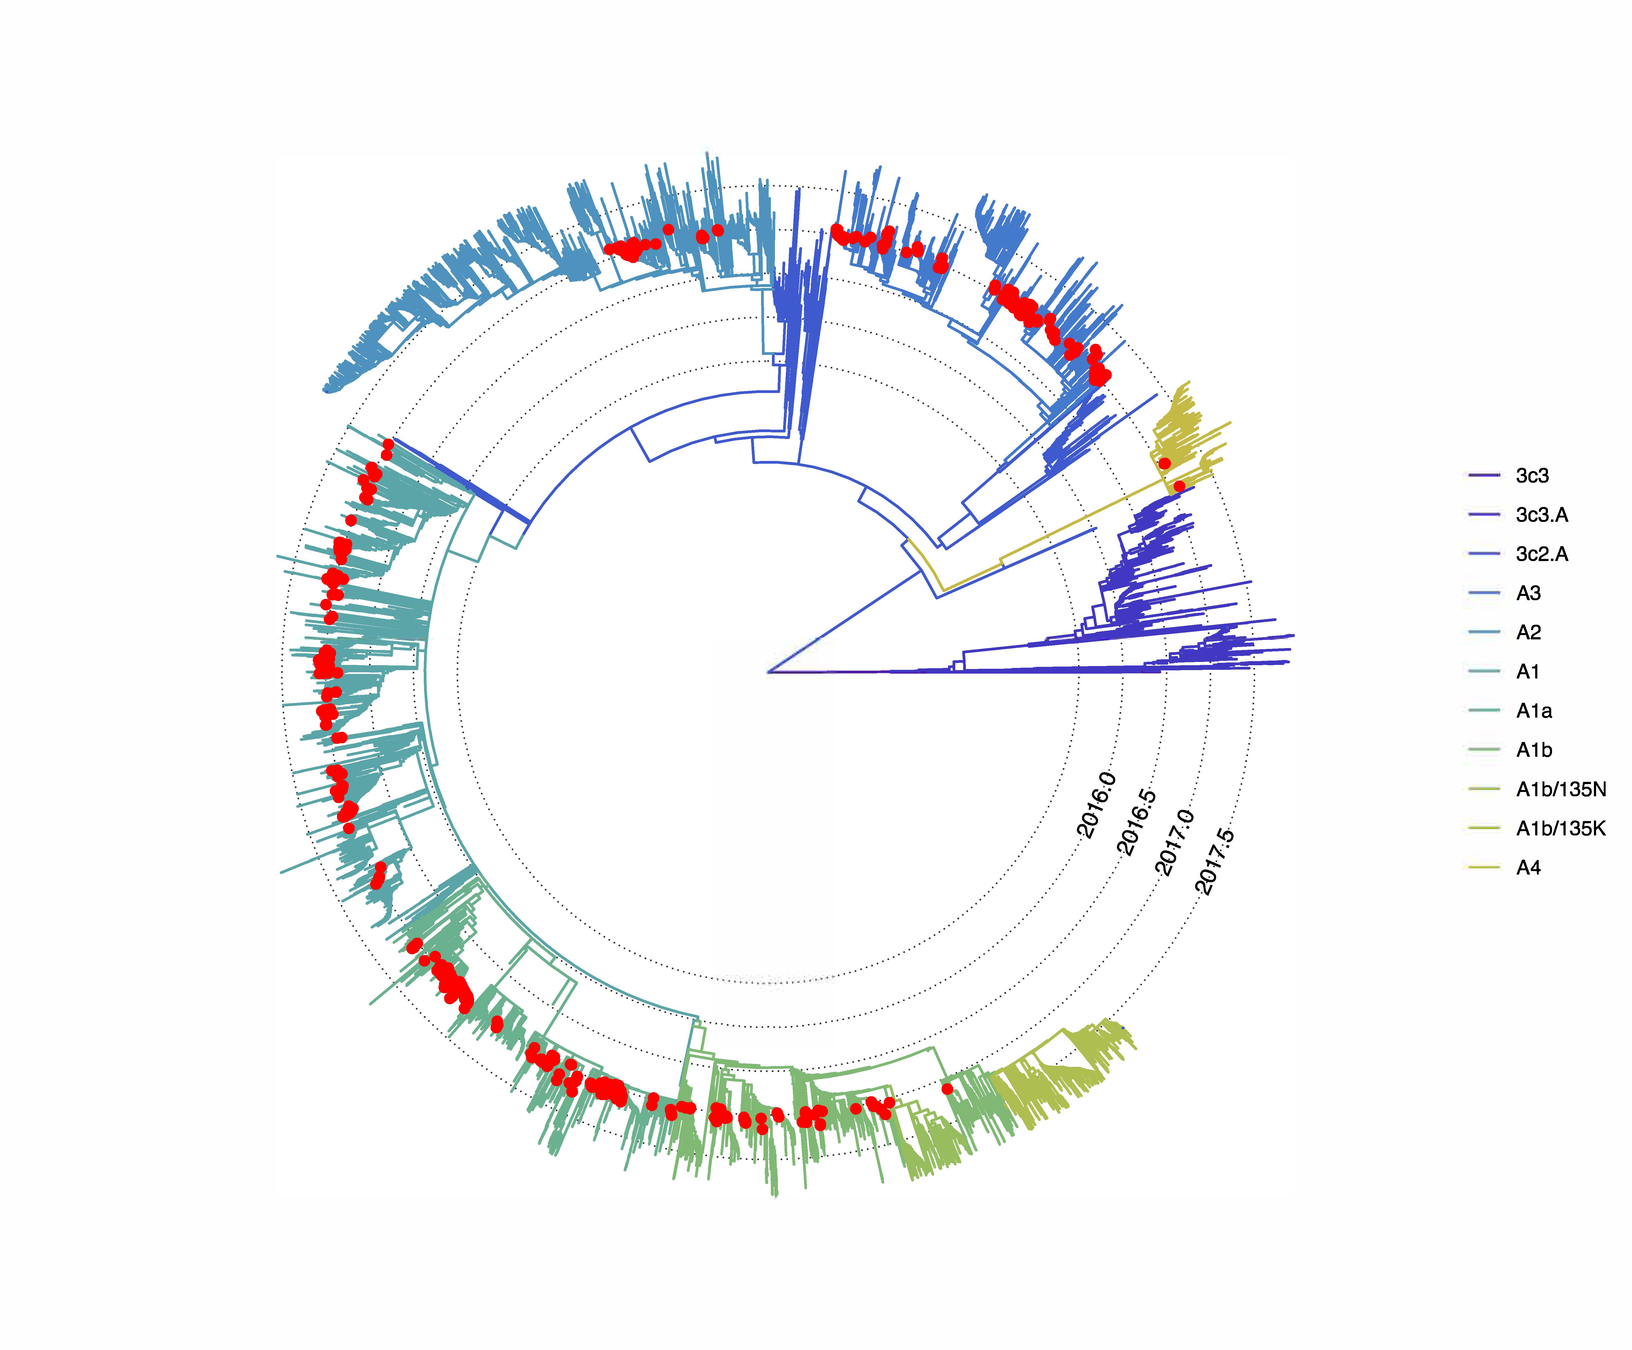
We can use sequences sampled from all around the globe to place where "Basel" sequences fall and how they cluster

Of around 700 distinct sampled and sequenced patients, we observe almost 240 introductions

By using a simple birth-death model, we can infer the effective reproduction number of influenza over time jointly from all local outbreak clusters

Two waves of the effective reproduction number and the number of cases

The drop in the effective reproduction number and its increase later coincided with changes in the temperature

Between 1st of Dez. and 1st of Feb.
- Temperature: pearson correlation of 0.71
- Humidity: pearson correlation of -0.12
Introductions are drove the influenza A/H3N2 season in Basel in 2016/17
- Global diversity represented in Basel.
- Almost 240 introductions with sampled descendants.
- Relatively low effective reproduction number (<1.5) compared to other pathogens.
- Changes in the reproduction number coincide with changes in temperature.
What role does age play in spreading influenza in a city?

We have additional information for some patients that tells us someone lives in the same household as children
- Pre-school aged children (below 7 years).
- School aged children (below 18).
- Adults for whom it is unknown if they live in the same household as children or not.
- Adults living in the same household as children.
- Adults living not living in the same household as children.
- The elderly (above 65 year olds).
From our phylogenetic trees, we know the pairwise distance in time between any two samples from Basel. For each influenza sample from Basel, we can therefore say how many neighbours/connections it has to other samples from Basel within some time.
Are different groups associated with more or less connections compared to other groups

More connections can have different explanations:
- a) These groups are more likely to "participate" in transmission events as donor or recipient of influenza
- b) Members of these groups mostly transmit influenza to other members of the same group and are more likely to be sampled.
- c) A combination of a) and b)
Less connections can have different explanations:
- a) These groups are less likely to "participate" in transmission events as donor or recipient of influenza
- b) Members of these groups mostly transmit influenza to other members of the same group and are less likely to be sampled.
- c) A combination of a) and b)
So lets see how cases between members of different groups are connected
- Classify each pair of patients as being associated if their phylogenetic distance in time is below some threshold.
- Count the number of pairs between groups.
- Randomly permute the group label of patients to see if the random number of pairs is larger or smaller than the observed one.
Strong positive association within school aged children and the elderly

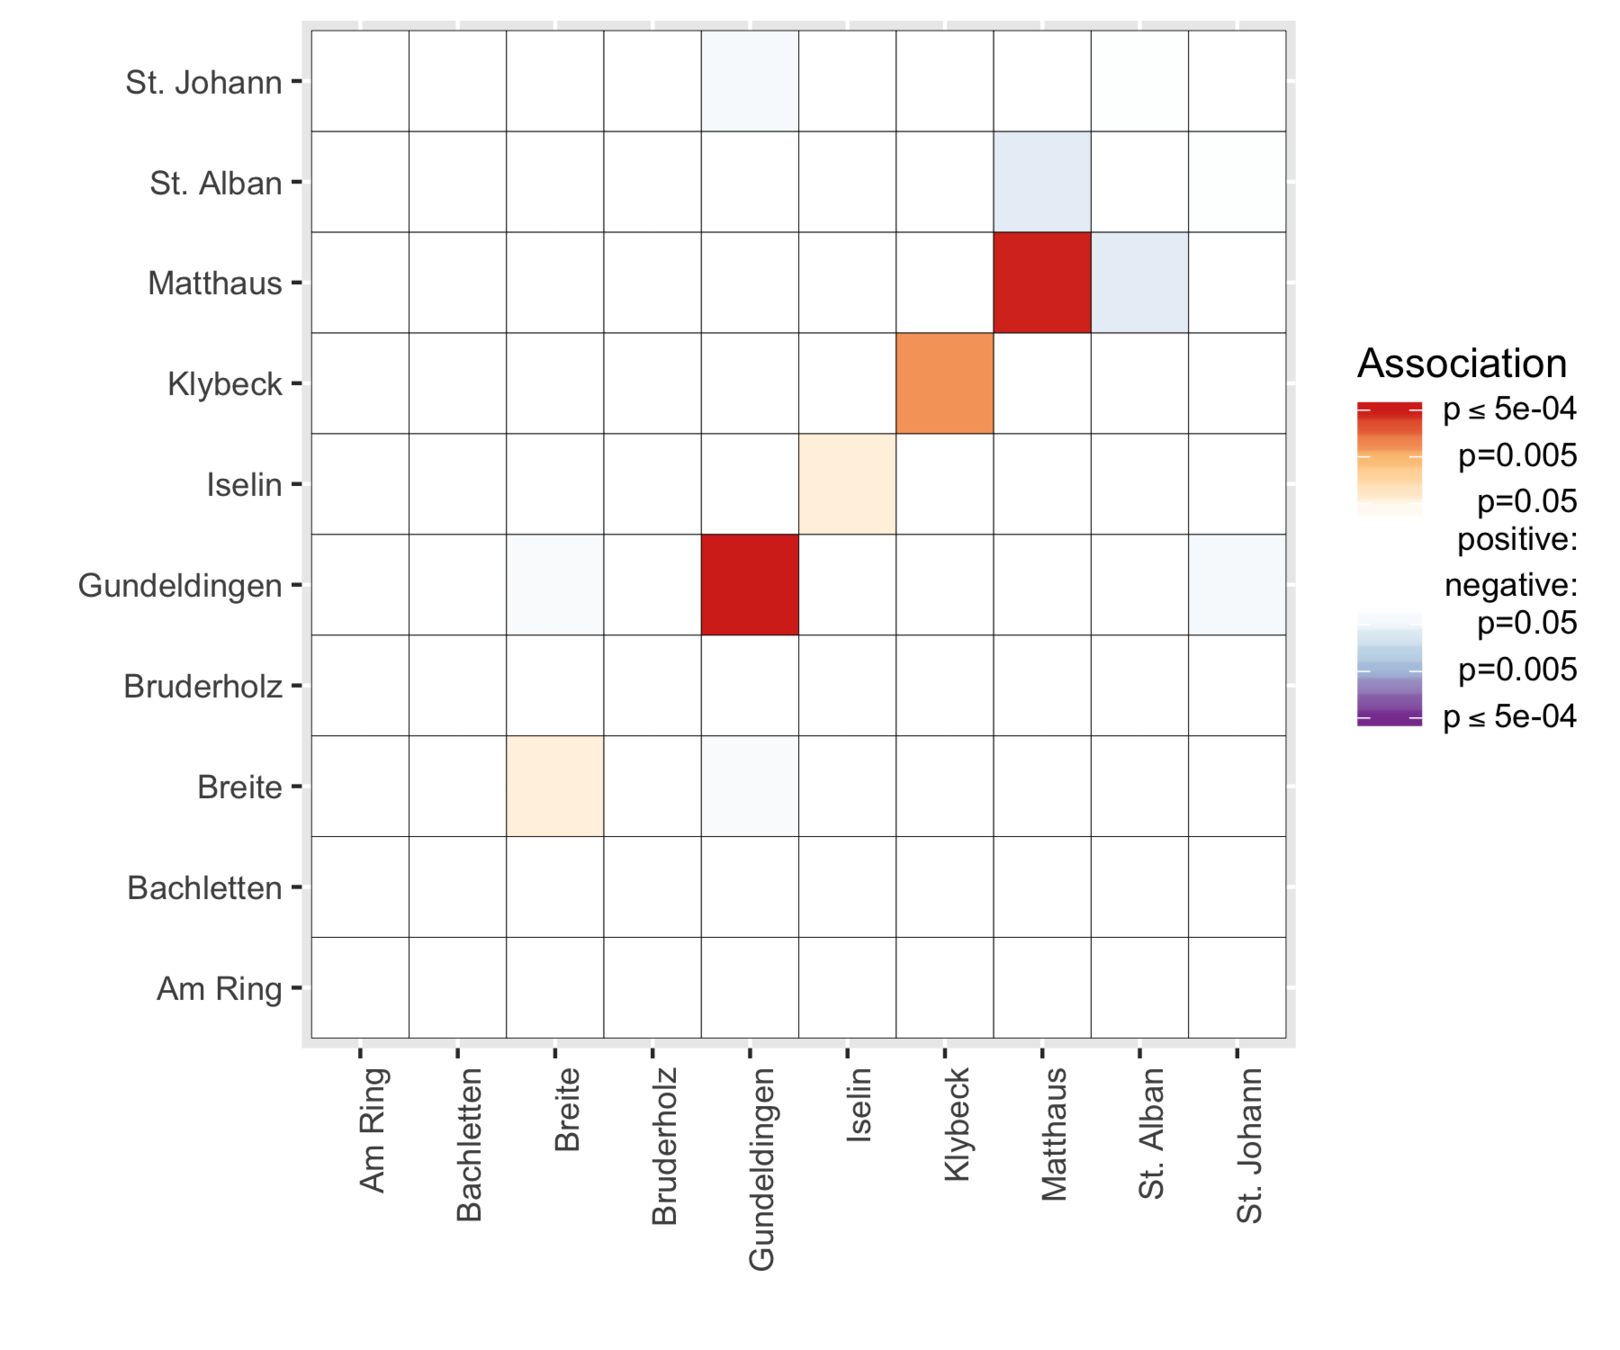
Having (anonymised!) addresses of patients, we can start looking at the influence of geography on spreading influenza on a city scale
- Are viruses that are sequenced from patients than live closer together more closely related?
- And if yes, do some areas in the City show particular mixing patterns?
If viruses isolated from pairs of patients are more closely related, these patients are in average living closer together.

Some areas show strong mixing within the same area
Understanding how influenza is spread locally will help to streamline public health resources as effectively
- Combining phylogenetics with patient information allowed us to study the role different age groups play in spreading influenza.
- Our study supports the hypothesis that school aged children playing a major role in spreading influenza.
- There is a small influence of geography in how influenza was spread
- The results will however need to be compared across seasons, cities and influenza subtypes.
Acknowledgments
- Tanja Stadler
- University Hospital Basel and UKBB: Microbiology group of Adrian Egli, Manuel Battegay, Andreas Buser, Nicole Ritz, Andreas Zeller and Christian Nickel
- University of Basel: Human Geography group of Rita Schneider-Sliwa, Richard Neher
- Fred Hutch: Trevor Bedford, James Hadfield
- Study nurses and private practitioners around Basel
- Brian M. Lang
- And the Computational Evolution Group
