ICCV 2019
| Paper Registration Deadline | March 15, 2019 (11:59PM PST) |
| Paper Submission Deadline | March 22, 2019 (11:59PM PST) |
| Supplementary Materials Deadline | March 29, 2019 (11:59PM PST) |
| Reviews Released to Authors | June 14, 2019 (11:59PM PST) |
| Rebuttals Due | June 26, 2019 (11:59PM PST) |
| Final Decisions to Authors | July 22, 2019 |
Submission Timeline:
Goals
1) Show that reasoning over plots can not be treated as a Multi-Class Classification (MCC) probem
2) Motivation for a new dataset (DIP)
2.1) DIP is a harder dataset than the existing datasets
3) Motivation for a new method (Our Pipeline)
3.1) Our pipeline performs better than the existing SOTA methods
March 12, 2019
How we are achieving these goals:
An Intuitive Story
While doing Question-Answering over scientific plots, the answer :
1) comes from a fixed vocabulary
2) comes from the plot itself (plot specific)
e.g. Yes, No, horizontal, ...
e.g. title of the graph,
textual content which is not in the vocabulary, ...
3) needs to be calculated/generated
e.g. average of numbers, difference of numbers, ...
Multi-class classification problem addresses only the 1st bullet
Goal 1 is achieved here (i.e., we can not treat reasoning over plots as a MCC problem)
How we are achieving these goals:
An Intuitive Story
While doing Question-Answering over scientific plots, the answer :
1) comes from a fixed vocabulary
2) comes from the plot itself (plot specific)
e.g. Yes, No, horizontal, ...
e.g. title of the graph,
textual content which is not in the vocabulary, ...
3) needs to be calculated/generated
e.g. average of numbers, difference of numbers, ...
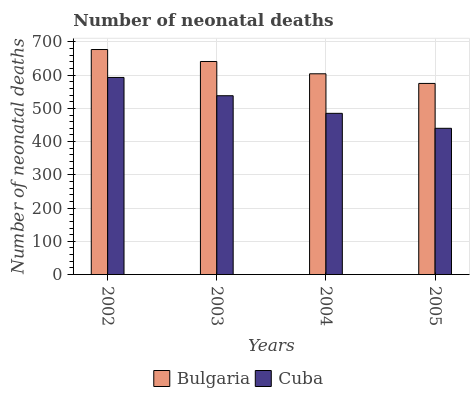
FigureQA
DVQA
DIP
Goal 2 and 2.1 is achieved (i.e., a harder dataset like DIP is required to do reasoning over plots)
How we are achieving these goals:
An Intuitive Story
While doing Question-Answering over scientific plots, the answer :
1) comes from a fixed vocabulary
2) comes from the plot itself (plot specific)
e.g. Yes, No, horizontal, ...
e.g. title of the graph,
textual content which is not in the vocabulary, ...
3) needs to be calculated/generated
e.g. average of numbers, difference of numbers, ...
SAN
SANDY
Our Model
Hybrid
MOM
Goal 3 and 3.1 is achieved (i.e., a method which addresses all types of answers is needed)
Existing datasets have only those questions types for which answers can either be classified from a fixed vocabulary or are plot specific.
FigureQA : All the answers are either Yes/No only.
DVQA : Out of 25 templates,
- answers for 14 templates comes from a fixed vocabulary
- 9 templates can be answered based on the plot vocabulary
- answers of only 2 templates need to be calculated
How we are achieving these goals:
An Intuitive Story
Goal 2 and 2.1 is achieved here.
DIP : Out of 74 templates,
- answers for 36 templates comes from a fixed vocabulary
- 15 templates can be answered based on the plot vocabulary
- answers of 23 templates need to be calculated
March 12, 2019
Can we merge the 2 templates of DVQA with other answer types?
How we are achieving these goals:
An Intuitive Story
Goal 3 and 3.1 is achieved here.
Existing methods address only those questions types for which answers can either be classified from a fixed vocabulary or are plot specific.
SAN (classifies the answer from a fixed vocabulary)
SANDY, MOM (classifies the answer from a fixed vocabulary and plot vocabulary)
Our proposed model
(addresses only those questions for which the answer needs to be calculated)
Hybrid model
(addresses Yes/No answers, fixed vocab answers, plot-specific answers, calculated answers)
March 12, 2019
How we are achieving these goals:
An Empirical Story
| DVQA | DIP | |
|---|---|---|
| SAN | ||
| Our model | ||
| Hybrid model-1 | ||
| Hybrid model-2 | 57.99% | 49.71% |
If we can show that the numbers in the red part are greater than that in green part:
- we can say that DVQA is comparatively easier than DIP
If we can show that the numbers in the yellow part are less than that in blue part:
- we can say that our method is better than the existing SOTA methods
| DVQA | DIP | |
|---|---|---|
| SAN | 36.04% | 45.7% |
| Our model | 48.62% | 16.3% |
| Hybrid model-1 | 48.35% |
* All accuracies are calculated with exact match.
These numbers don't tell us the full story because the question distribution of both the datasets is not equal
We cannot conclude anything unless we run the Hybrid model on DVQA
Exact match is not a good metric for comparing floating point numbers
March 12, 2019
meta-classifier based on the templates
meta-classifier based on the predictions
How we are achieving these goals:
An Empirical Story
| DIP | |
|---|---|
| 0% | 49.71% |
| 1% | 50.77% |
| 5% | 53.96% |
| 10% | 55.96% |
meta-classifier based on the predictions
Hybrid Model
How we are achieving these goals:
An Empirical Story
The rest of the slides contain the following results :
- Zooming in the accuracy of different models (Question wise)
- Zooming in the accuracy of different models (Answer wise)
- Zooming in the accuracy of different models (Question wise and Answer wise)
March 12, 2019
Template wise accuracy of different models
| Structure | Data | Reasoning |
|---|---|---|
| 94.71% | 18.78% | 37.29% |
| 60.53% | 45.56% | 47.52% |
| - | - | - |
| 85.44% | 51.04% | 55.35% |
| 96.47% | 37.82% | 41.5% |
| Structure | Data | Reasoning |
|---|---|---|
| 83.6% | 37.93% | 24.71% |
| 26.39% | 20.06% | 7.64% |
| 83.61% | 45.59% | 26.34% |
| 86.3% | 47.25% | 26.67% |
| - | - | - |
| Datasets | DVQA |
|---|
| Methods\Templates |
| SAN |
| Our Model |
| Hybrid Model-1 |
| Hybrid Model-2 |
| SANDY (OCR) |
| DIP |
|---|
Template Distribution (TEST)
Template wise Accuracy
| Structure | Data | Reasoning |
|---|---|---|
| 13.48% | 31.93% | 54.59% |
| Structure | Data | Reasoning |
|---|---|---|
| 30.37% | 23.97% | 45.66% |
| Datasets | DVQA |
|---|
| Methods\Templates |
| Distribution |
| DIP |
|---|
* All accuracies are calculated with exact match.
Zooming in the accuracy of different models
Template wise accuracy of different models
Zooming in the accuracy of different models
| Structure | Data | Reasoning |
|---|---|---|
| 86.3% | 47.25% | 26.67% |
| 86.3% | 47.96% | 28.61% |
| 86.3% | 50.05% | 34.49% |
| 86.3% | 50.92% | 37.15% |
| Tables | DIP |
|---|
| Threshold \ Templates |
| 0% |
| 1% |
| 5% |
| 10% |
meta-classifier based on the predictions
Hybrid Model
Template wise Accuracy
Answer wise accuracy of different models
| Yes/No | Fixed Vocab | OOV |
|---|---|---|
| Yes/No | Fixed Vocab | OOV |
|---|---|---|
| 83.00% | 49.84% | 0.00% |
| 0.00% | 33.02% | 4.14% |
| 83.00% | 53.07% | 4.14% |
| 83.00% | 56.04% | 4.14% |
| Datasets | DVQA |
|---|
| Methods\Templates |
| SAN |
| Our Model |
| Hybrid Model-1 |
| Hybrid Model-2 |
| DIP |
|---|
Answer wise Accuracy
| Yes/No | Fixed Vocab | OOV |
|---|---|---|
| 23.46% | 76.53% | 0.00% |
| Yes/No | Fixed Vocab | OOV |
|---|---|---|
| 27.46% | 46.1% | 26.4% |
| Datasets | DVQA |
|---|
| Methods\Templates |
| Distribution |
| DIP |
|---|
* All accuracies are calculated with exact match.
Answer Distribution (TEST)
Zooming in the accuracy of different models
Answer wise accuracy of different models
Zooming in the accuracy of different models
| Tables | DIP |
|---|
| Threshold \ Templates |
| 0% |
| 1% |
| 5% |
| 10% |
| Yes/No | Fixed Vocab | OOV |
|---|---|---|
| 83.00% | 56.04% | 4.14% |
| 83.00% | 56.04% | 8.14% |
| 83.00% | 56.04% | 20.19% |
| 83.00% | 56.04% | 25.54% |
meta-classifier based on the predictions
Hybrid Model
Answer wise Accuracy
Accuracy of different models
Zooming in the accuracy of different models
| Structure | Data | Reasoning |
|---|---|---|
| 82.13% | 15.02% | 14% |
| 17.8% | 84.98% | 85.91% |
| 0.00% | 0.00% | 0.00% |
| Yes/No |
|---|
| Fixed Vocab |
| OOV |
| Structure | Data | Reasoning |
|---|---|---|
| 37.59% | 20.85% | 24.18% |
| 62.4% | 56.3% | 29.89% |
| 0.00% | 22.84% | 45.92% |
Template wise Answer Distribution (TEST)
| Datasets | DVQA | DIP |
|---|
| Answer \ Template |
Accuracy of different models
| Structure | Data | Reasoning |
|---|---|---|
| 92.15% | 86.49% | 50.55% |
| 54.57% | 5.01% | 23.96% |
| 0.00% | 0.00% | 0.00% |
| Structure | Data | Reasoning |
|---|---|---|
| 94.01% | 95.35% | 66.02% |
| 77.3% | 32.06% | 29.27% |
| NA | 0.00% | 0.00% |
| 0.00% | 0.00% | 0.00% |
| 42.29% | 27.61% | 25.48% |
| NA | 19.77% | 0.054% |
| 94.01% | 95.35% | 66.02% |
| 77.33% | 37.63% | 34.63% |
| NA | 19.77% | 0.054% |
| 94.01% | 95.35% | 66.0% |
| 81.66% | 40.6% | 35.74% |
| NA | 19.77% | 0.054% |
| Yes/No |
|---|
| Fixed Vocab |
| OOV |
| Yes/No |
|---|
| Fixed Vocab |
| OOV |
| SAN |
|---|
| Our Model |
|---|
| DVQA | DIP |
|---|
| Answer \ Template |
| Yes/No |
|---|
| Fixed Vocab |
| OOV |
| Hybrid Model-1 |
|---|
Zooming in the accuracy of different models
* All accuracies are calculated with exact match.
Template wise Answer Accuracy (TEST)
| Yes/No |
|---|
| Fixed Vocab |
| OOV |
| Hybrid Model-2 |
|---|
Accuracy of different models
Zooming in the accuracy of different models
Template wise Answer Accuracy (TEST)
| Structure | Data | Reasoning |
|---|---|---|
| 94.01% | 95.35% | 66% |
| 81.66% | 40.6% | 35.74% |
| NA | 19.77% | 0.054% |
| Answer \ Template |
|---|
| Yes/No |
| Fixed Vocab |
| OOV |
DIP
| Structure | Data | Reasoning |
|---|---|---|
| 94.01% | 95.35% | 66% |
| 81.66% | 40.6% | 35.74% |
| NA | 22.88% | 4.29% |
| Answer \ Template |
|---|
| Yes/No |
| Fixed Vocab |
| OOV |
DIP
1%
0%
meta-classifier based on the predictions
Hybrid Model
Accuracy of different models
Zooming in the accuracy of different models
| Structure | Data | Reasoning |
|---|---|---|
| 94.01% | 95.35% | 66% |
| 81.66% | 40.6% | 35.74% |
| NA | 32.06% | 17.1% |
| Answer \ Template |
|---|
| Yes/No |
| Fixed Vocab |
| OOV |
DIP
| Structure | Data | Reasoning |
|---|---|---|
| 94.01% | 95.35% | 66% |
| 81.66% | 40.6% | 35.74% |
| NA | 35.82% | 22.87% |
| Answer \ Template |
|---|
| Yes/No |
| Fixed Vocab |
| OOV |
DIP
10%
5%
Template wise Answer Accuracy (TEST)
meta-classifier based on the predictions
Hybrid Model
Shortcomings of our proposed model are:
- Fails to answer Yes/No questions.
- Fails to answer questions for which the grammar is not defined. Example: In how many countries, is the CO2 emission greater than the average CO2 emission taken over all countries ?
- Positional information is lost in the tables. Hence, our method fails to answer structural and data questions where image is required to answer correctly. Example: How many bars are there on the 4th tick from the right?
That's why we need a Hybrid model.
Motivation for Hybrid Model
March 12, 2019
In our last meeting, these TODOS were decided :
- Give SEMPRE accuracy on different thresholds
- SEMPRE accuracy on ORACLE tables
- Train SEMPRE only on Reasoning templates having OOV answers (Running)
- Train meta-classifier using predictions rather than question templates
- Calculate OCR accuracy on Mask-RCNN detections
- Hybrid model for DVQA
- Generate high quality plots
Analysis done in last meeting
March 13, 2019
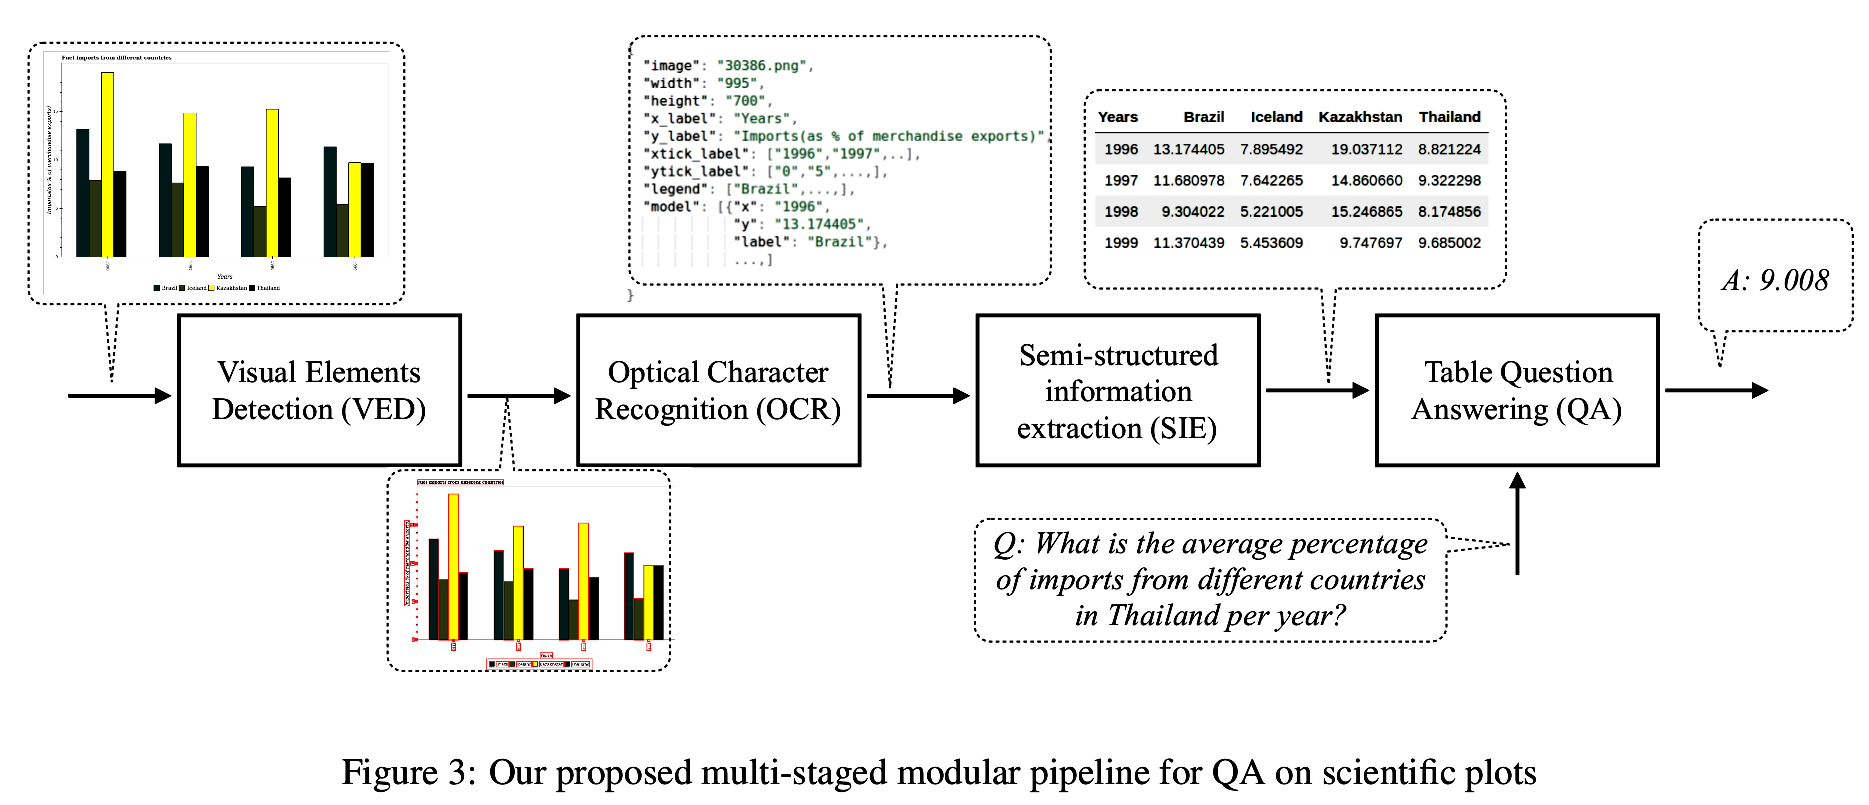
Stage-wise Analysis of our pipeline
Stage-wise Analysis of our pipeline
Stage
Visual Elements Detection (VED)
Optical Character Recognition (OCR)
Semi-structured information extraction (SIE)
Table Question Answering (QA)
Accuracy
Method
Mask-RCNN
Tesseract
Rule based
SEMPRE
94.21%
97.06%
ab.cd%
Trained with 0.5 overlap
80.44%
ab.cd%
Mask-RCNN
92.69%
mAP@IOU=0.5
79.58%
39.88%
Trained with 0.75 overlap
mAP@IOU=0.8
mAP@IOU=0.9
mAP@IOU=0.5
mAP@IOU=0.8
mAP@IOU=0.9
(Oracle bounding boxes)
93.1%
(bounding boxes after VED)
32.55%
(Oracle Tables) 5% Threshold
20.22%
(Tables generated after VED+OCR) 5% Threshold
Stage-wise Analysis of our pipeline
Visual Element Detection (VED)
| IoU@0.5 | IoU@0.8 | IoU@0.9 | |
|---|---|---|---|
| DIP | DIP | DIP | |
| bar | 96.24% | 77.57% | 47.54% |
| dot-line | 95.05% | 62.48% | 4.96% |
| legend-label | 99.77% | 98.13% | 50.83% |
| line | 51.83% | 23.52% | 5.83% |
| preview | 99.87% | 89.64% | 32.43% |
| title | 99.91% | 81.41% | |
| xlabel | 99.94% | 94.43% | 46.12% |
| xticklabel | 99.75% | 89.90% | 33.72% |
| ylabel | 99.97% | 98.86% | 80.53% |
| yticklabel | 99.84% | 88.42% | 36.31% |
| mAP | 94.21% | 80.44% | ab.cd% |
MASK-
Stage-wise Analysis of our pipeline
Optical Character Recognition (OCR)
| Textual Elements | Oracle bounding boxes | Bounding boxes after VED |
|---|---|---|
| xlabel | ||
| ylabel | ||
| yticklabel | ||
| xticklabel | ||
| title | ||
| legend-label | ||
| Overall |
| OCR Accuracy |
|---|
Stage-wise Analysis of our pipeline
Semi-structured information extraction (SIE)
Stage-wise Analysis of our pipeline
Table Question Answering (SEMPRE)
- Oracle Tables are the tables generated directly from the image annotations
- Generated Tables are the tables generated after passing the image through our pipeline i.e, through VED, OCR and SIE stage
Overall accuracy on Oracle and Generated tables
| Threshold \ Tables | Oracle Tables | Generated Tables |
|---|---|---|
| 0% | 31.8% | 16.3% |
| 1% | 32.33% | 17.2% |
| 5% | 32.55% | 20.2% |
| 10% | 32.74% | 21.47% |
Stage-wise Analysis of our pipeline
Table Question Answering (SEMPRE)
Template wise Accuracy on Oracle and Generated tables
| Structure | Data | Reasoning |
|---|---|---|
| 26.54% | 42.18% | 29.88% |
| 26.54% | 42.42% | 30.87% |
| 26.54% | 42.49% | 31.33% |
| 26.54% | 42.54% | 32% |
| Tables | Oracle Tables | Generated Tables |
|---|
| Threshold \ Templates |
| 0% |
| 1% |
| 5% |
| 10% |
| Structure | Data | Reasoning |
|---|---|---|
| 26.39% | 20.06% | 7.64% |
| 26.39% | 20.77% | 9.36% |
| 26.39% | 22.88% | 14.71% |
| 26.39% | 23.74% | 17% |
Stage-wise Analysis of our pipeline
Table Question Answering (SEMPRE)
Answer wise Accuracy on Oracle and Generated tables
| Yes/No | Fixed Vocab | OOV |
|---|---|---|
| 0.00% | 43.86% | 43.74% |
| 0.00% | 43.86% | 45.64% |
| 0.00% | 43.86% | 46.49% |
| 0.00% | 43.86% | 47.19% |
| Tables | Oracle Tables | Generated Tables |
|---|
| Threshold \ Templates |
| 0% |
| 1% |
| 5% |
| 10% |
| Yes/No | Fixed Vocab | OOV |
|---|---|---|
| 0.00% | 33.02% | 4.14% |
| 0.00% | 33.02% | 7.74% |
| 0.00% | 33.02% | 18.89% |
| 0.00% | 33.02% | 23.64% |
Stage-wise Analysis of our pipeline
Table Question Answering (SEMPRE)
Template wise answer accuracy on Oracle and Generated tables
| Structure | Data | Reasoning |
|---|---|---|
| 0.00% | 0.00% | 0.00% |
| 42.29% | 27.61% | 25.48% |
| NA | 22.89% | 3.78% |
| Answer \ Template |
|---|
| Yes/No |
| Fixed Vocab |
| OOV |
Generated Tables
| Structure | Data | Reasoning |
|---|---|---|
| 0.00% | 0.00% | 0.00% |
| 42.55% | 41.79% | 47.74% |
| NA | 81.44% | 33.88% |
Oracle Tables
| Structure | Data | Reasoning |
|---|---|---|
| 0.00% | 0.00% | 0.00% |
| 42.29% | 27.61% | 25.48% |
| NA | 22.89% | 3.78% |
| Answer \ Template |
|---|
| Yes/No |
| Fixed Vocab |
| OOV |
Oracle Tables
| Structure | Data | Reasoning |
|---|---|---|
| 0.00% | 0.00% | 0.00% |
| 42.55% | 41.79% | 47.74% |
| NA | 82.48% | 36.01% |
Generated Tables
1%
0%
Stage-wise Analysis of our pipeline
Table Question Answering (SEMPRE)
Template wise answer accuracy on Oracle and Generated tables
| Answer \ Template |
|---|
| Yes/No |
| Fixed Vocab |
| OOV |
Generated Tables
Oracle Tables
| Answer \ Template |
|---|
| Yes/No |
| Fixed Vocab |
| OOV |
Oracle Tables
Generated Tables
10%
5%
| Structure | Data | Reasoning |
|---|---|---|
| 0.00% | 0.00% | 0.00% |
| 42.55% | 41.79.% | 47.74% |
| NA | 83% | 36.99% |
| Structure | Data | Reasoning |
|---|---|---|
| 0.00% | 0.00% | 0.00% |
| 42.29% | 27.61% | 25.48% |
| NA | 32% | 15.44% |
| Structure | Data | Reasoning |
|---|---|---|
| 0.00% | 0.00% | 0.00% |
| 42.29% | 27.61% | 25.48% |
| NA | 35.90% | 20.43% |
| Structure | Data | Reasoning |
|---|---|---|
| 0.00% | 0.00% | 0.00% |
| 42.55% | 41.79% | 47.74% |
| NA | 83% | 37.84% |