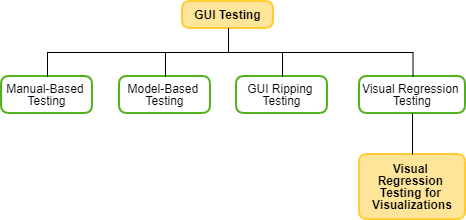
Visual regression testing for Information Visualizations
BackViz
Ing. Nychol Bazurto Gómez
Ph.D. John Alexis Guerra Gómez
Presented by
Advisor
Schedule
Problem and goals
Solution strategy
Taxonomy
BackViz design
Implementation detail
Obtained results
Conclusions and future work
Problem and goals
Lack of techniques for testing information visualizations that are able to deal with visualizations complexity.
PROBLEM


Basic interactions


Research questions
Are there any areas of current software testing research and techniques that adequately address the needs for data visualization testing?

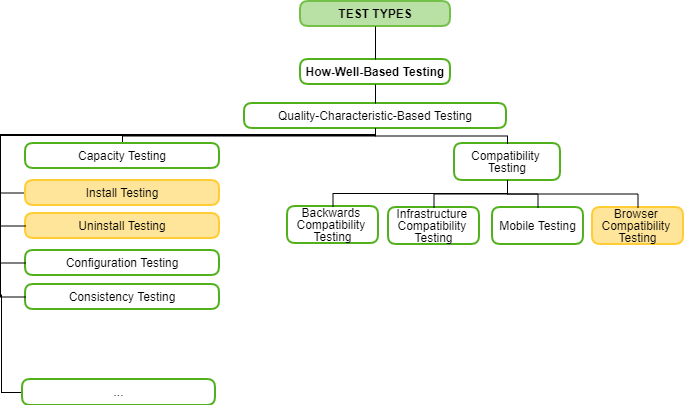
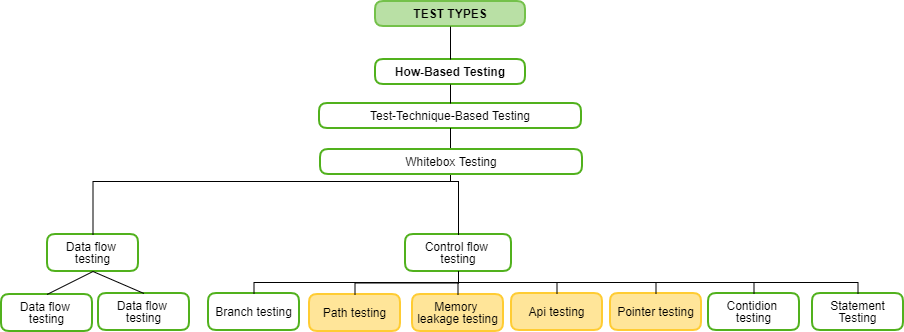
Software Engineering Institute's taxonomy
Research questions
Are there any areas of current software testing research and techniques that adequately address the needs for data visualization testing?

Or even, where is GUI testing?
How can a data visualization developer develop automated tests that cover visualization interactions and without excessive effort?
Software testing technique

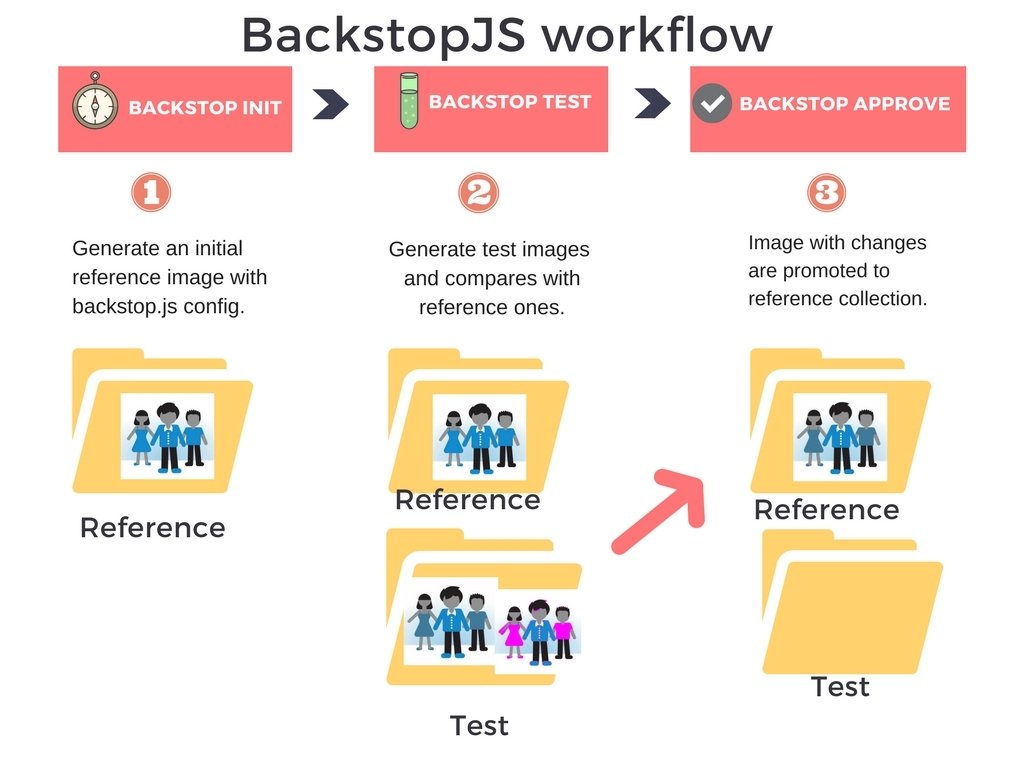
Visual regression testing
- Most errors are incorporated as "improves" the visualization.
- It's an effective technique to test CSS in web development.
- Widely used now in the industry.
1
Run some tests on the site.
2
Take screenshots of interactions/components.
3
Compare those screenshots against a baseline and report differences.
How can a data visualization developer develop automated tests that cover visualization interactions and without excessive effort?
Visual Analytics basics
VA framework
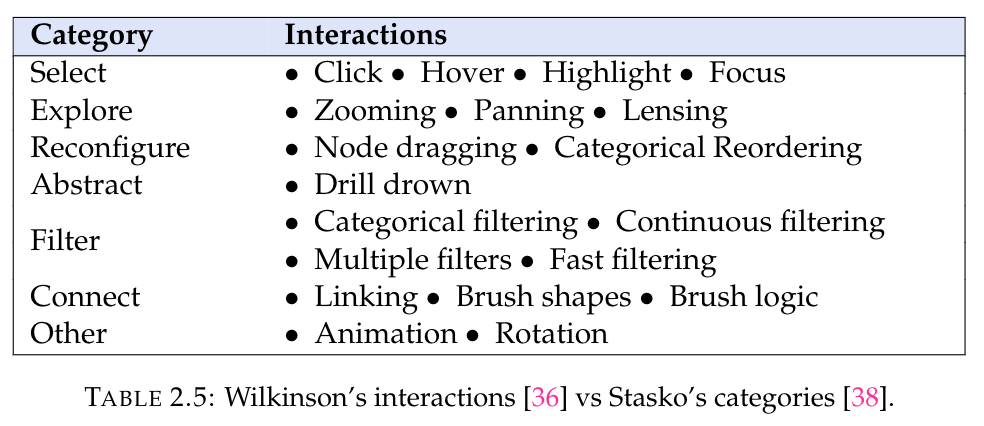
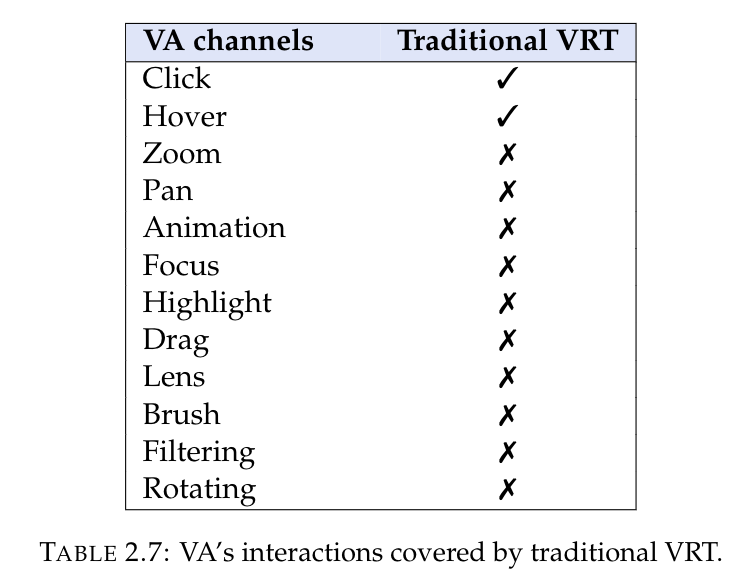
VA Interactions
Channel
Mark


How can a data visualization developer develop automated tests that cover visualization interactions and without excessive effort?

Behavior Driven Development
Solution strategy
Taxonomy strategy
Some steps from a mapping study were used to combine with systematic review
Framework strategy

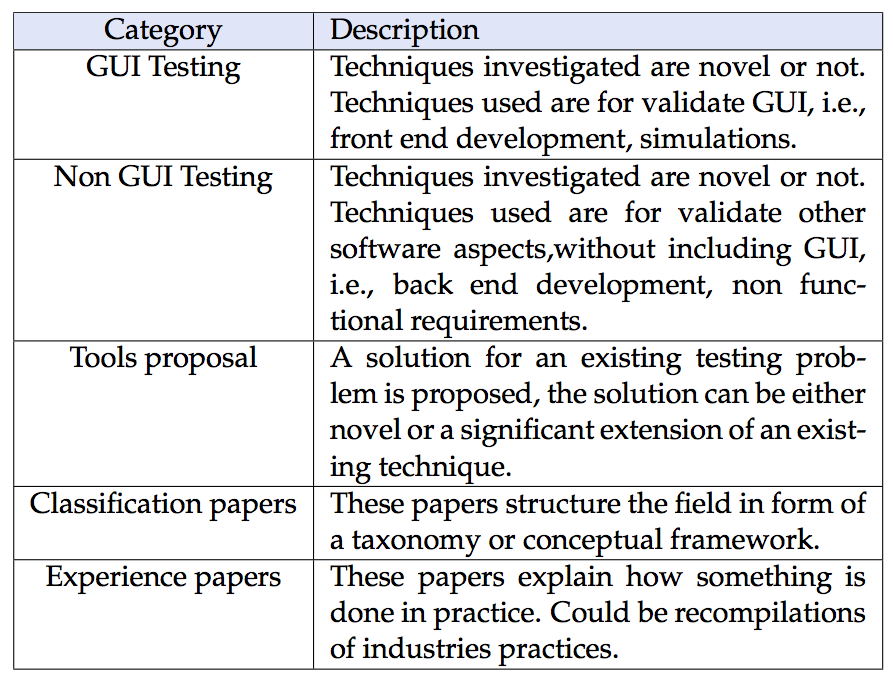
Approaches
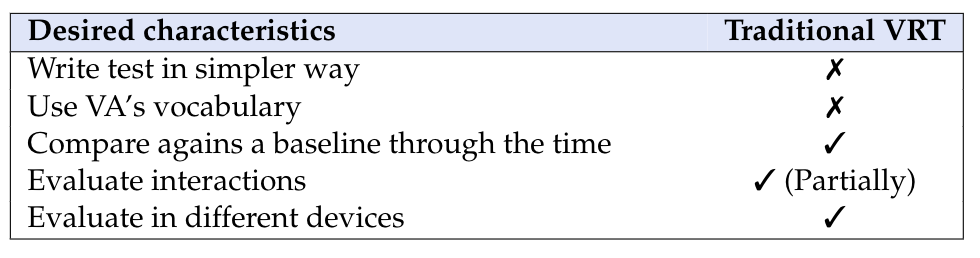
Every element it's in the same position, with the same length and if it's working according to the behavior expected in the code.
Detect if ...
Something was change related to essential concepts in visual analytics, like channel and marks linked to an interaction, e.g:
If when the user is hovering over some element and this one is red instead of blue (supposing blue was the style defined at the beginning).
Also, detecting if a filter is failing using the same data, maybe due to a new change, ignoring some datum. This is the strategy with more sense in the project case.


Strategy
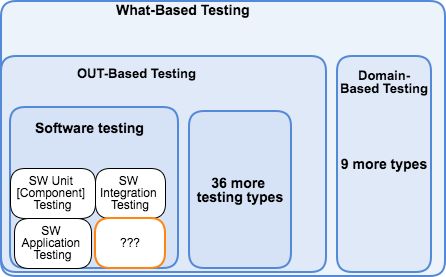
Taxonomy

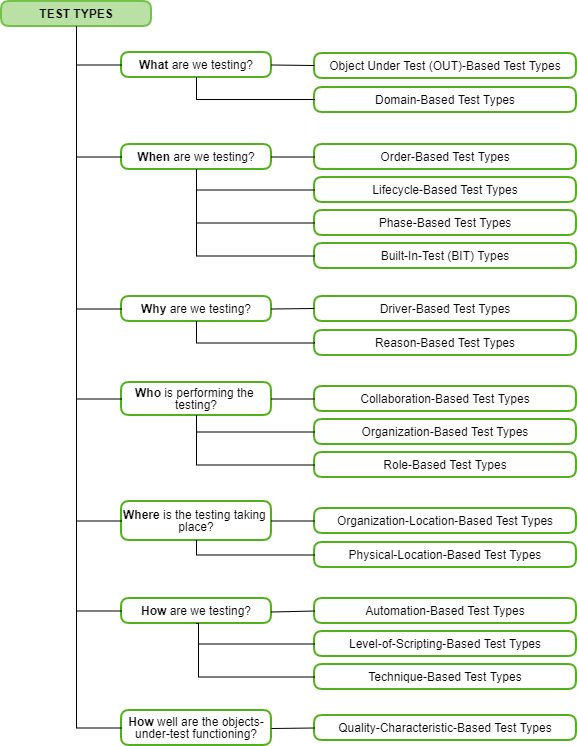
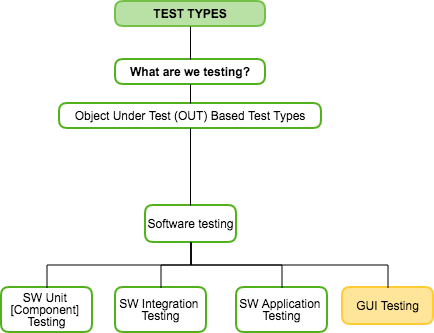
SEI Taxonomy
7 categories
200 testing types
Study selection
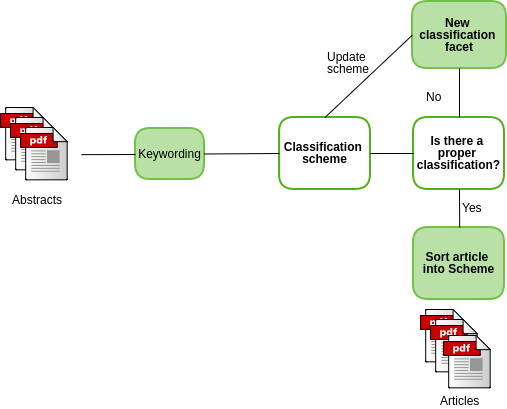
Result
Result


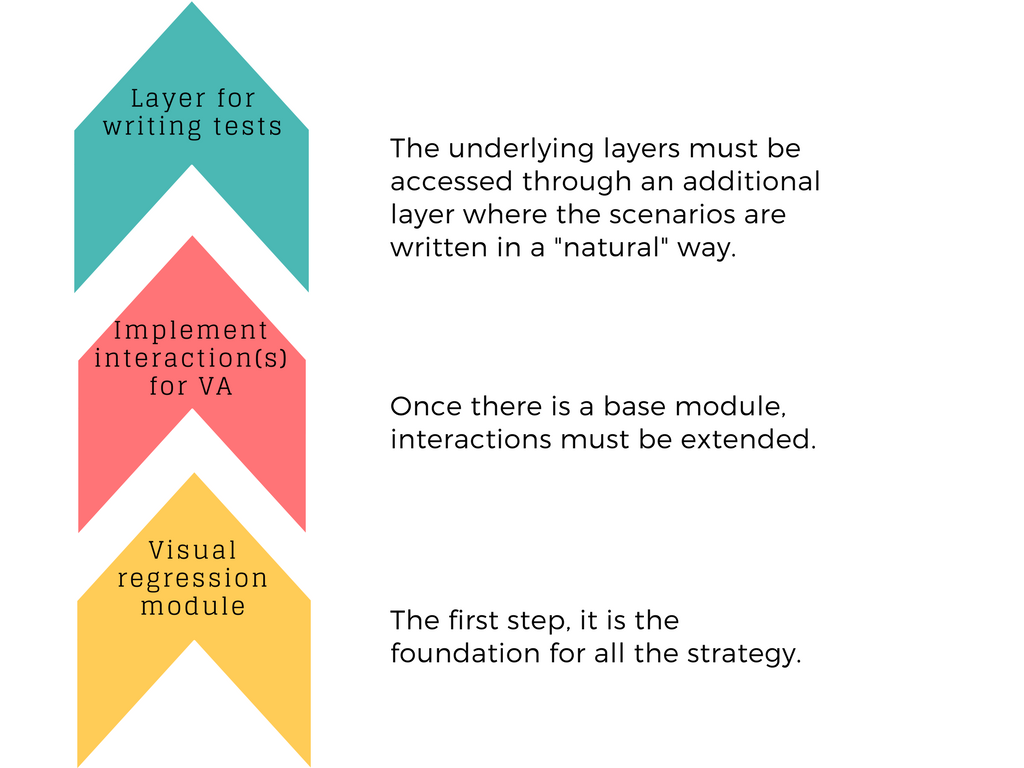
BackViz design
BDD module
VRT module
Writing tests
Interpreter
Execute
Headless Browser (Execute DOM interactions
Image comparator
Report
Tools choice
- Open source
- Cover entire flow of VRT

Percy
Tools choice

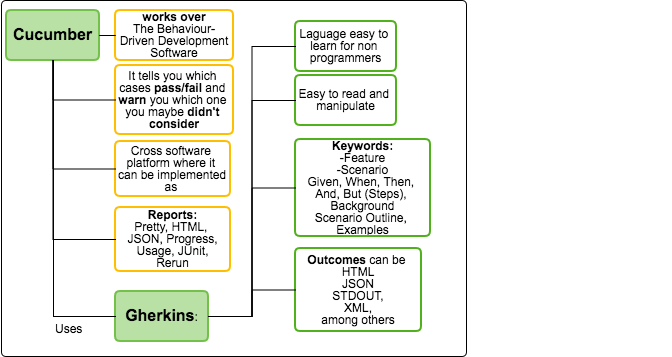
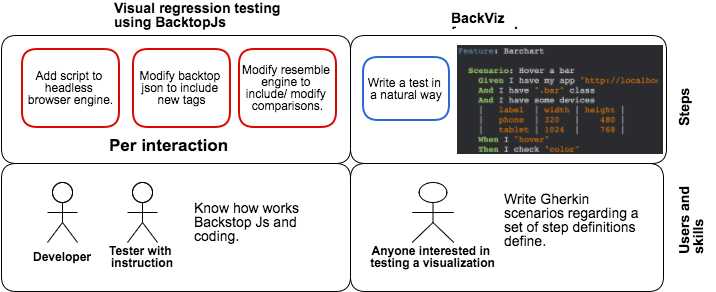
Cucumber understands the language Gherkin. It is a Business Readable, Domain Specific Language that lets you describe software's behavior.
Gherkin serves two purposes — documentation and automated tests.
Obtained results
Feature: Barchart

  Scenario: Hover a bar
    Given I have my app "http://localhost:7000/"
    And I have ".bar" class
    And I have some devices
    |   label  | width | height |
    |   phone  | 320   |    480 |
    |   tablet | 1024  |    768 |
    When I "hover"
    Then I check "color"


  Scenario: Check all data
    Given I have my app "http://localhost:7000/"
    And I have some devices
    |   label  | width | height |
    |   phone  | 320   |    480 |
    |   tablet | 1024  |    768 |
    Then I check "all"
- Color hover
- Data
Result
Result
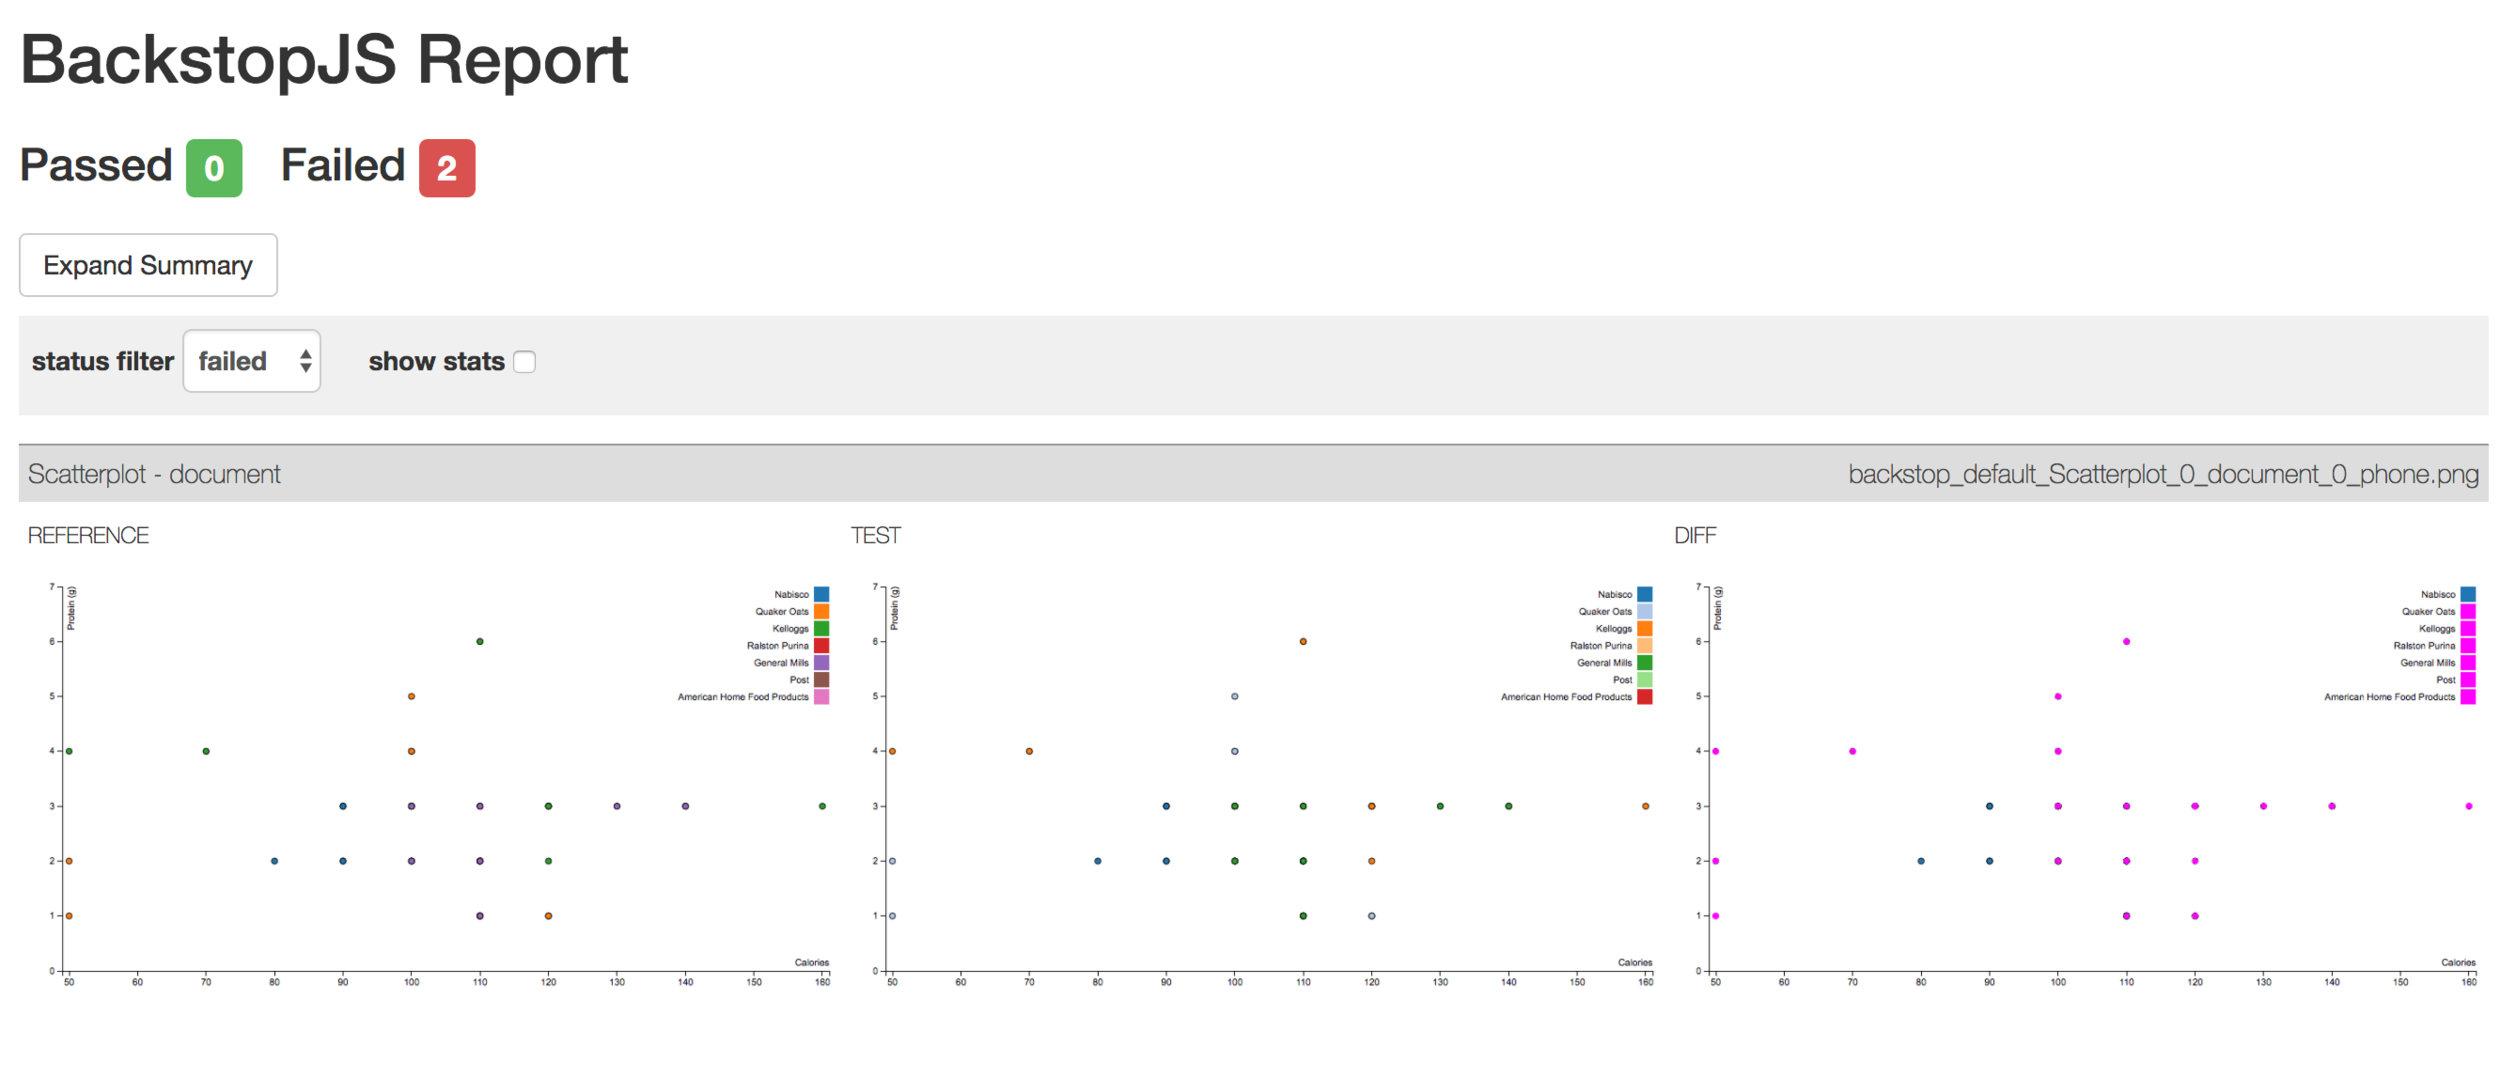
Obtained results
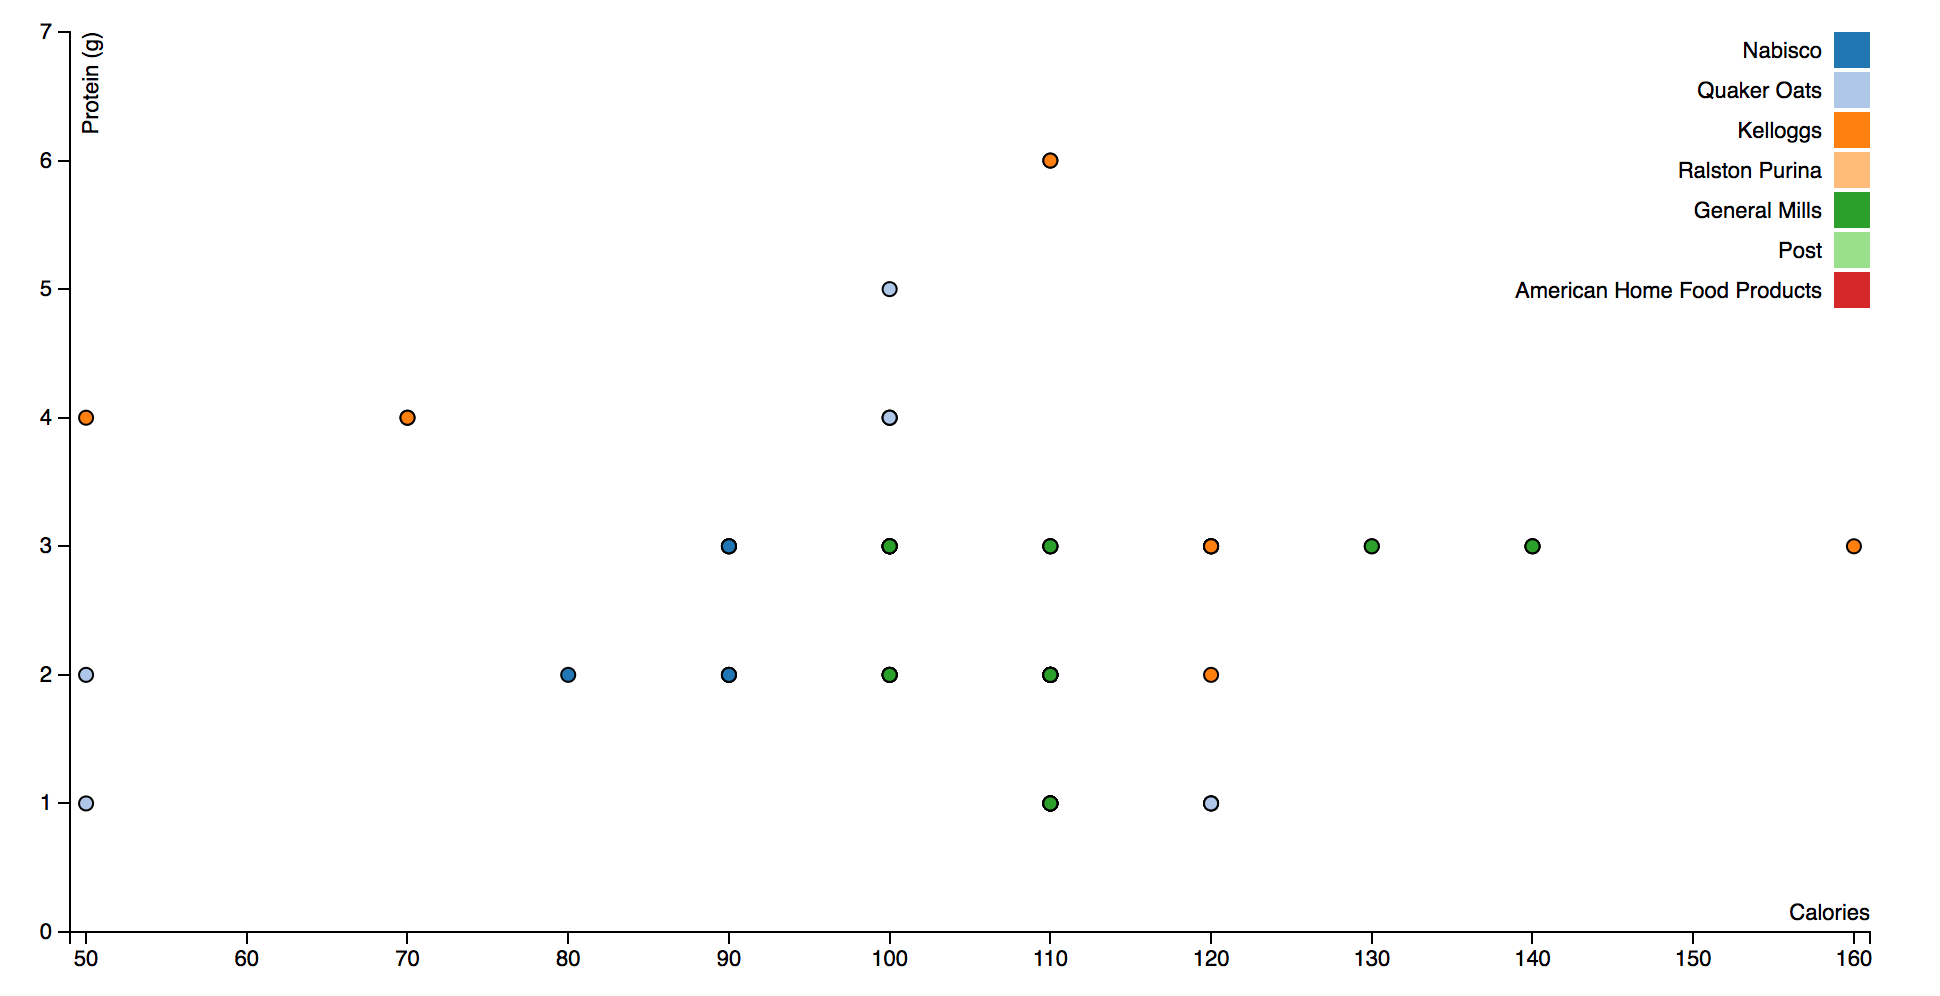
Feature: Scatterplot

  Scenario: Click a dot
    Given I have my app "http://localhost:8000/"
    And I have ".dot" class
    And I have some devices
    |   label  | width | height |
    |   phone  | 320   |    480 |
    |   tablet | 1024  |    768 |
    When I "hover"
    Then I check "embeded"

  Scenario: Check all data
    Given I have my app "http://localhost:8000/"
    And I have some devices
    |   label  | width | height |
    |   phone  | 320   |    480 |
    |   tablet | 1024  |    768 |
Then I check "all"- Color
- Shape
- Data
Obtained results
Without changes
Obtained results
Color changes
// setup fill color
var cValue = function(d) { return d.Manufacturer;},
    color = d3.scale.category20();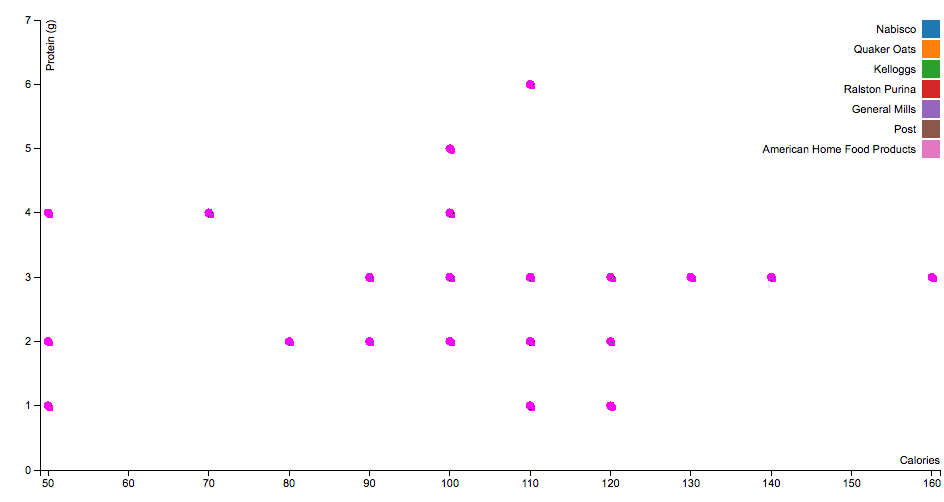
Shape changes
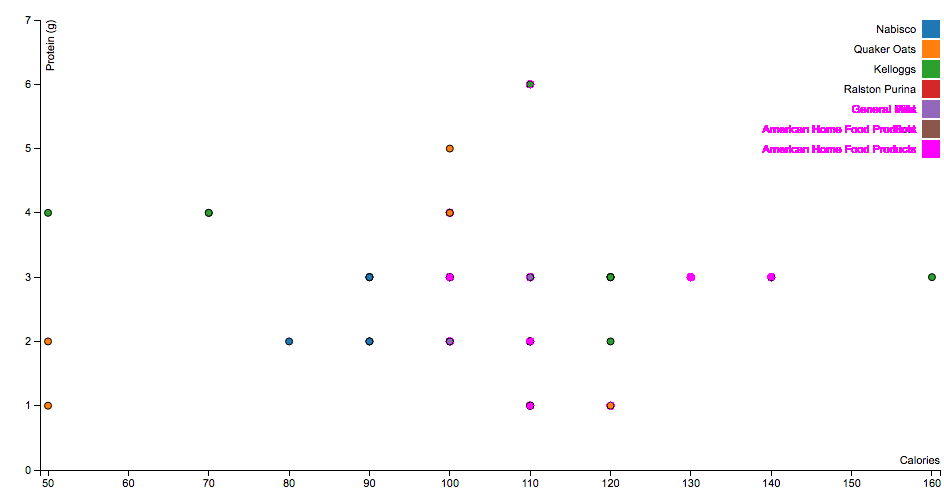
      "misMatchThreshold" : 0.1,
      "requireSameDimensions": true
Less data
Obtained results
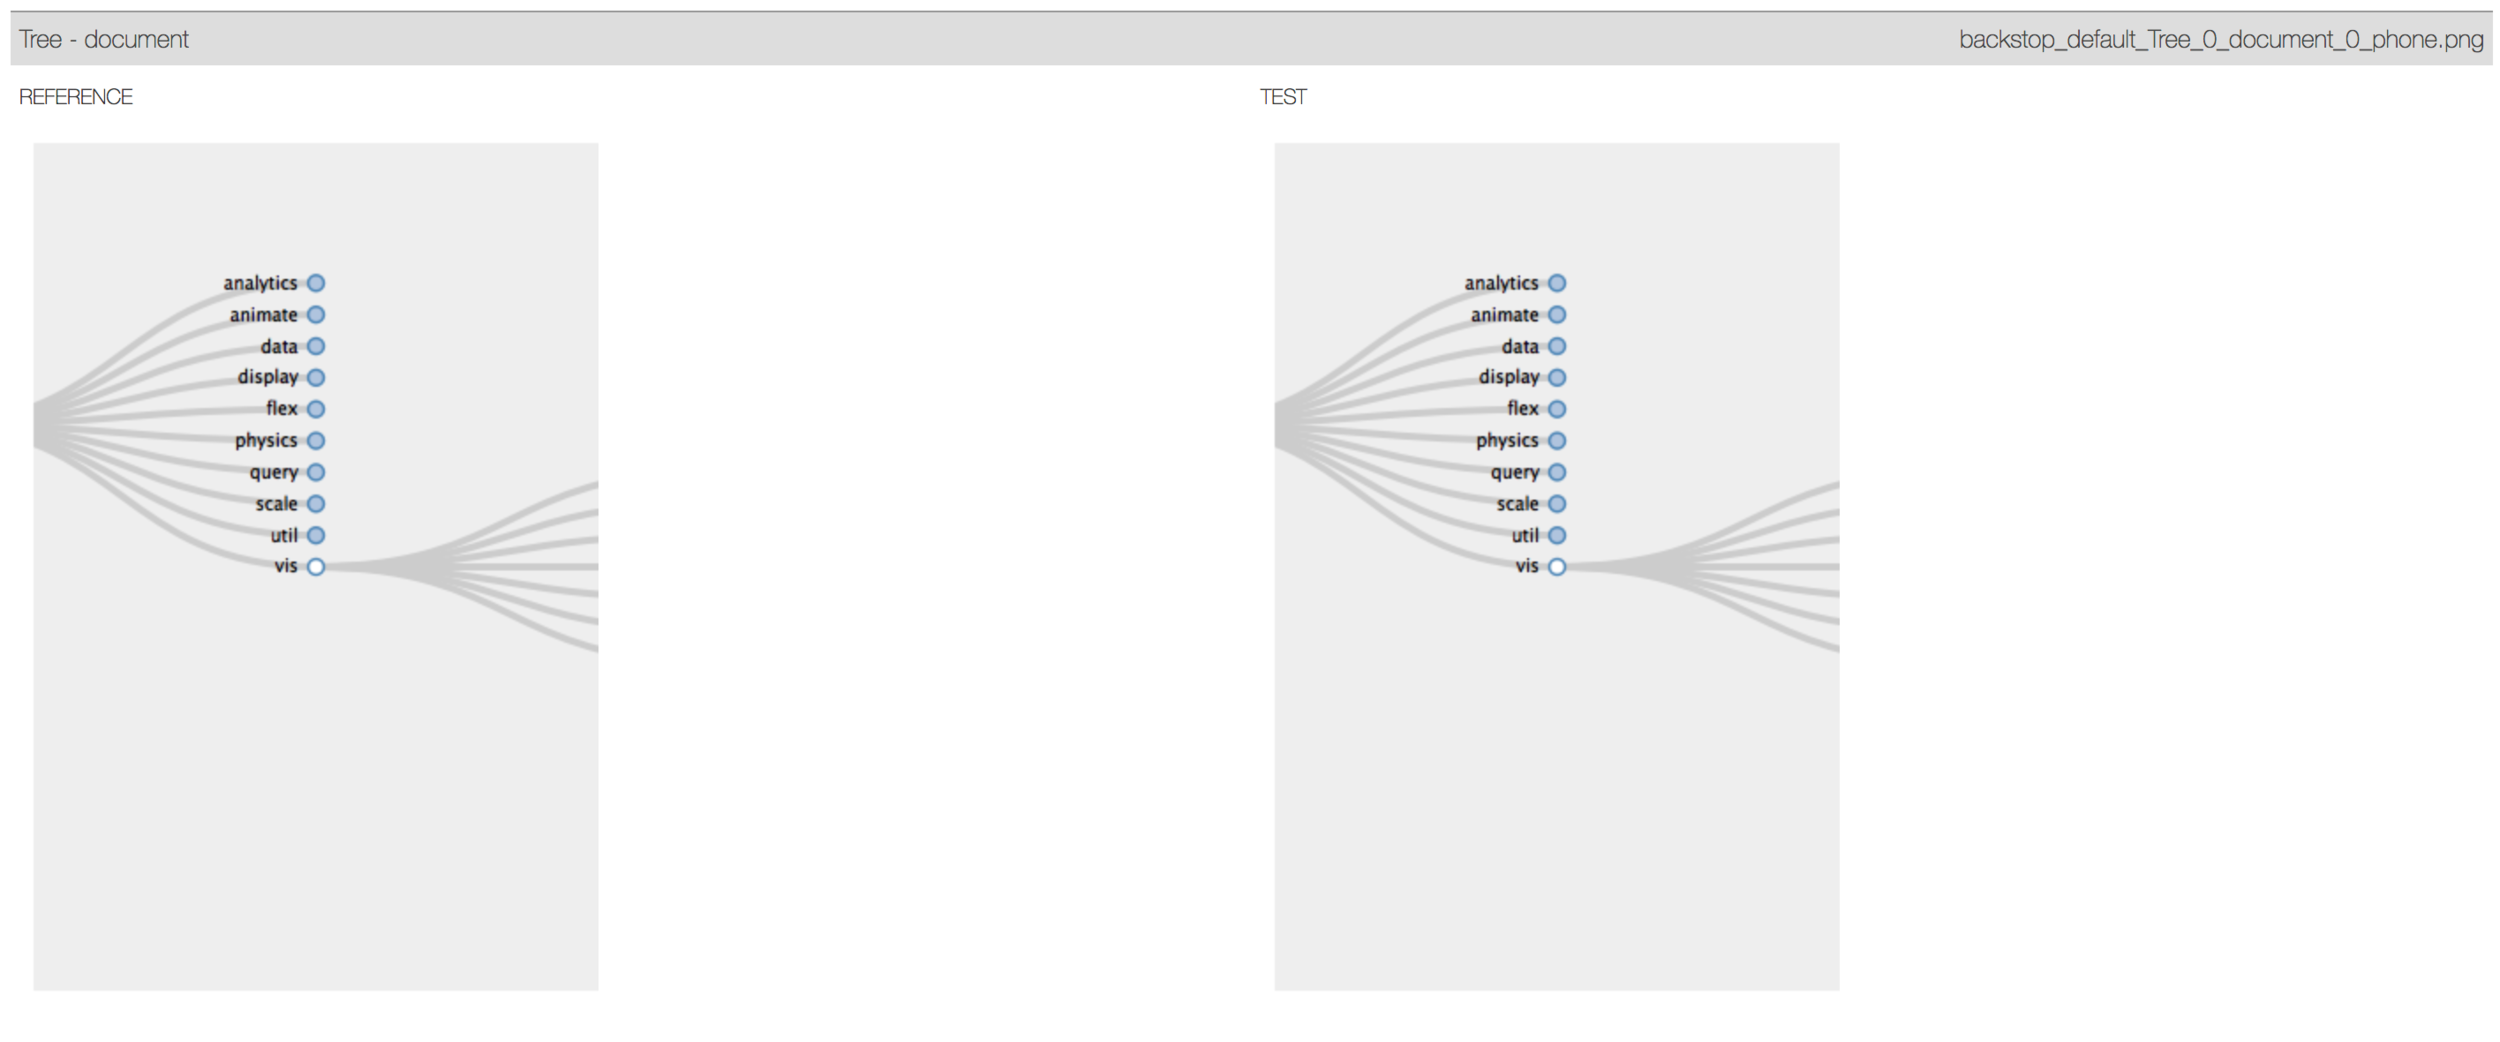
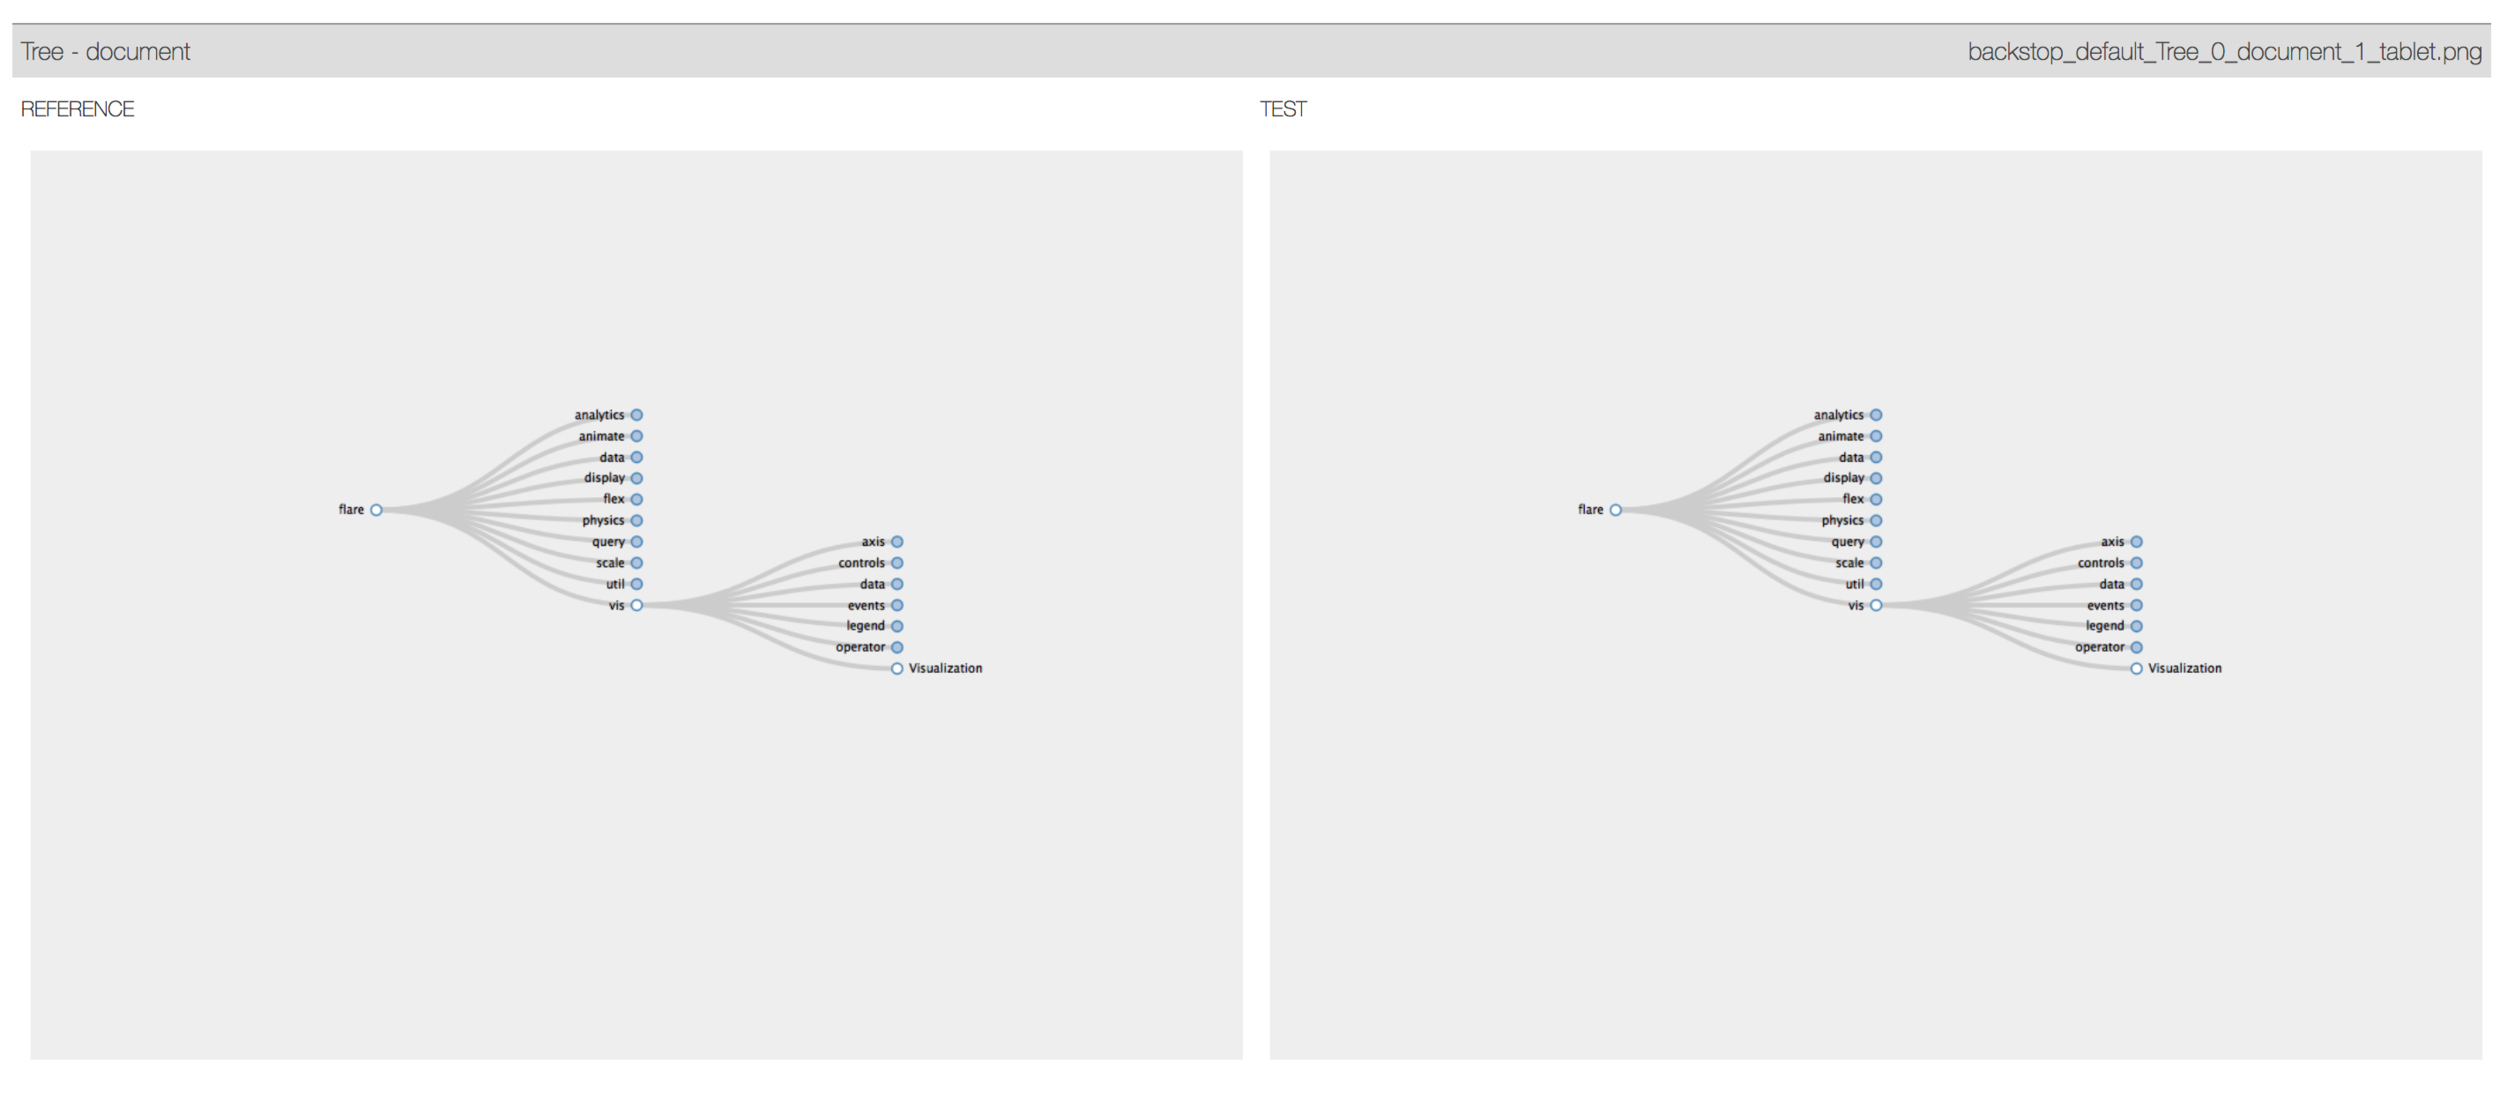
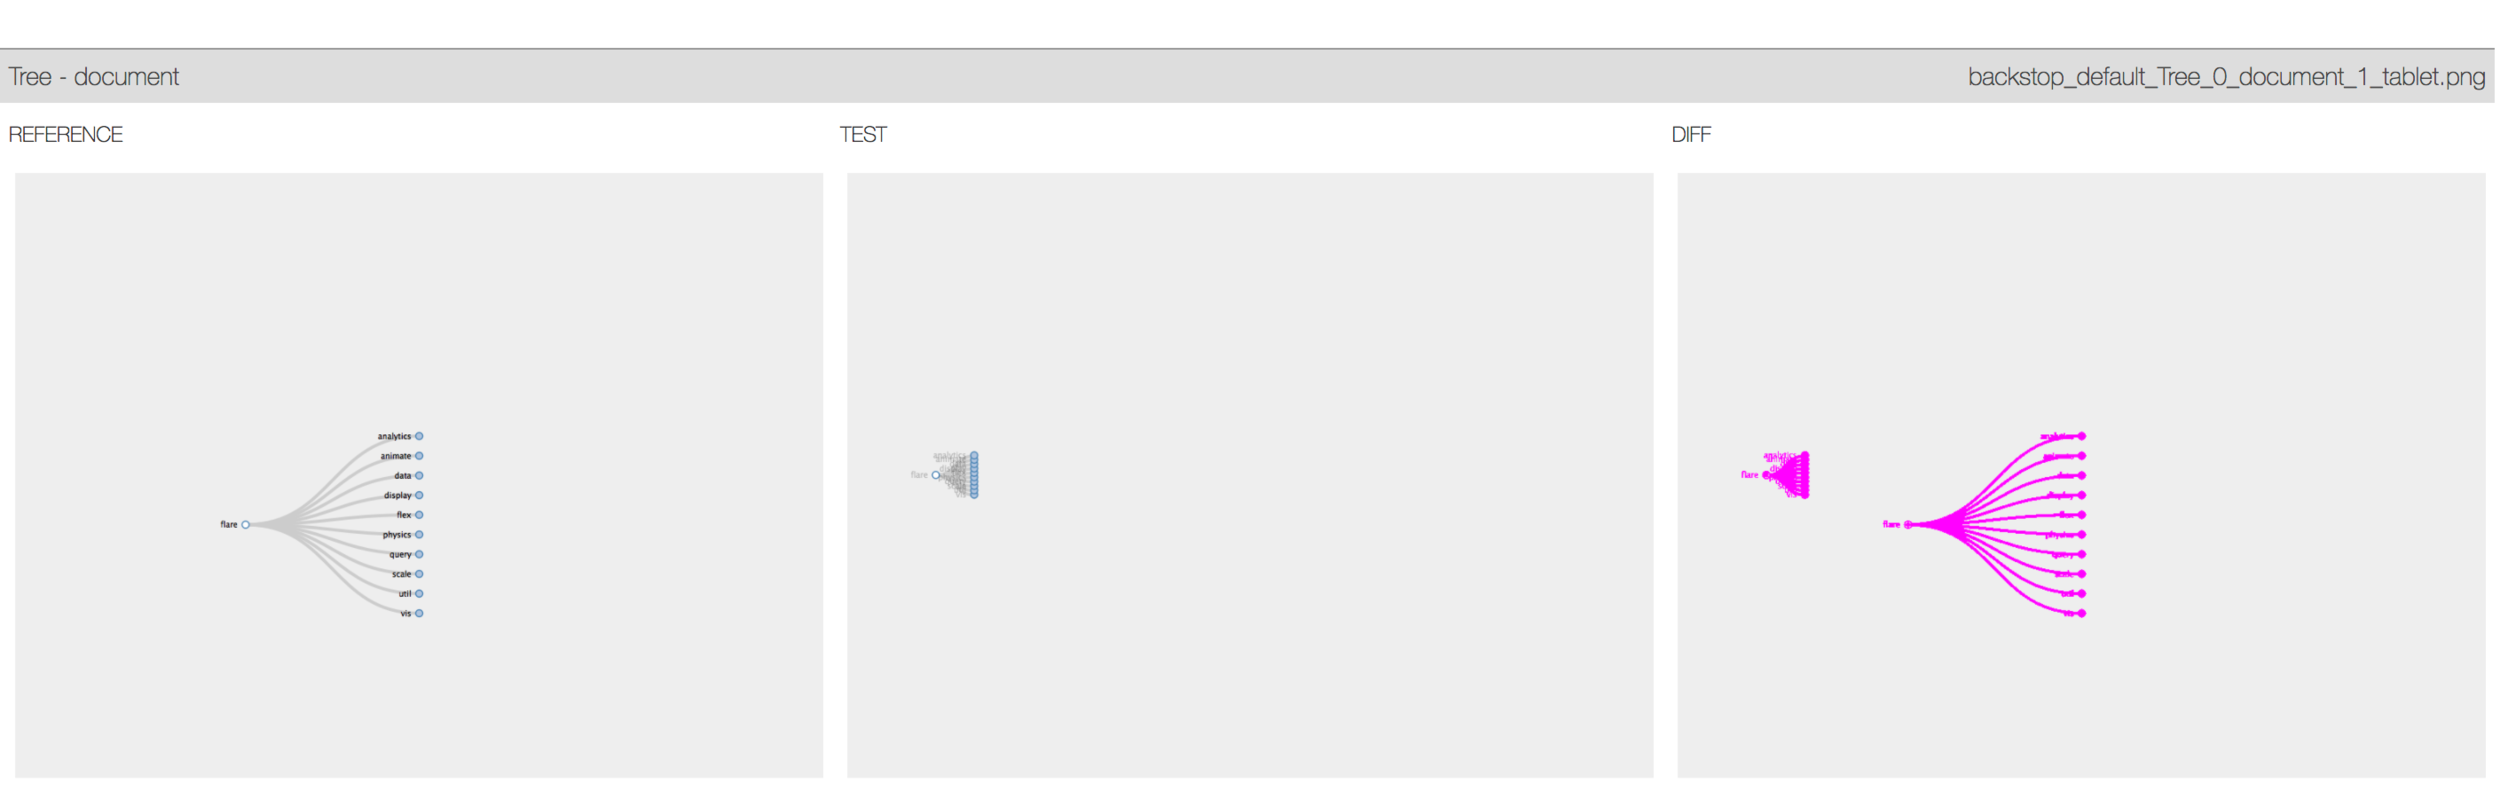
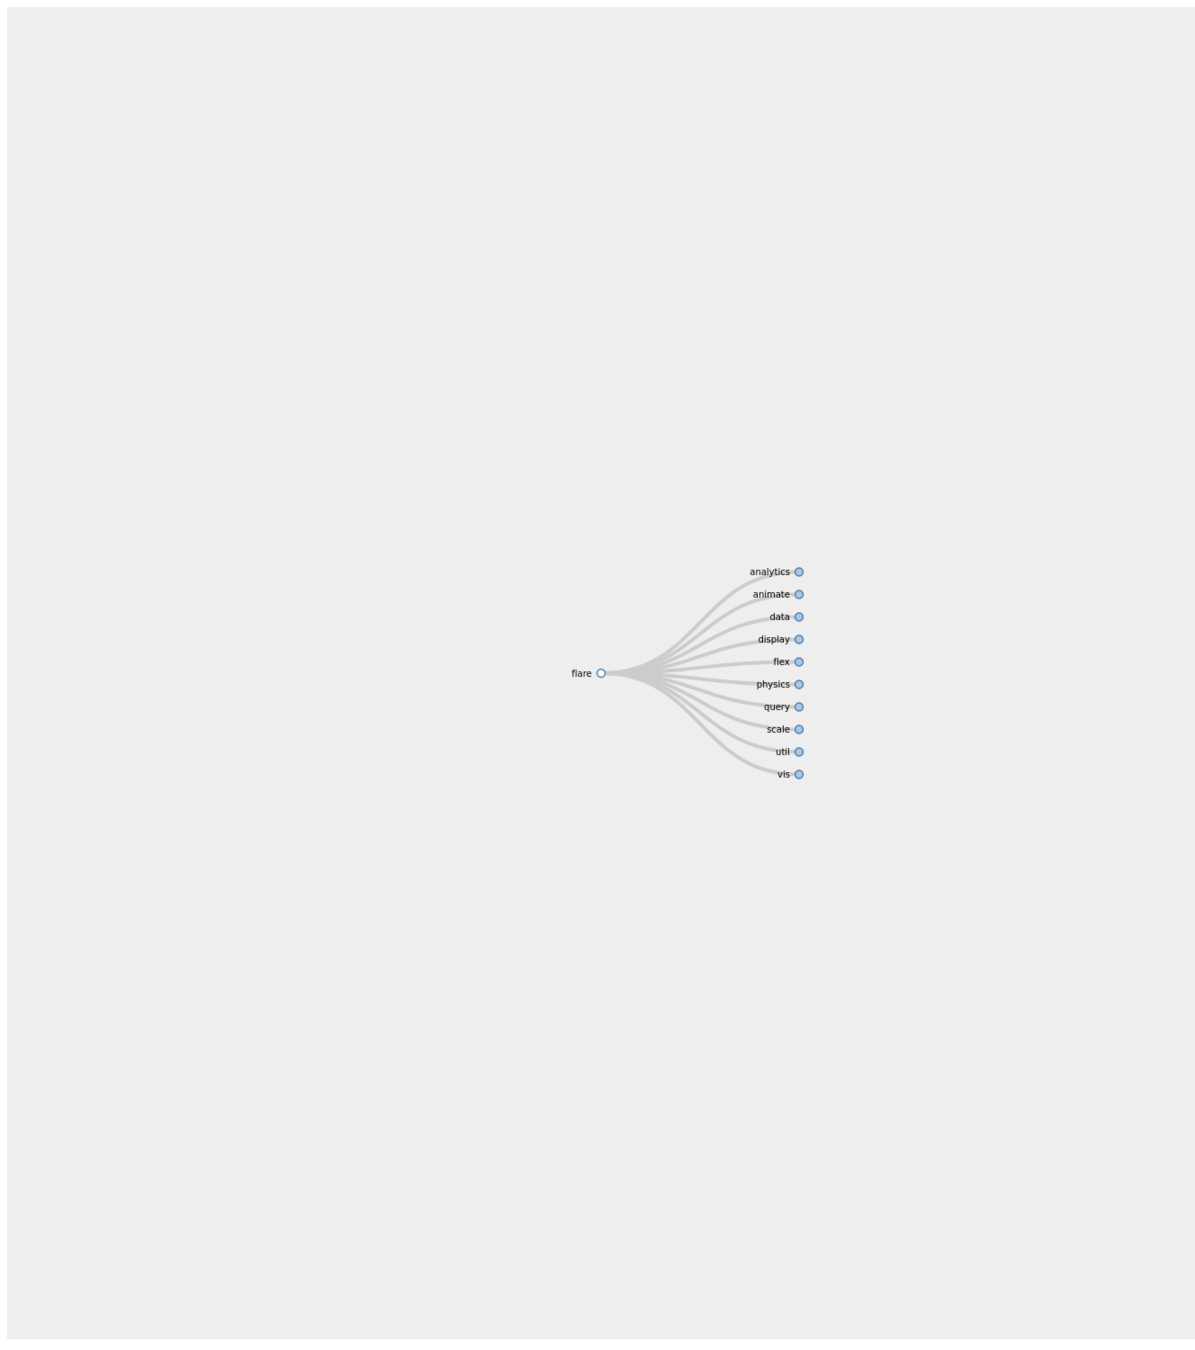
Feature: Tree

  Scenario: Drag a node
    Given I have my app "http://localhost:8000/"
    And I have ".nodeCircle" class
    And I have some devices
    |   label  | width | height |
    |   phone  | 320   |    480 |
    |   tablet | 1024  |    768 |
    When I "drag"
    Then I check "position"

  Scenario: Click a node
    Given I have my app "http://localhost:8000/"
    And I have ".nodeCircle" class
    And I have some devices
    |   label  | width | height |
    |   phone  | 320   |    480 |
    |   tablet | 1024  |    768 |
    When I "click"
Then I check "expand"- Click
- Drag
Click
Obtained results
Drag and drop
Some issues

Chromy
pkill -f "(chrome)?(--headless)"- Cookies
- Zombie chrome-headless instances

Some issues
Drag and drop implementation
//Llamamos a la libreria de casper
var casper = require("casper").create({
    viewportSize: {
        width: 1024,
        height: 768
    }
});

casper.start('http://localhost:9000', function() {
    this.wait(2000);
    this.capture('before.png');
    this.mouse.down(400, 550);

       this.mouse.move(850, 650);
}).then(function() {
    this.mouse.up(910, 700);
}).then(function() {
    this.capture('after.png');
    });

casper.run();
Slimer


before
after
BackViz!
Conclusions
- Design and implementation of a prototype framework to perform testing on visualizations, BackViz. It enriches the development process (particularly testing) of the visualizers.
- Propose a taxonomy of testing types, which establishes a notion of the existing techniques and the gap to test systems of the nature of visualizations.
- Letting them establish their tests and applied along the time, detecting bugs or undesired changes incorporated through new releases.
- The dynamism of the idioms in VA, demands an update of the possible steps and interactions.
Future work
The complexity of possible test scenarios for visualizations, keeping in mind the universe of interactions and the possibility of combining different idioms, maximizes the importance of the existence of a testing mechanism. For this reason, it is necessary to fully implement the framework that is not part of the scope of this project.

Other possible testing techniques could be applied as would be the static code analysis, to narrow the visualizer scenarios and guarantee that their tests are defined explicitly within what is possible according to the code.
A validation process of the entire library for a diverse set of visualizations is necessary.
Complete Systematic Review could be done, in order to cover all steps and produces a taxonomy more strict in software engineering sense.
Bibliography
Bibliography