Climate change impact on flood hazard over Italy
Adriano Fantini
PhD Course in Earth Science, Fluid Dynamics, and Mathematics
Supervisor: Erika Coppola
ADRIANO.FANTINI@phd.units.it
Aims
- Flood hazard mapping over Italy
- Scientific, reliable approach
- Future projections
Models
- ICTP RegCM Regional Climate Model
- CHyM hydrological model
- CA2D hydraulic model
Project overview
Participants
- Erika Coppola
- Rita Nogherotto
- Filippo Giorgi
- Adriano Fantini
- Francesca Raffaele
-
Can a model chain of climate, hydrological and hydraulic models reproduce flood hazard?
-
How does climate change impact flood hazard over Italy?
-
What is the link between changes in precipitation extremes and changes in flood hazard?
Research questions
Methodology
Precipitation:
- Observations
- RCM output
Gridded netCDF:
- River network
- Discharges
hydrological model

For each RP, cell:
- Gumbel distr.
- Hydrographs
- Extreme Q
Statistical analysis
For each RP, cell:
- Flood extent
- Flood depth
(multiple simulations)
- RCM output
- Discharges
- Floods
Validation and change for

CA2D hydraulic model
Based on Maione et al., 2003
(over nine domains)
2
3
4
5
1.0 - Flood hazard: overview
RISK
=
HAZARD
×
EXPOSURE
×
COPING FACTOR
Event probability, Return Period
Goods, people and services exposed
Emergency plans, adaptation strategies
1.1 - Flood hazard: overview
What variables are we interested in?
DIRECT
- Flood extent
- Flood water depth
- Flood water speed
- Precipitation extremes
- Discharge extremes
PROXIES
1.2 - Flood hazard: overview
Methods used to obtain hazard maps:
- Historical discharge and flooding records
- Documentary evidence from past events
- Local surveys
- Hydrological + hydraulical modelling
Advantages:
- Possible on any region/basin, also large scale
- Extreme value analysis extends to any Return Period
- Climate projections can drive the models (future change)
- Uncertainty can be assessed via ensemble modelling
PRECIPITATION
DISCHARGE
FLOOD
HYDROLOGICAL MODEL
HYDRAULICAL MODEL
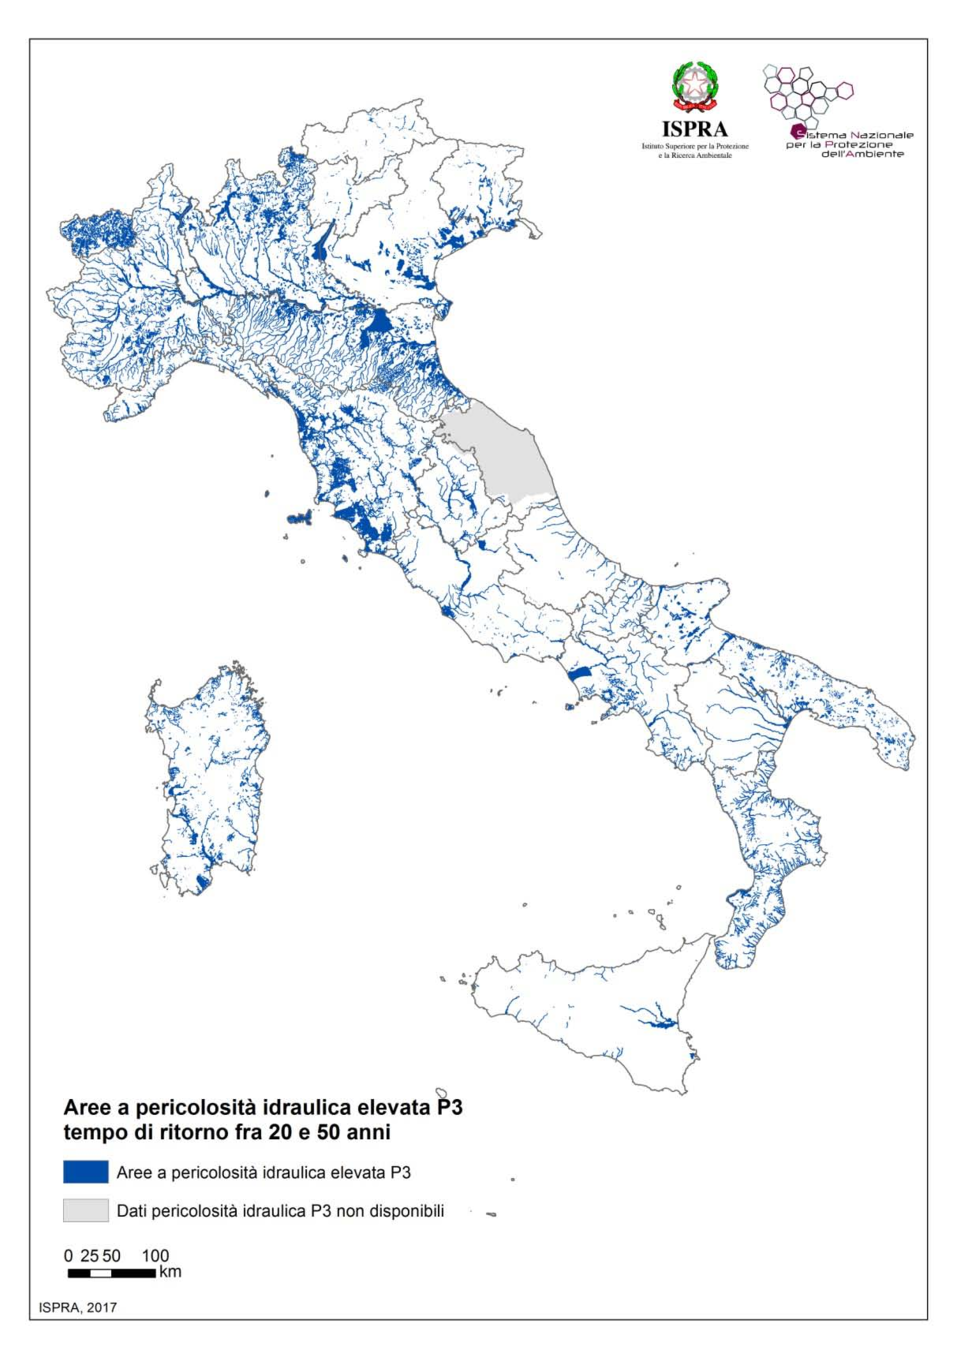
1.3 - Flood hazard: overview
Flood hazard over Italy (PRESENT DAY)
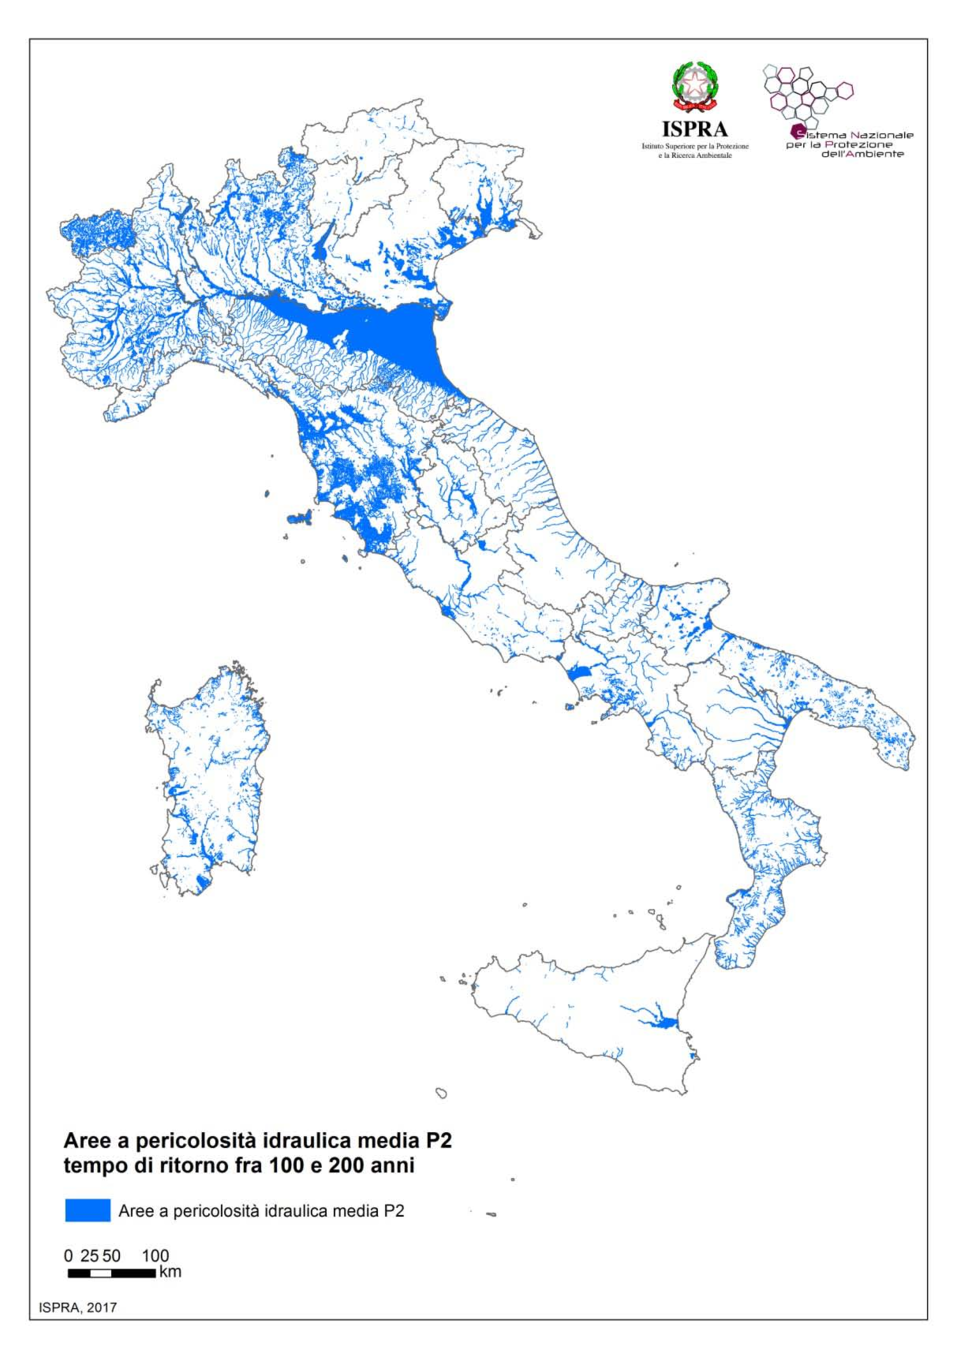
ISPRA (2018), Dissesto idrogeologico in Italia: pericolosità e indicatori di rischio
Return Period:
100-200 yrs
CURRENT KNOWLEDGE
ISPRA data obtained from the single regional agencies.
Issues:
- Undisclosed methodologies
- Non-uniform approach
- No future projections
1.4 - Flood hazard: overview
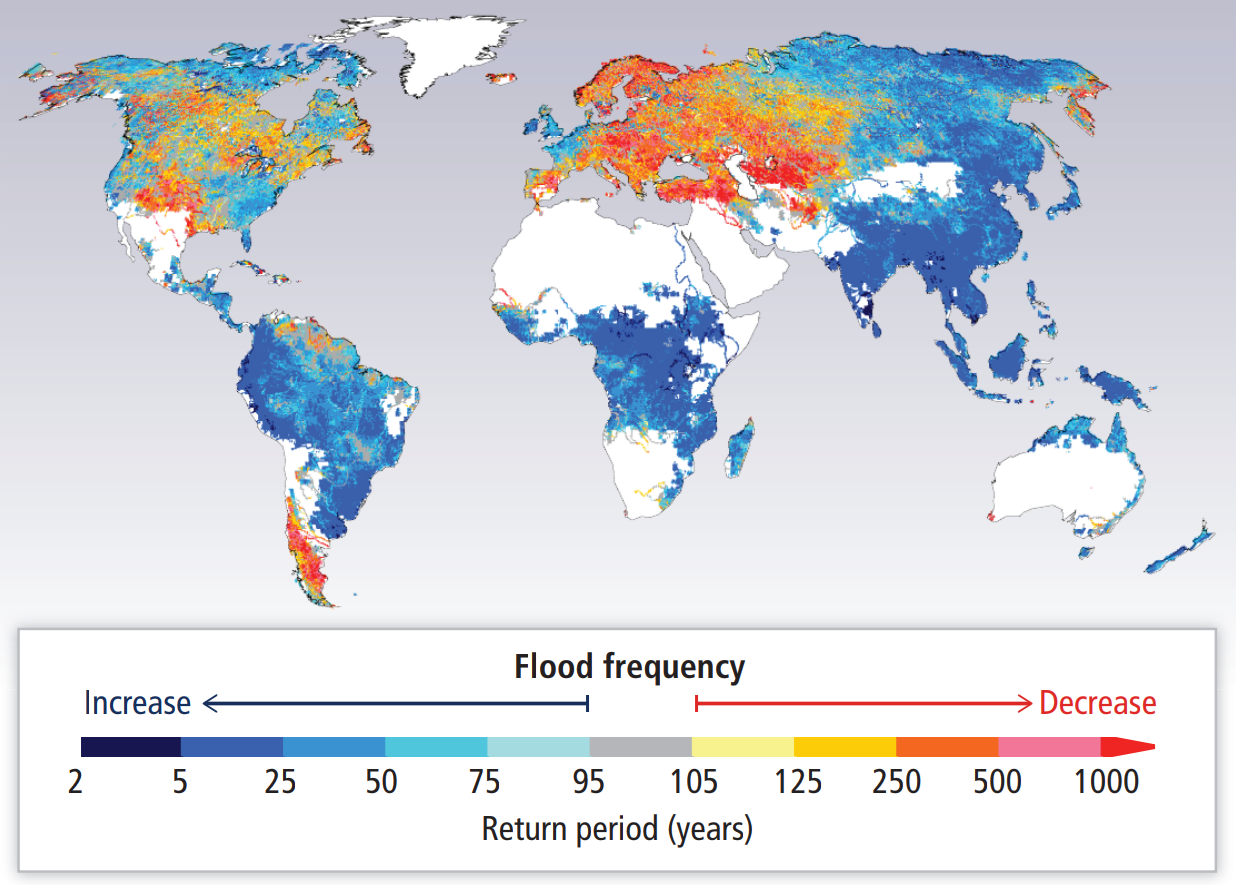
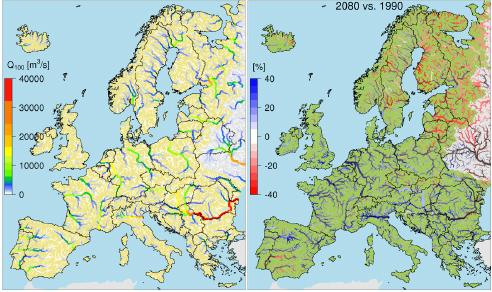
Flood hazard over Italy (FUTURE CHANGE)
- Several studies available
- No study specific to Italy
- Relatively low resolution (>5km)
- No flood extents, only flood proxies (extreme discharge)
Results over Italy:
- General increase in flood proxies by the end of the century
- Especially for Northern Italy
- Low resolution does not resolve smaller basins
Alfieri et al. (2015); Thober et al. (2018); Donnelly et al. (2017)
Hirabayashi et al. (2013); Rojas et al. (2012);
2.0 - The GRIPHO dataset
Two main goals:
- Driving the hydrological model with high resolution data
- Validating the regional climate simulations
Raw station data provided by Marco Verdecchia (CETEMPS):
- 2001 - present
- Hourly
- 3712 stations
- No quality check
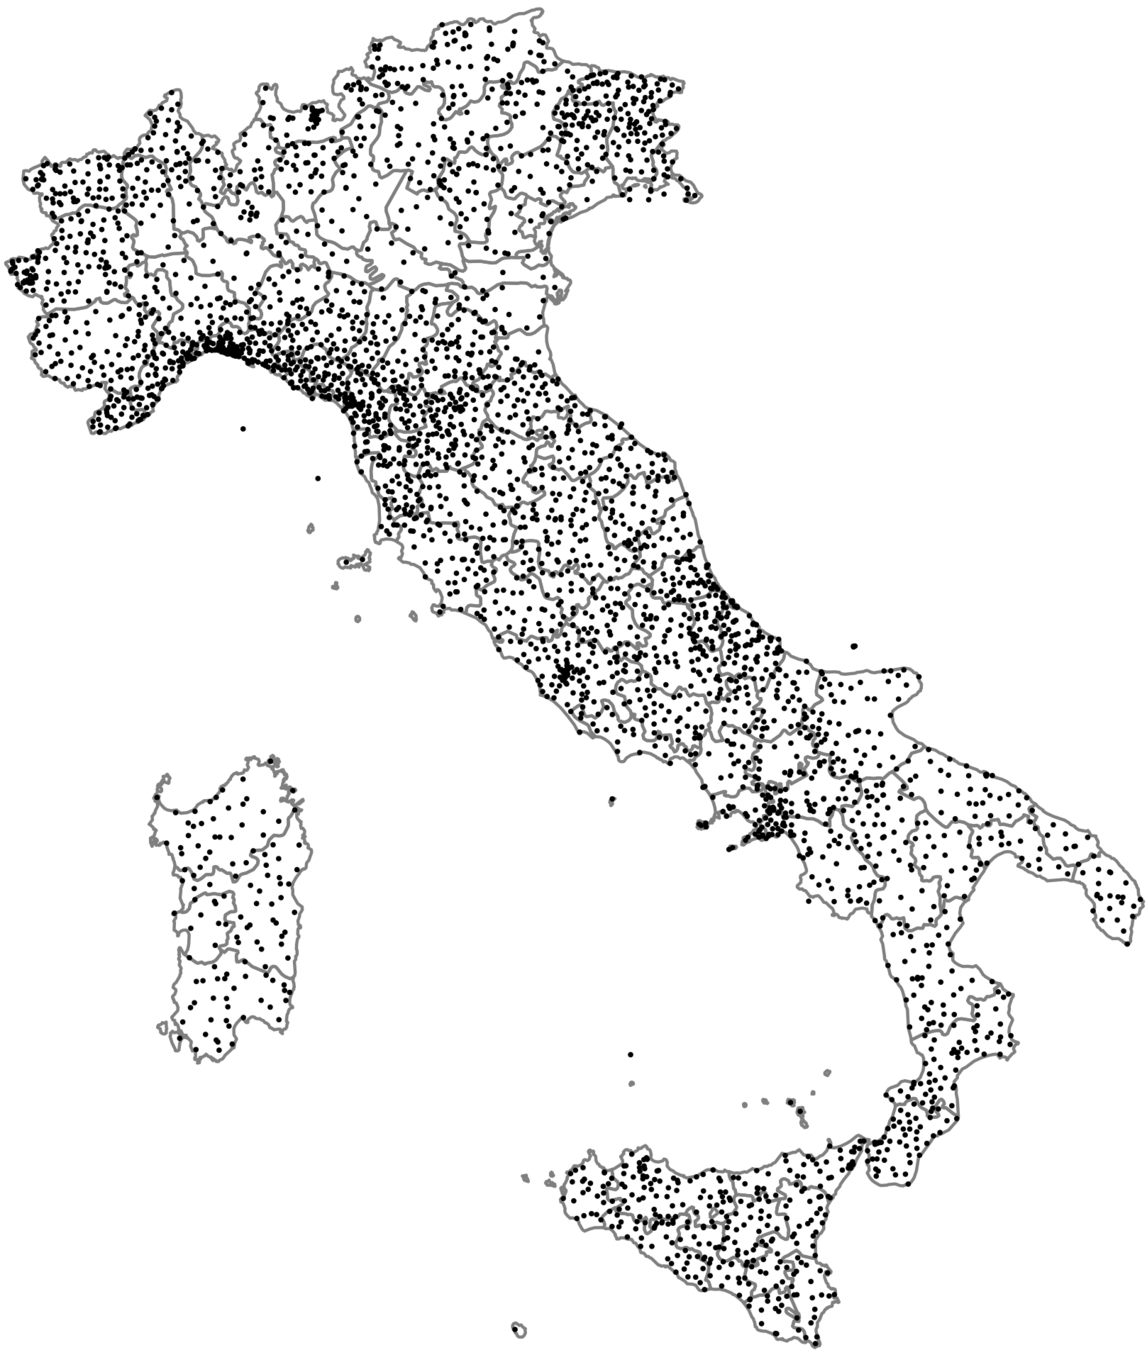
GRIPHO
(GRidded Italian Precipitation Hourly Observations)
2.1 - The GRIPHO dataset
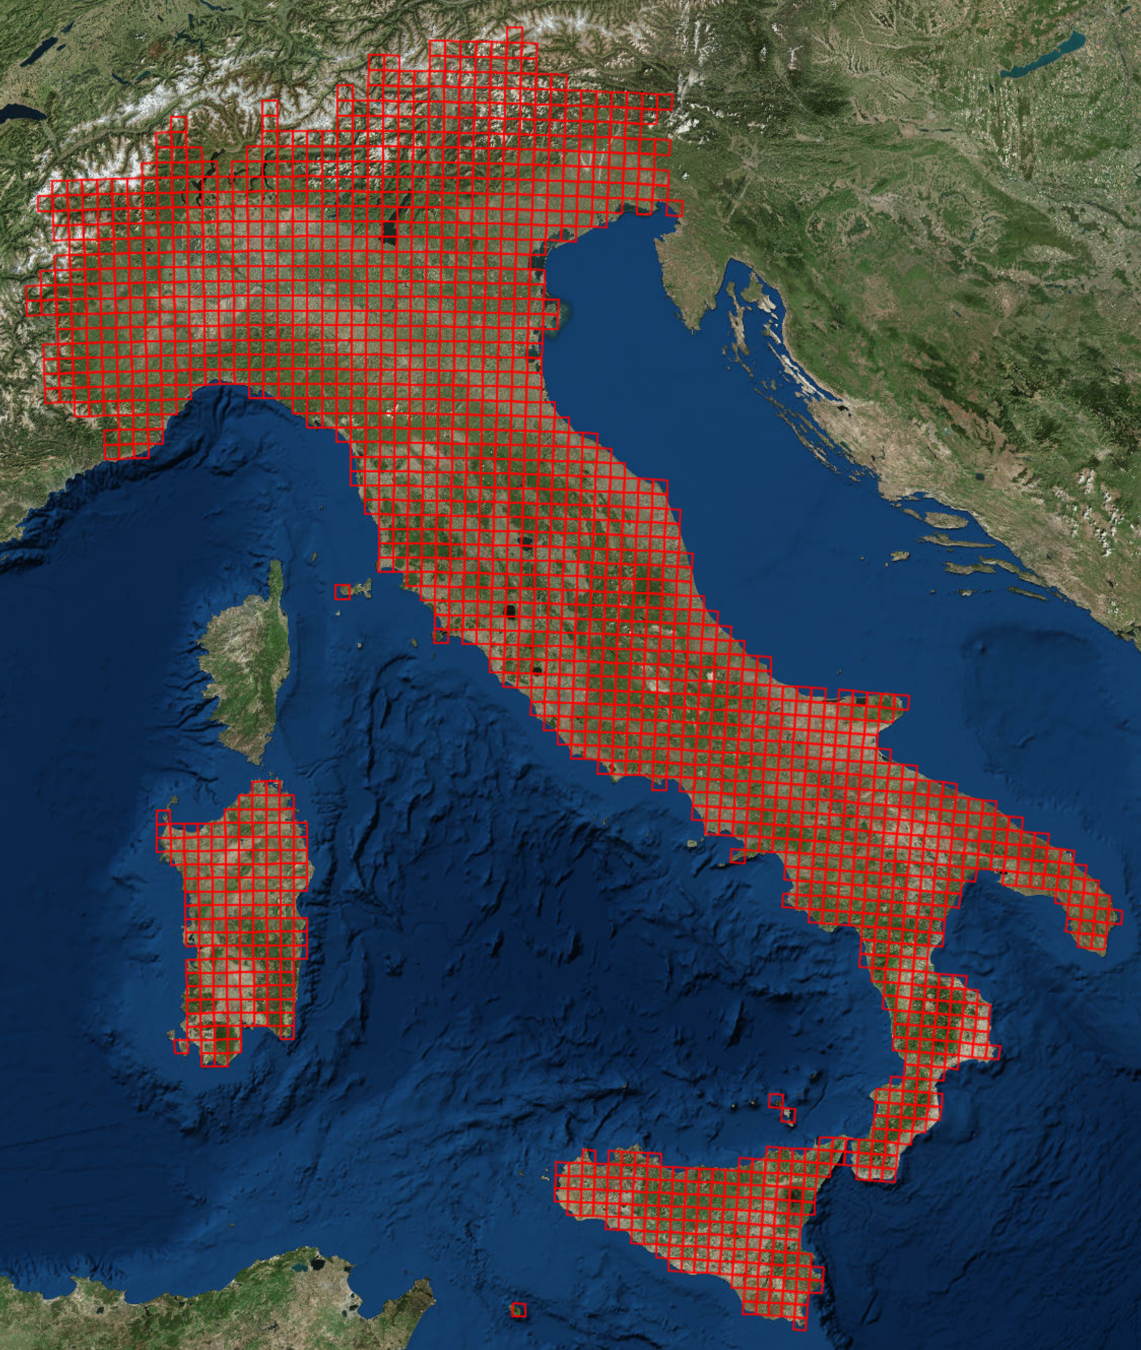
Gridding
- 12km Lambert Conformal Conic grid
-
Gridding method based on Delaunay polygons using SciPy's interpolate.griddata
- Simple, fast method which minimizes smoothing
- Similar to Norway's KLIMAGRID dataset (Mohr, 2008, 2009)
- NetCDF CF-compliant output format
Mohr M., 2008: New Routines for Gridding of Temperature and Precipitation Observations for seNorge.no
Mohr M., 2009: Comparison of versions 1.1 and 1.0 of gridded temperature and precipitation data for Norway
Velasquez N. et al., 2011: Rainfall distribution based on a Delaunay triangulation method
2.2 - The GRIPHO dataset
Issues:
- Varying station availability and density across the domain
- Inconsistencies, outliers and data errors
- Only ~15 years or data
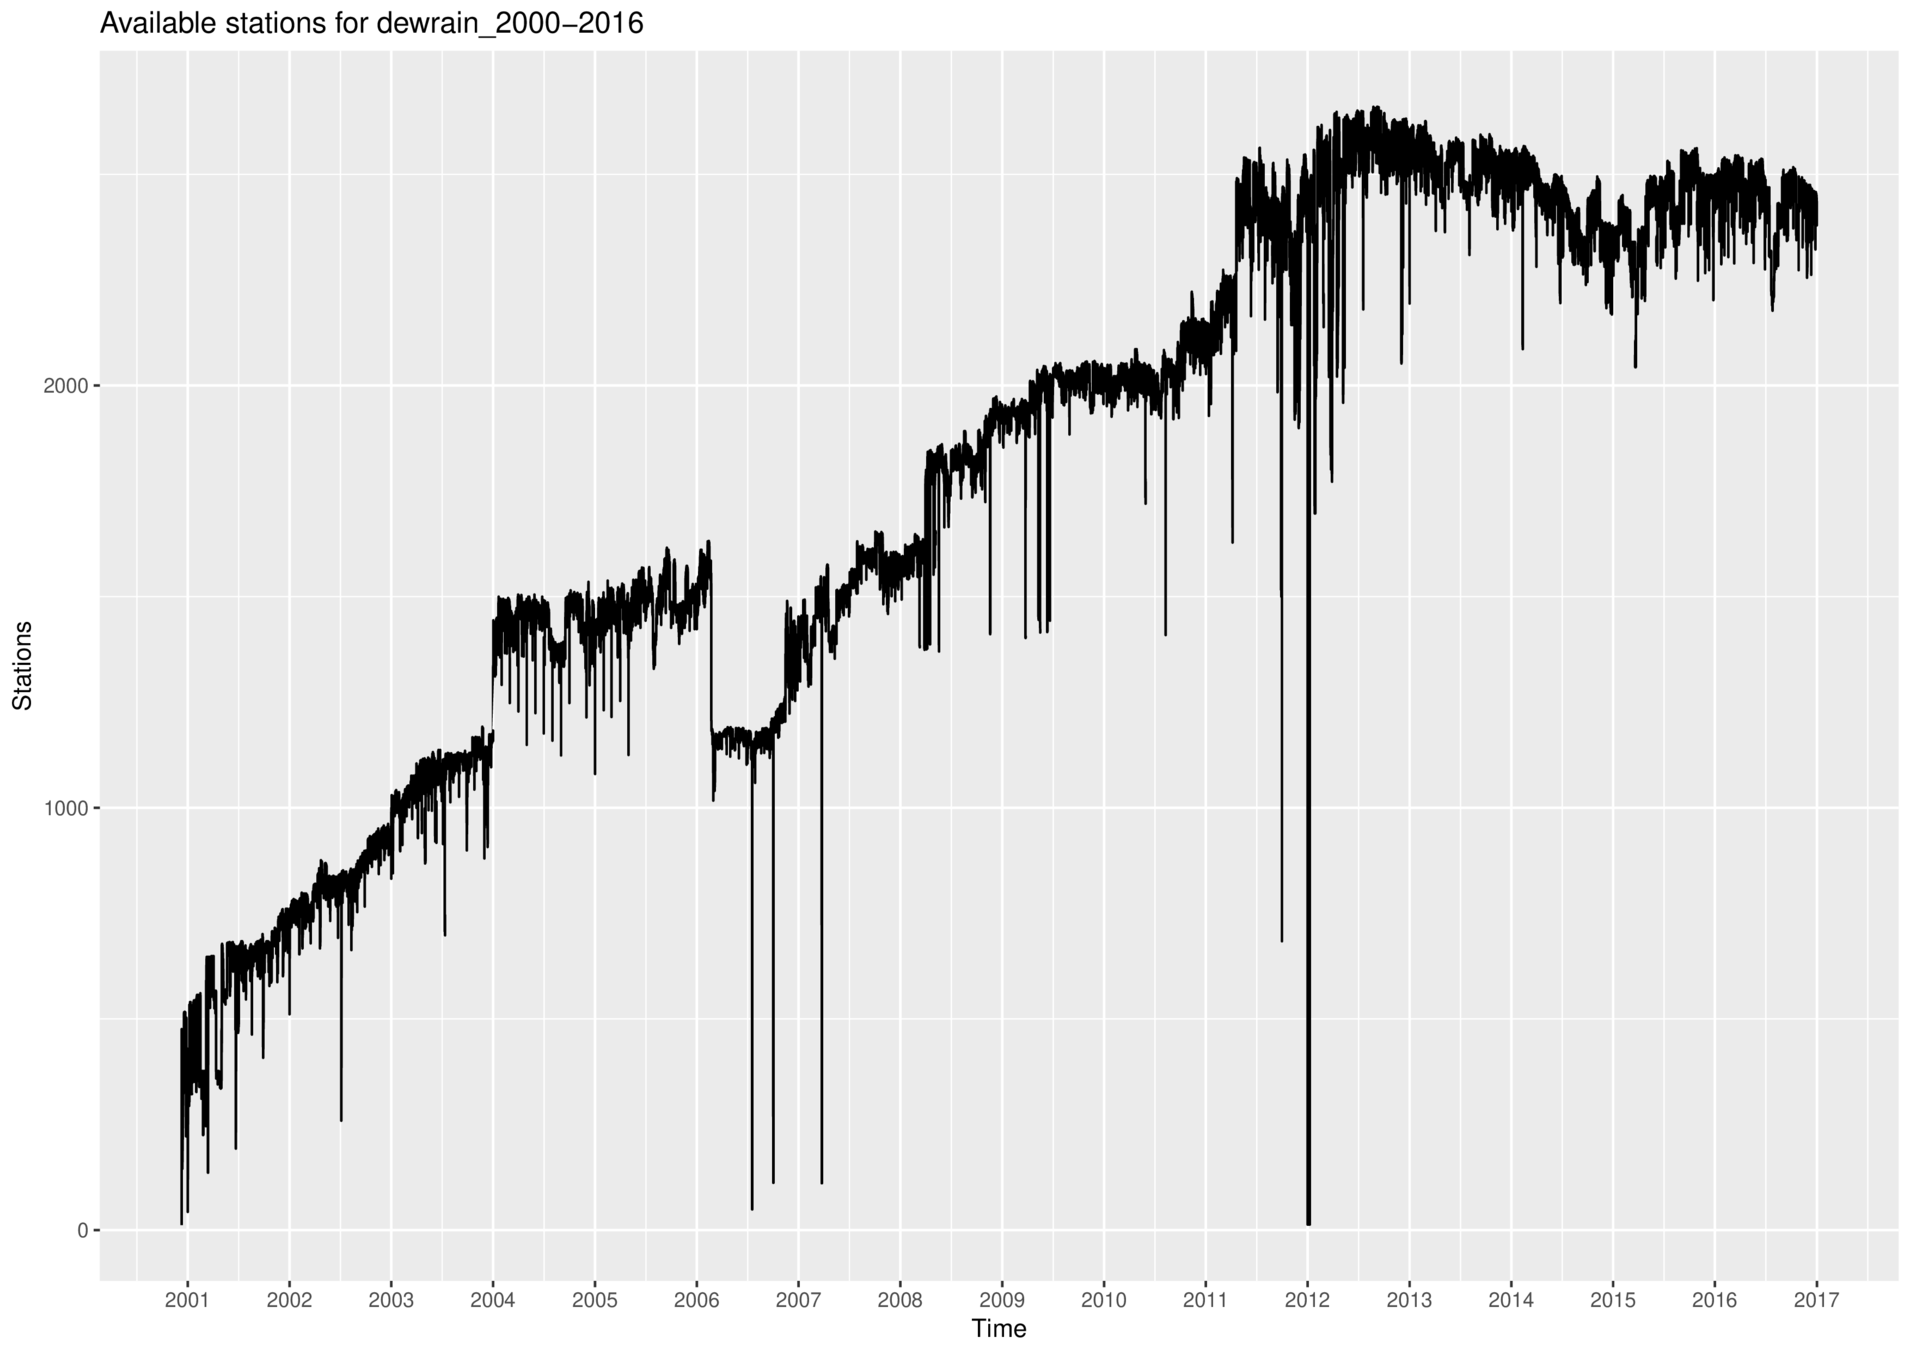
Strong points:
- High station density (~1 station/100km²)
- High temporal resolution (1 hour)
- Only high resolution station-based dataset covering all Italy
TIME
NUMBER OF STATIONS
FIRST-STAGE FILTERING
FLAGGING
FLAG CHECKING
MANUAL DATA CLEANING
CLEANED DATASET!
2.3 - The GRIPHO dataset
Cleaning procedure
2.4 - The GRIPHO dataset
Data cleaning (R95ptot = %pr above 95th pctl)
2.5 - The GRIPHO dataset
Metrics:
- Mean seasonal
- Extremes (R95ptot, R99ptot)
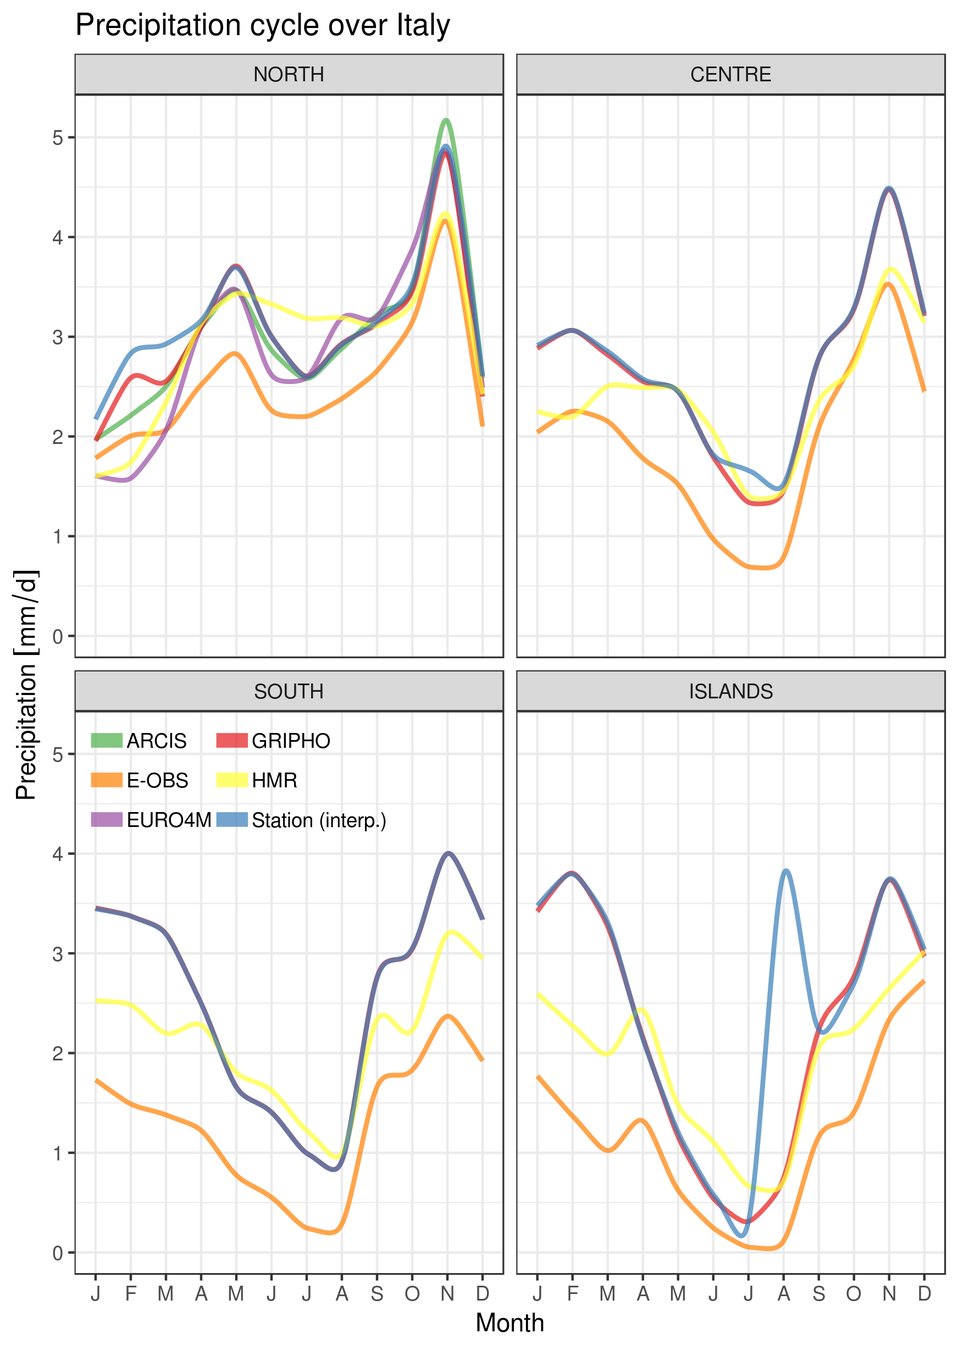
- Annual cycles
- Probability Density Functions
Validation against:
- E-OBS
- ARCIS
- HMR
- EURO4M-APGD
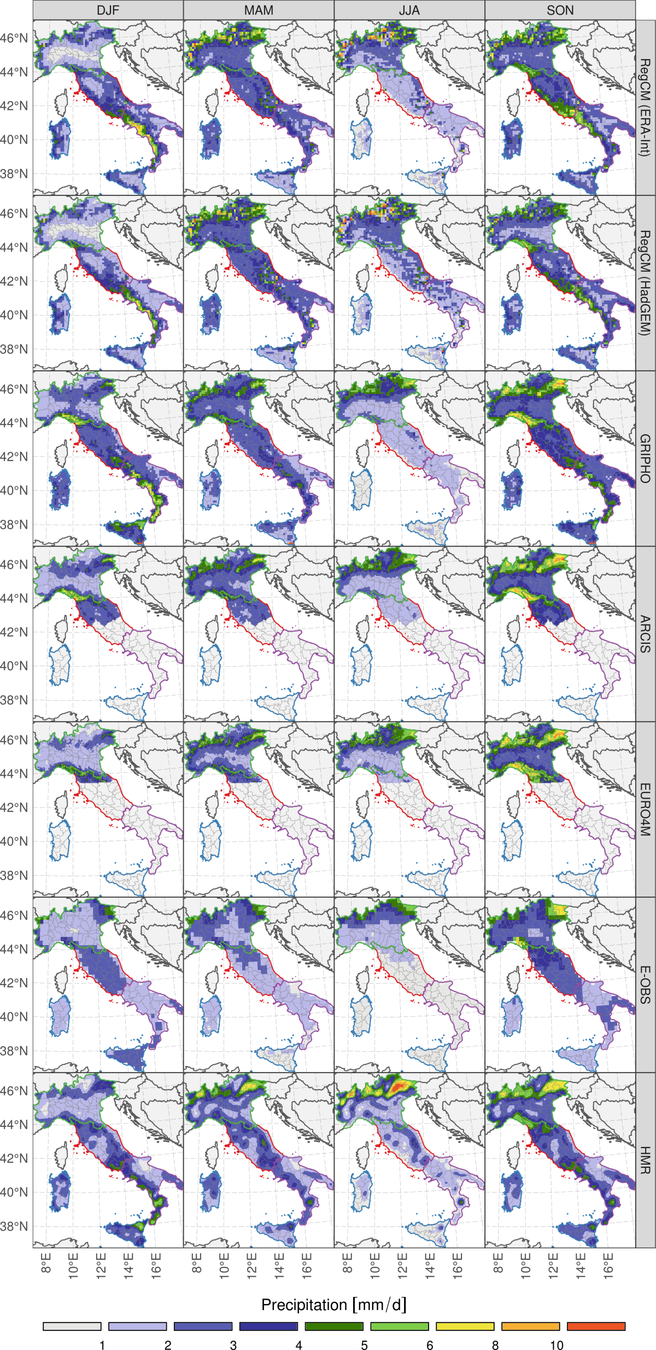
2.6 - The GRIPHO dataset
Validation (mean PR, detail)
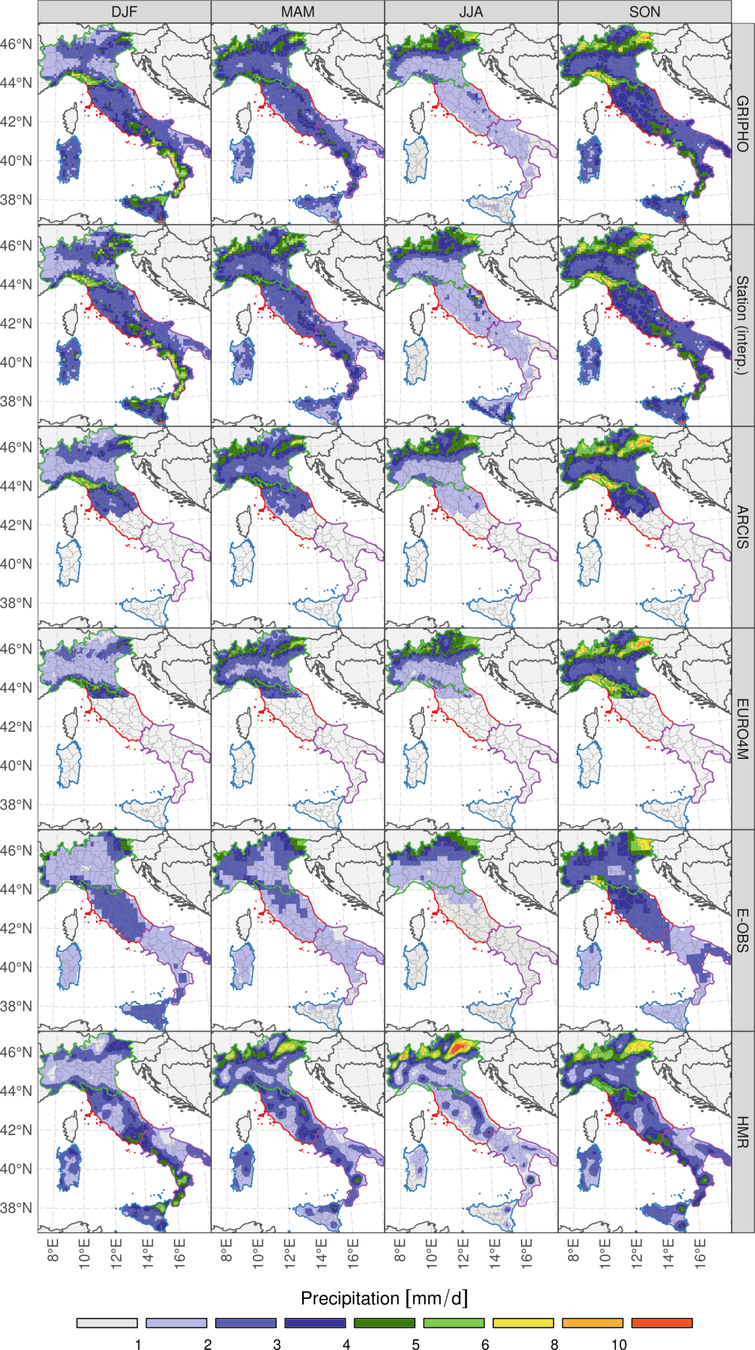
GRIPHO
E-OBS
HMR (rean.)
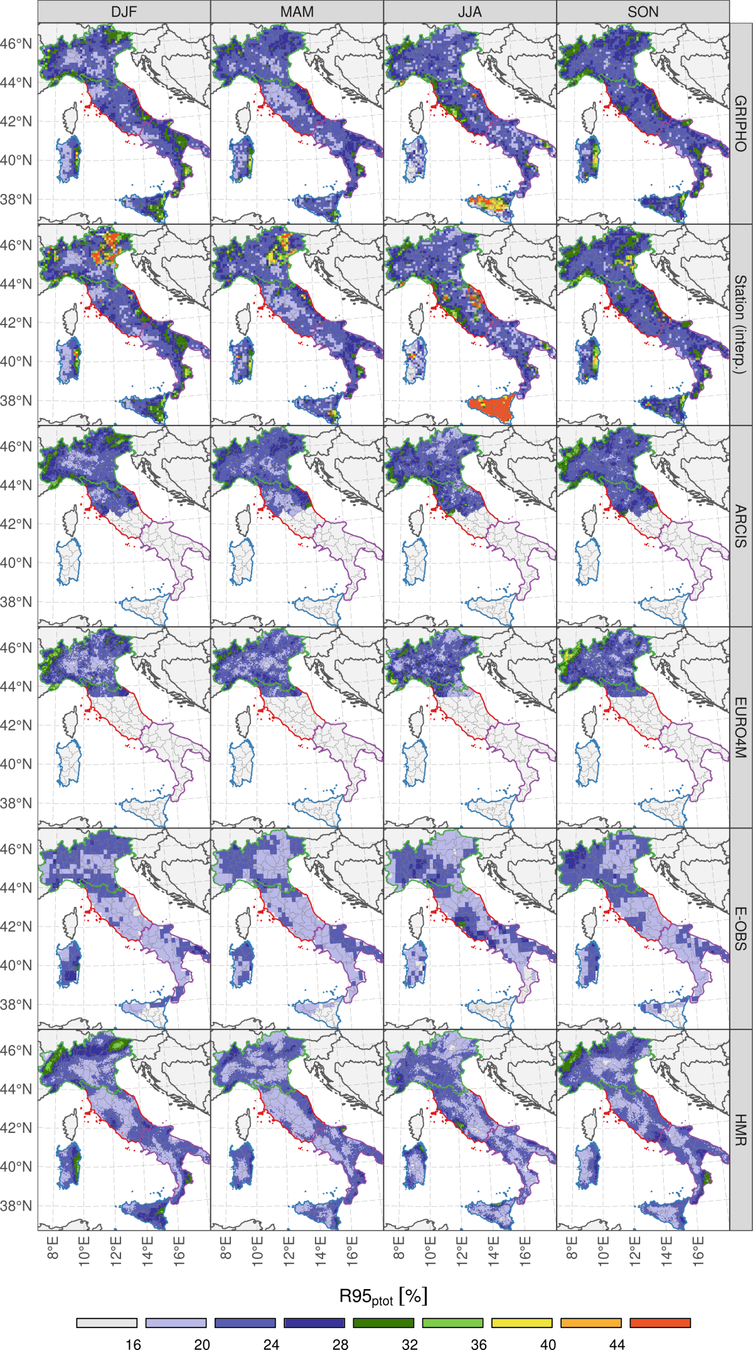
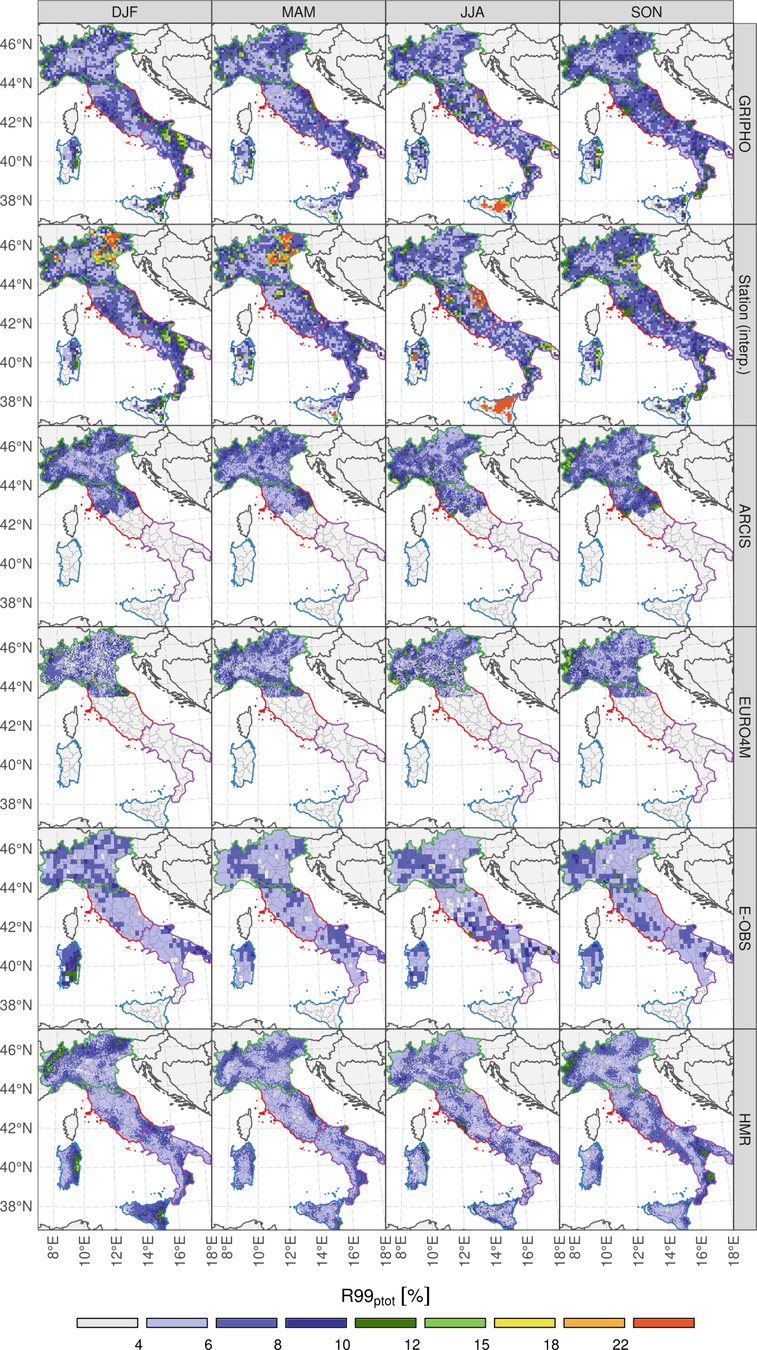
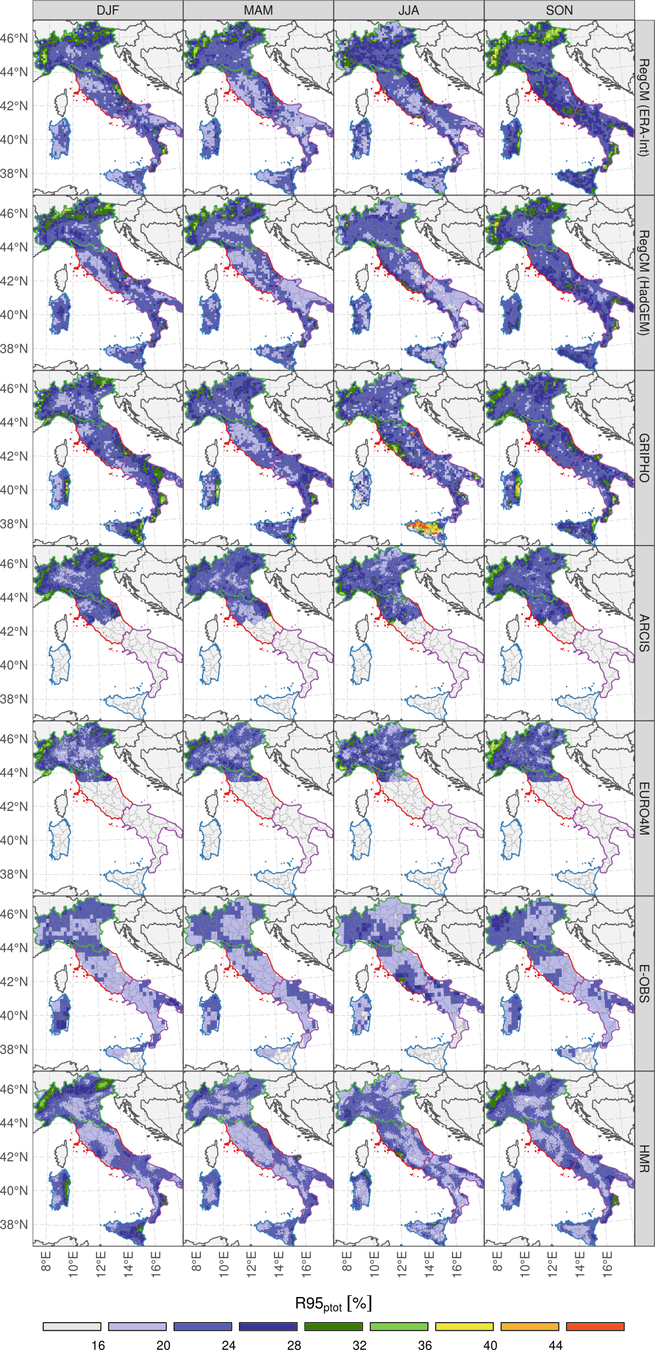
2.7 - The GRIPHO dataset
Validation (R95ptot, detail)
GRIPHO
E-OBS
HMR (rean.)
2.8 - The GRIPHO dataset
Conclusions
- Performance in the North similar to other high resolution datasets (EURO4M-APGD, ARCIS)
- Much finer details compared to HMR and E-OBS, especially for extremes
- Only station-based dataset over Italy providing hourly precipitation
Fantini A., Coppola E., Verdecchia M. and Giuliani G.:
‘GRIPHO: a gridded high-resolution hourly precipitation dataset over Italy’, in preparation
Issues:
- Further data cleaning must be performed (esp. in Sicily)
- Some areas are left missing in some time periods, could be filled in?
Automated filtering
- Removal of extreme values > 200 mm/h
- Removal of isolated > 100 mm/h reports
- Removal of complete months with > 1800 mm (2.5 mm/h)
- Removal of continuous identical values
Rauthe et al. 2013; A Central European precipitation climatology–Part I: Generation and validation of a high-resolution gridded daily data set (HYRAS)
Isotta et al. 2013; The climate of daily precipitation in the Alps: development and analysis of a high‐resolution grid dataset from pan‐Alpine rain‐gauge data
Perry et al., 2009; The generation of daily gridded datasets of temperature and rainfall for the UK
Hiebl et al., 2017; Daily precipitation grids for Austria since 1961—development and evaluation of a spatial dataset for hydroclimatic monitoring and modelling
2.x - The GRIPHO dataset
Flagging
- Total % of valid values
- Total % of valid values ≠ 0
- % of events > mean + {10,15,25} SD
- % of events > median + {10,15,25} IQR
- % of events with 50 < pr < 100mm/h
- % of events with pr > 100mm/h
- % of the top {1,5,10} most common values
| Before | After | Diff | |
|---|---|---|---|
| Total valid values | 250M | 243M | -2.6% |
| Total flags | 324468 | 58008 | -82.1% |
| pr > Mean + 20SD | 3240 | 2538 | -21.7% |
| pr > Median + 20IQR | 49753 | 22519 | -54.7% |
| pr > 100 mm/h | 221822 | 711 | -99.7% |
| Other softer flags | 49646 | 32240 | -35.1% |
2.x - The GRIPHO dataset
Results on warning flags
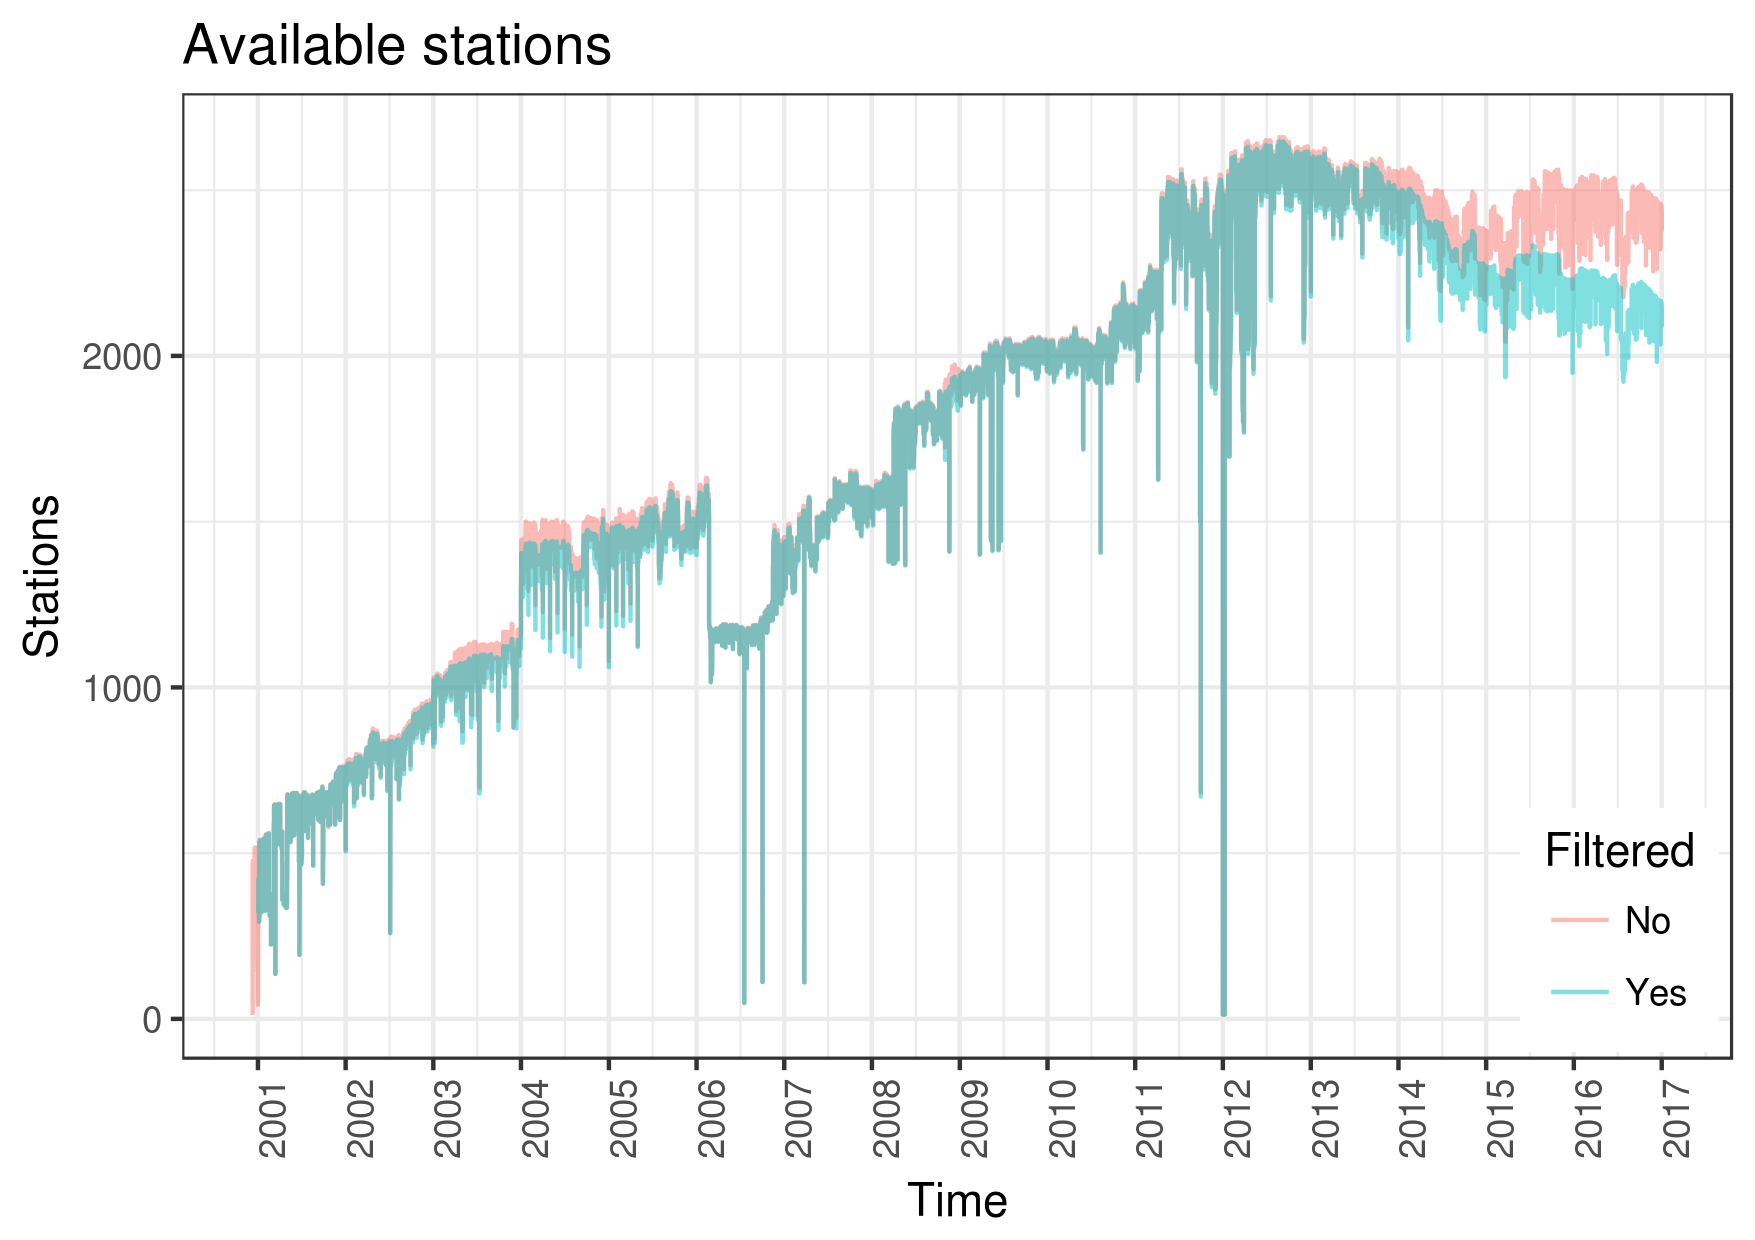
FILTERED
ORIGINAL
2.x - The GRIPHO dataset
Data cleaning (mean PR)
MANUALLY CLEANED
ONLY AUTO CLEANED
Manual filtering on a monthly basis
2.x - The GRIPHO dataset
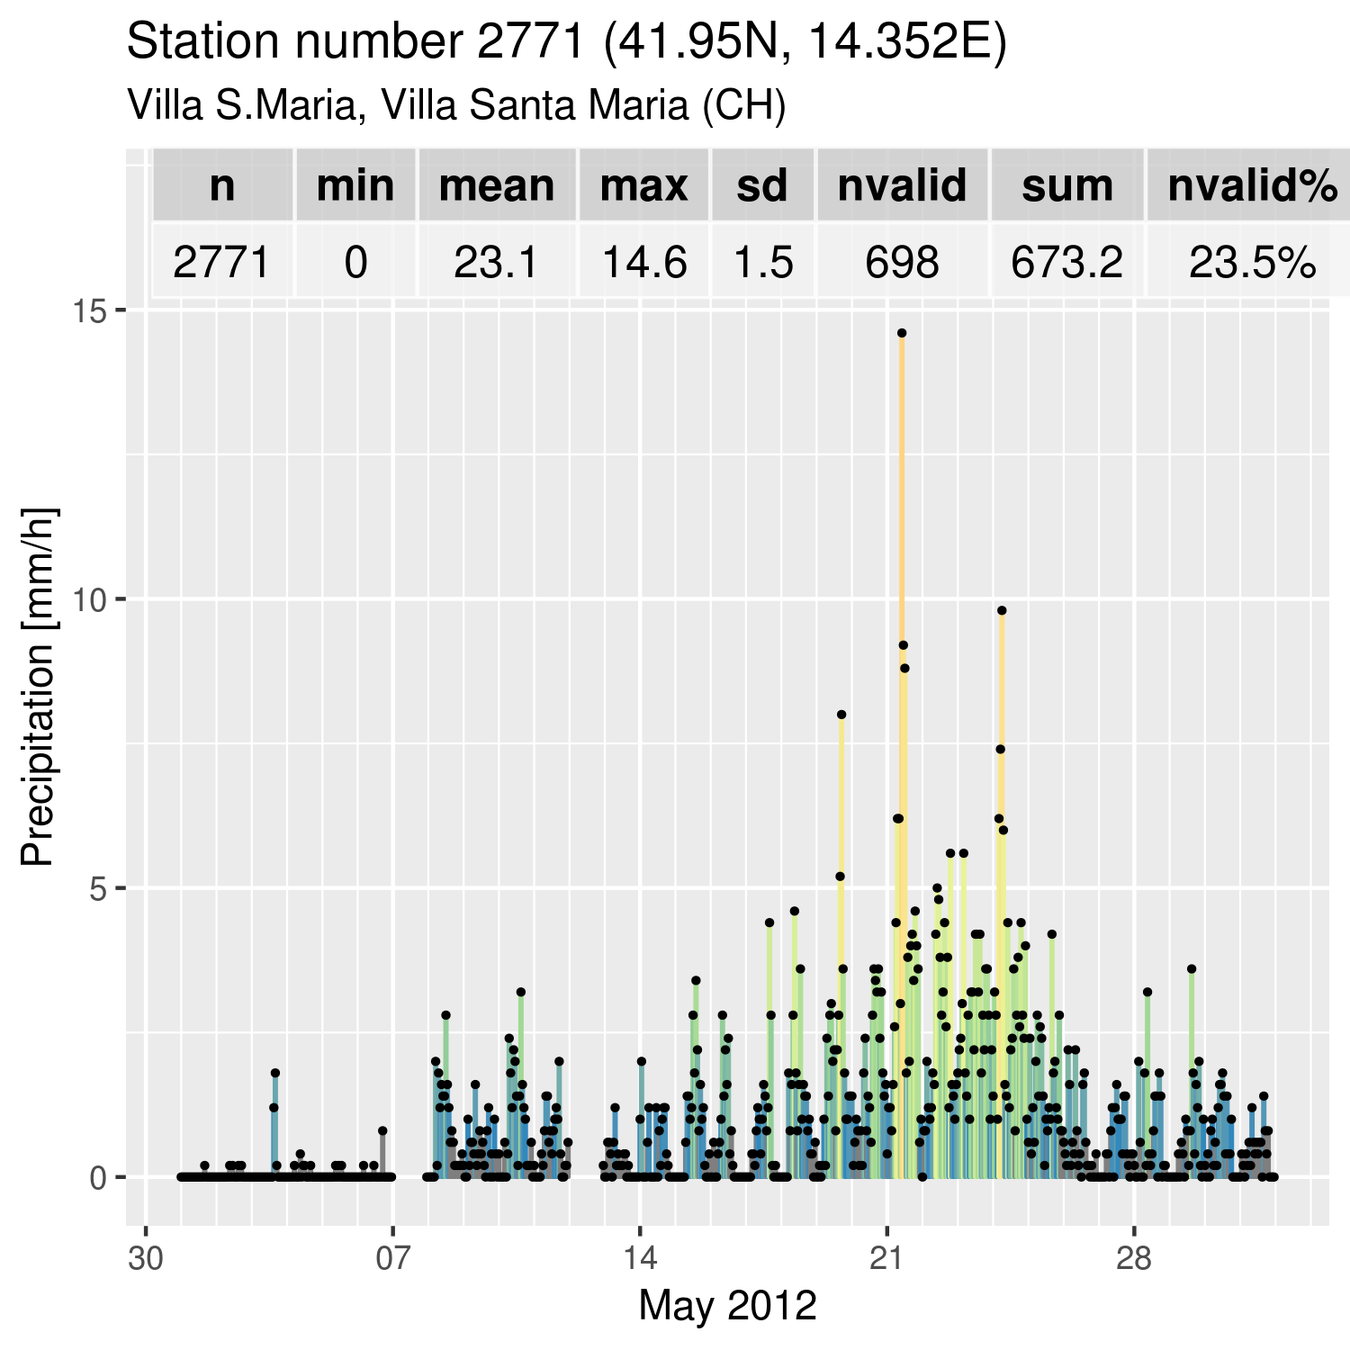
Some examples...
Outliers
2.x - The GRIPHO dataset
2.x - The GRIPHO dataset
Validation
2.x - The GRIPHO dataset
Validation
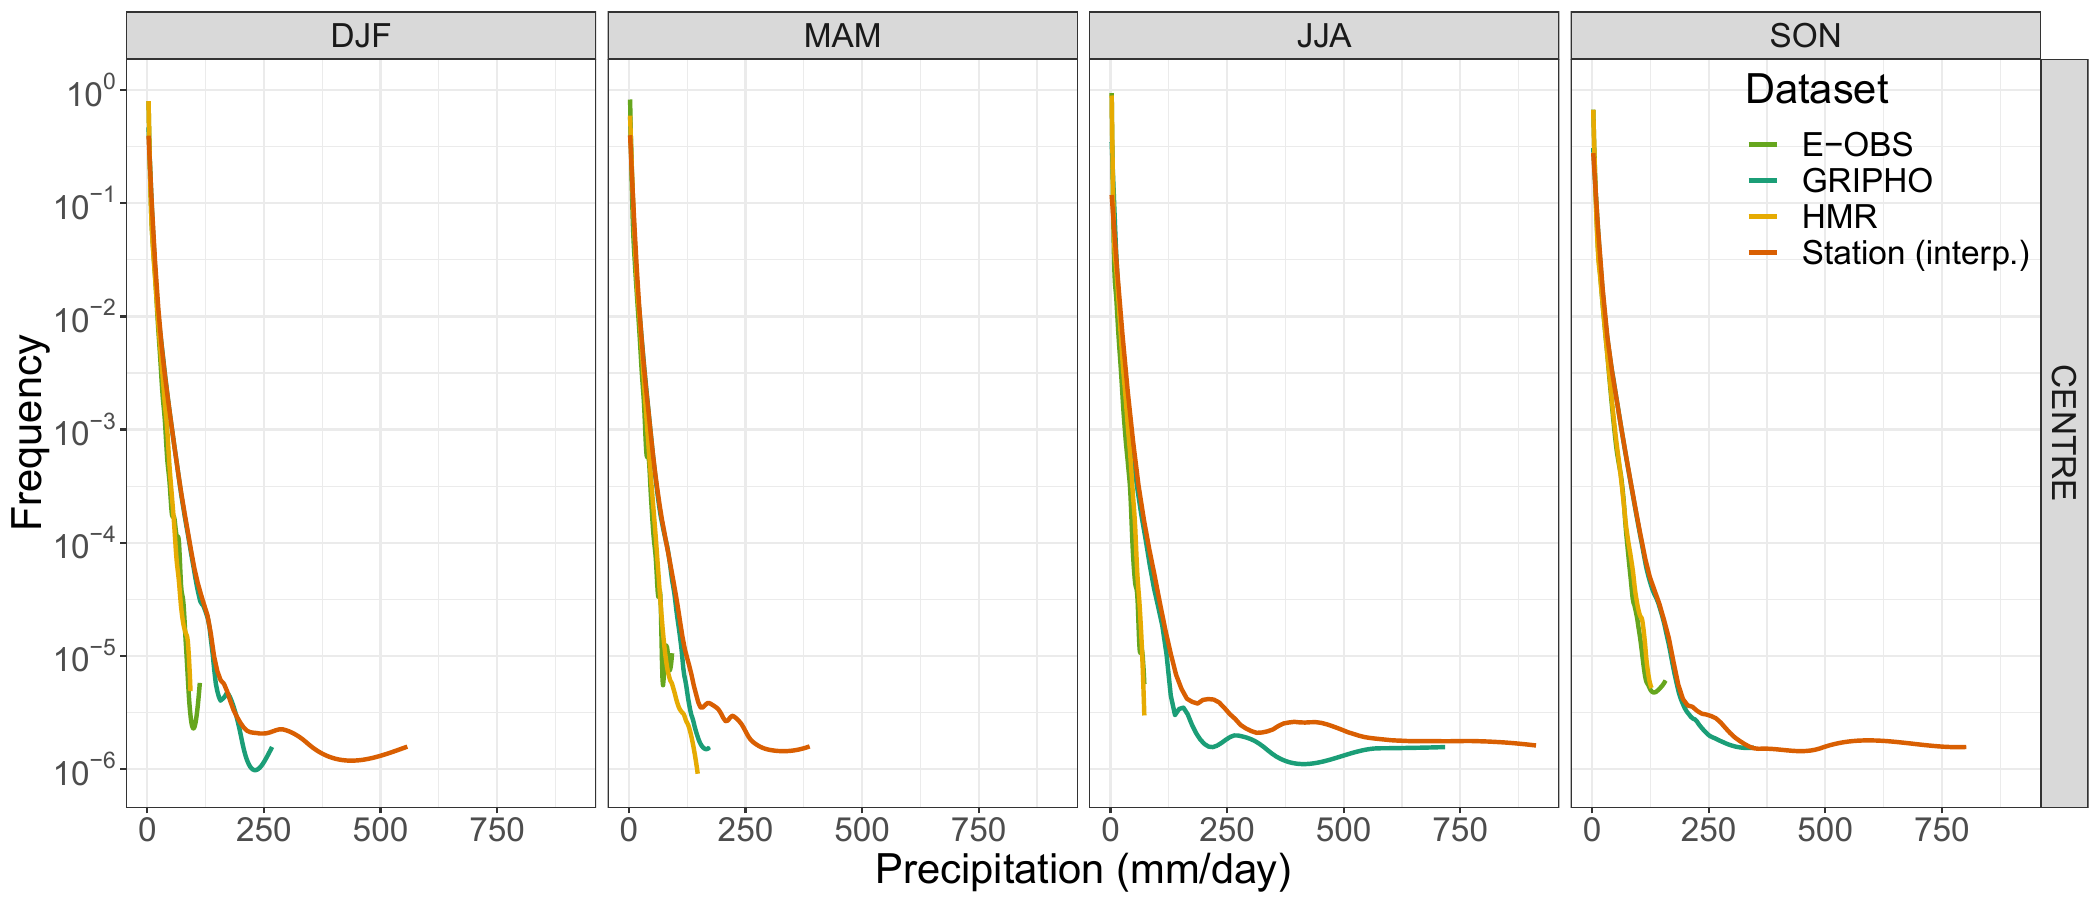
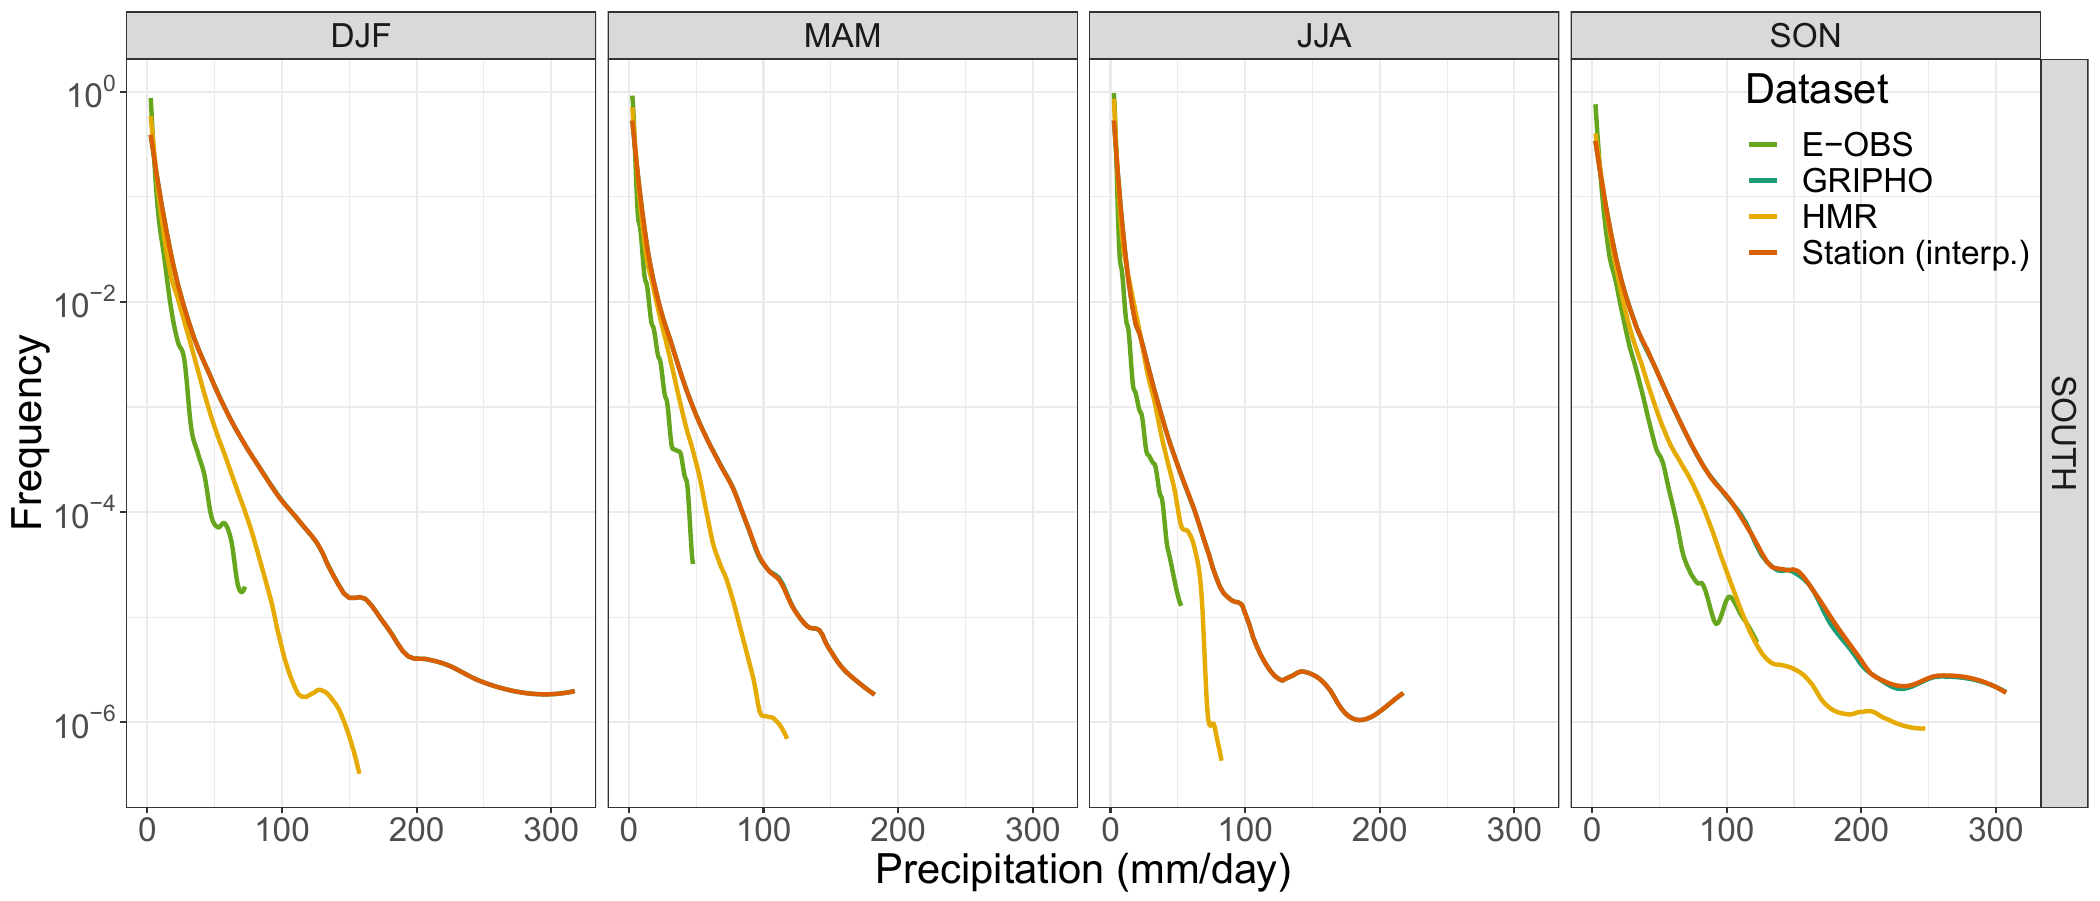
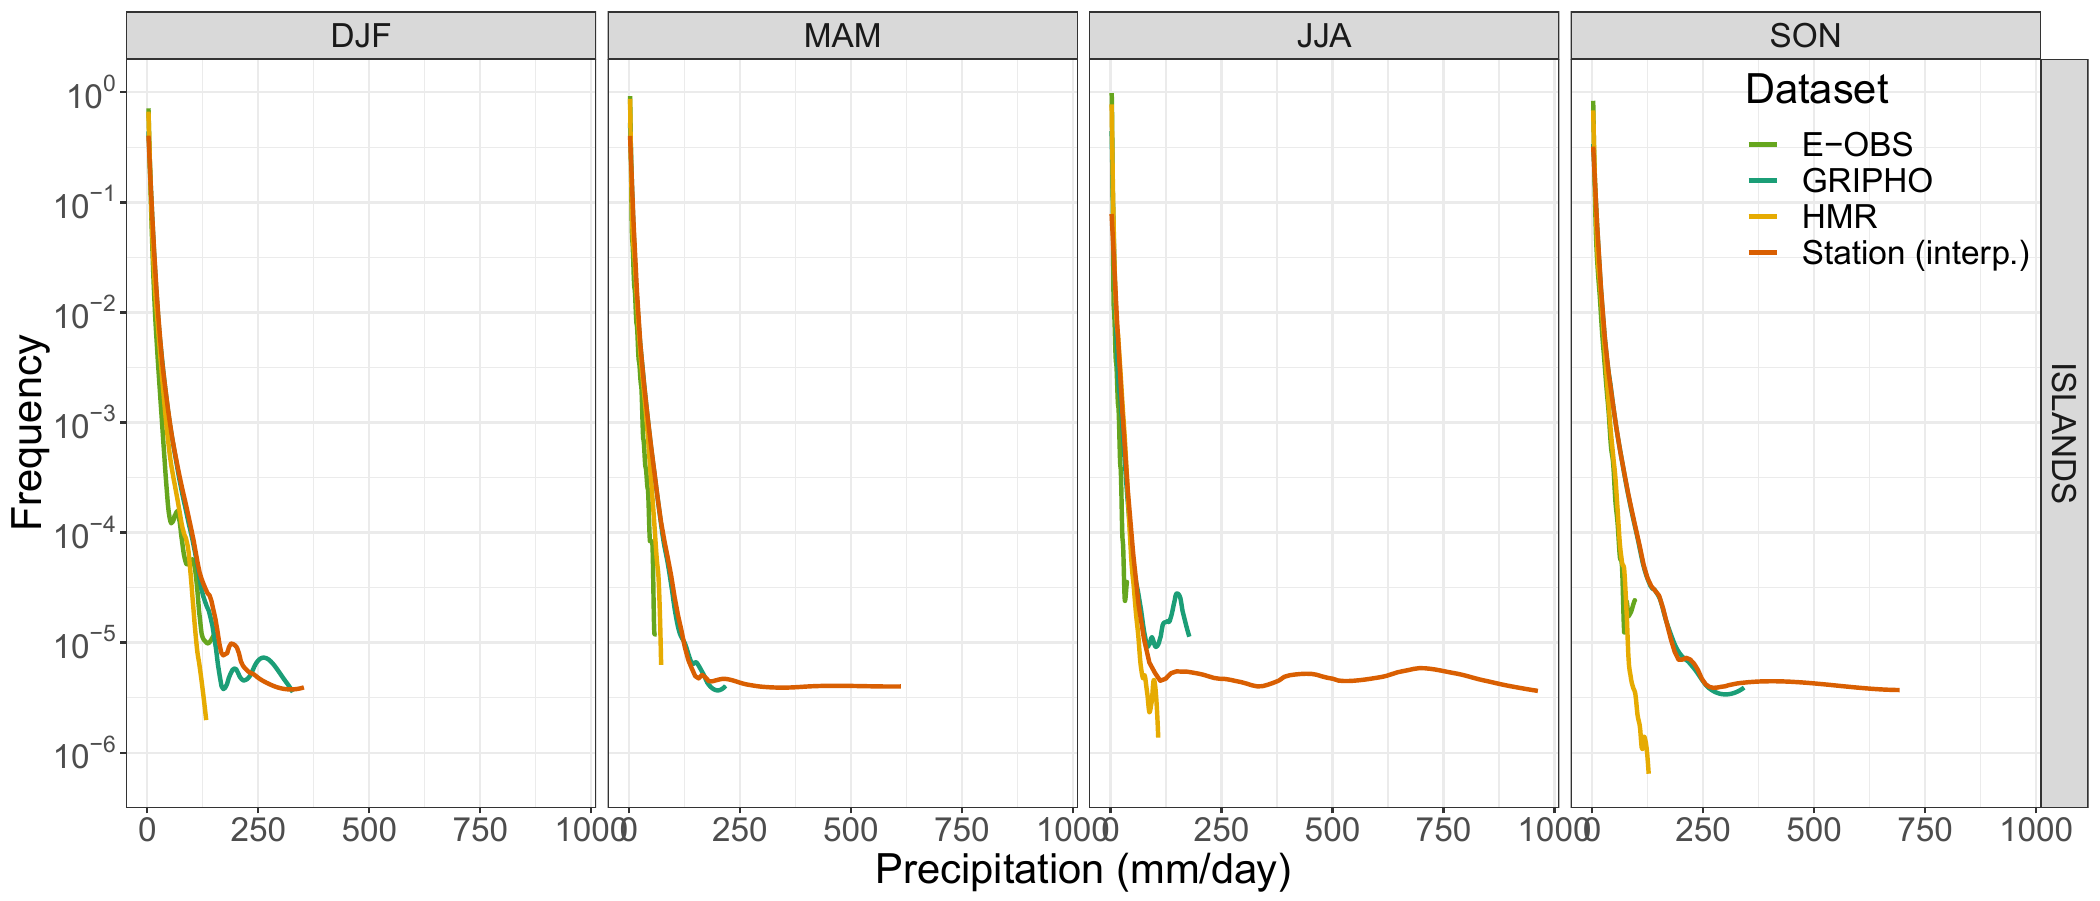
2.x - The GRIPHO dataset
Validation (PDF, detail)

2.x - The GRIPHO dataset
2.x - The GRIPHO dataset
3.0 - Regional Climate Model
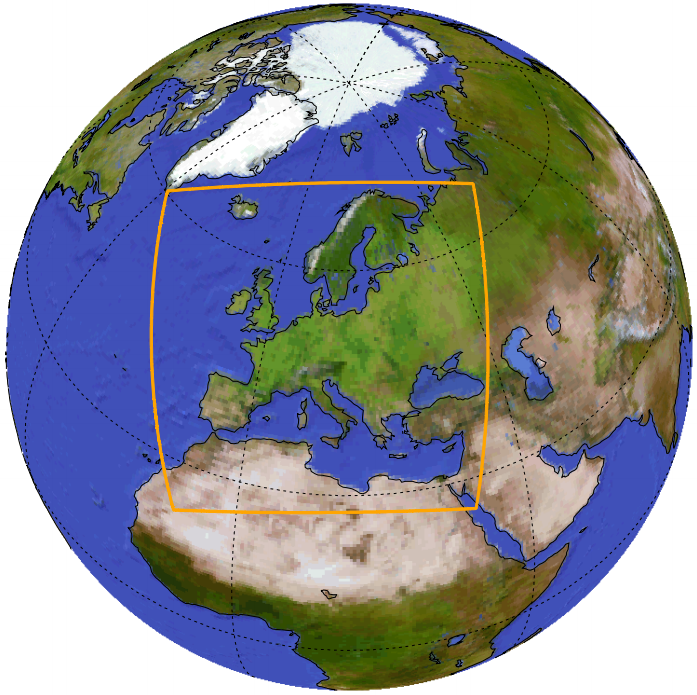
Two RegCM 4.6.1 12km EURO-CORDEX simulations run on ICTP's Argo and CINECA's Marconi clusters:
- ERA-Interim driven 1979-2016 historical simulation
- HadGEM driven 1971-2099 scenario simulation (RCP8.5)
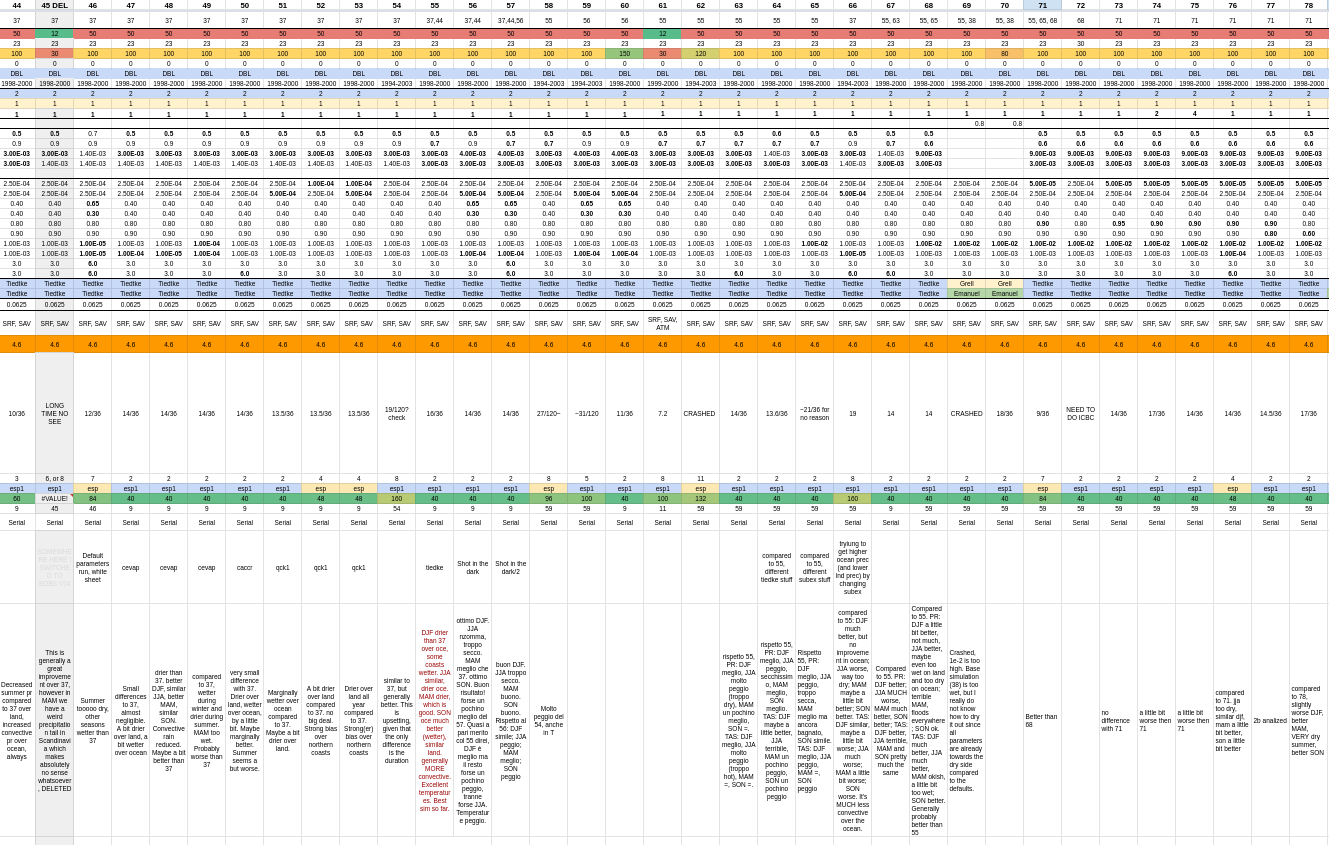
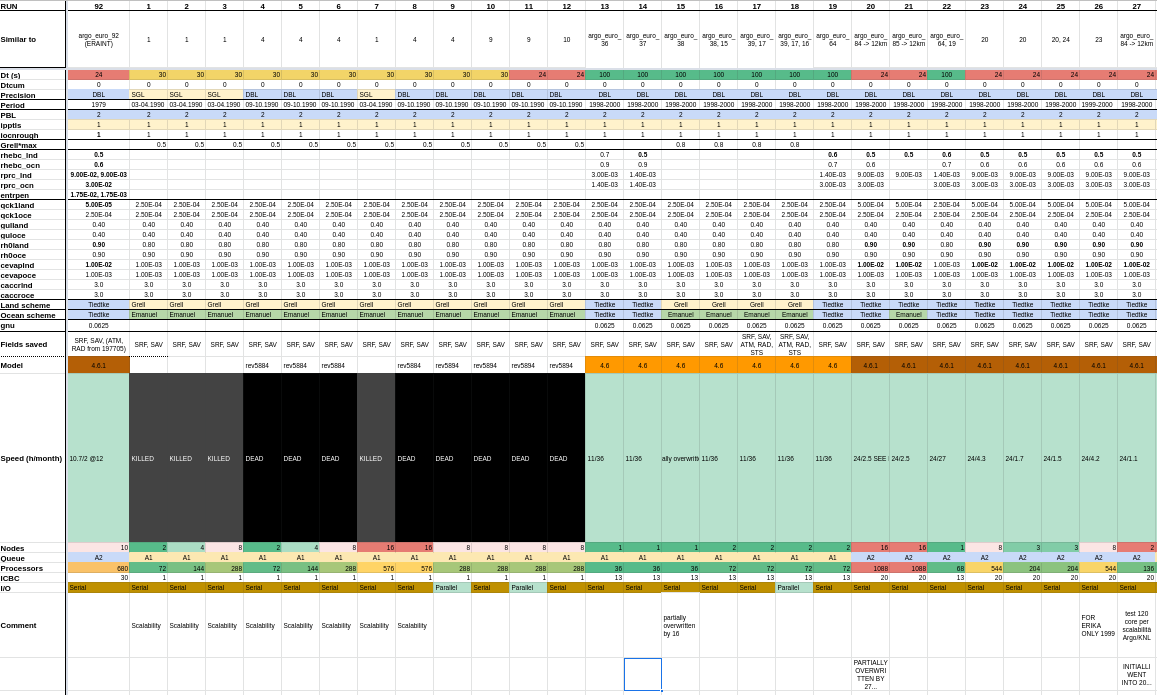
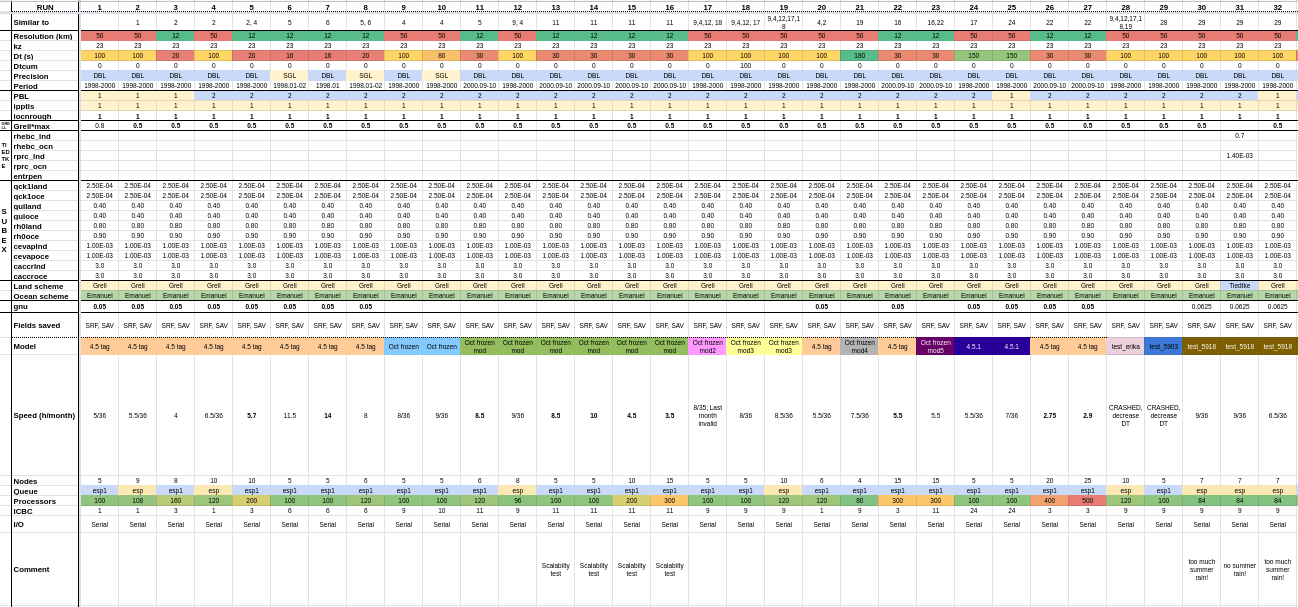
- 135 3-year tuning experiments
- 6000 runtime hours
- 3 million core-hours
- >100TB disk usage
Thanks to James Ciarlo` for running part of the HadGEM driven simulation!
3.1 - Regional Climate Model
Does the model perform well?
Validation for precipitation + temperature:
- Mean seasonal
- Extremes (R95ptot, R99ptot)
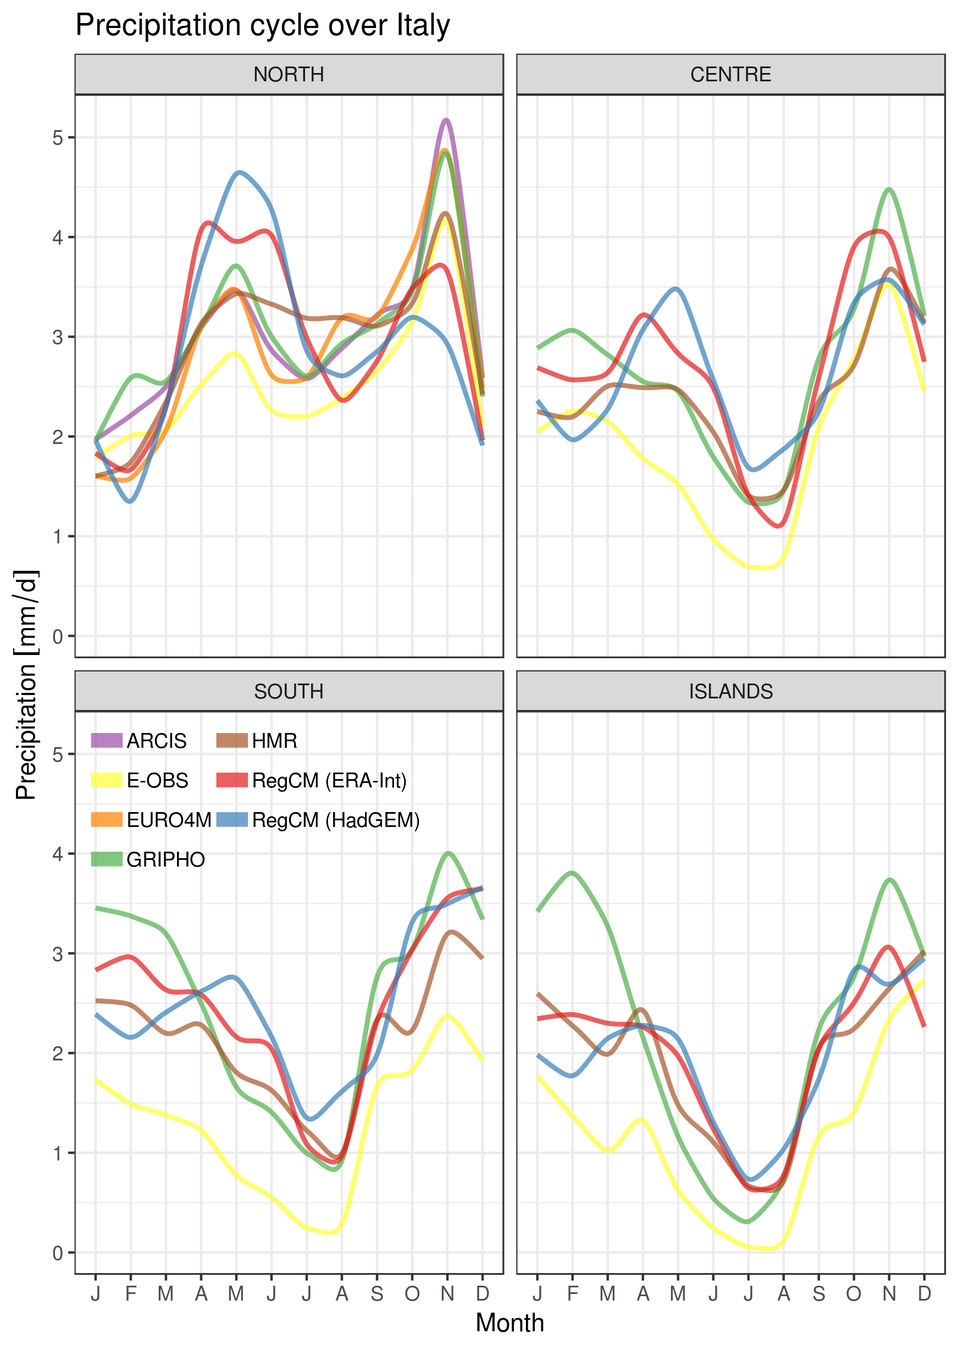
- Annual cycles
- Probability Density Functions
3.2 - Regional Climate Model
Validation (mean PR, detail)
3.3 - Regional Climate Model
Validation (R95ptot, detail)
3.4 - Regional Climate Model

Mean PR change
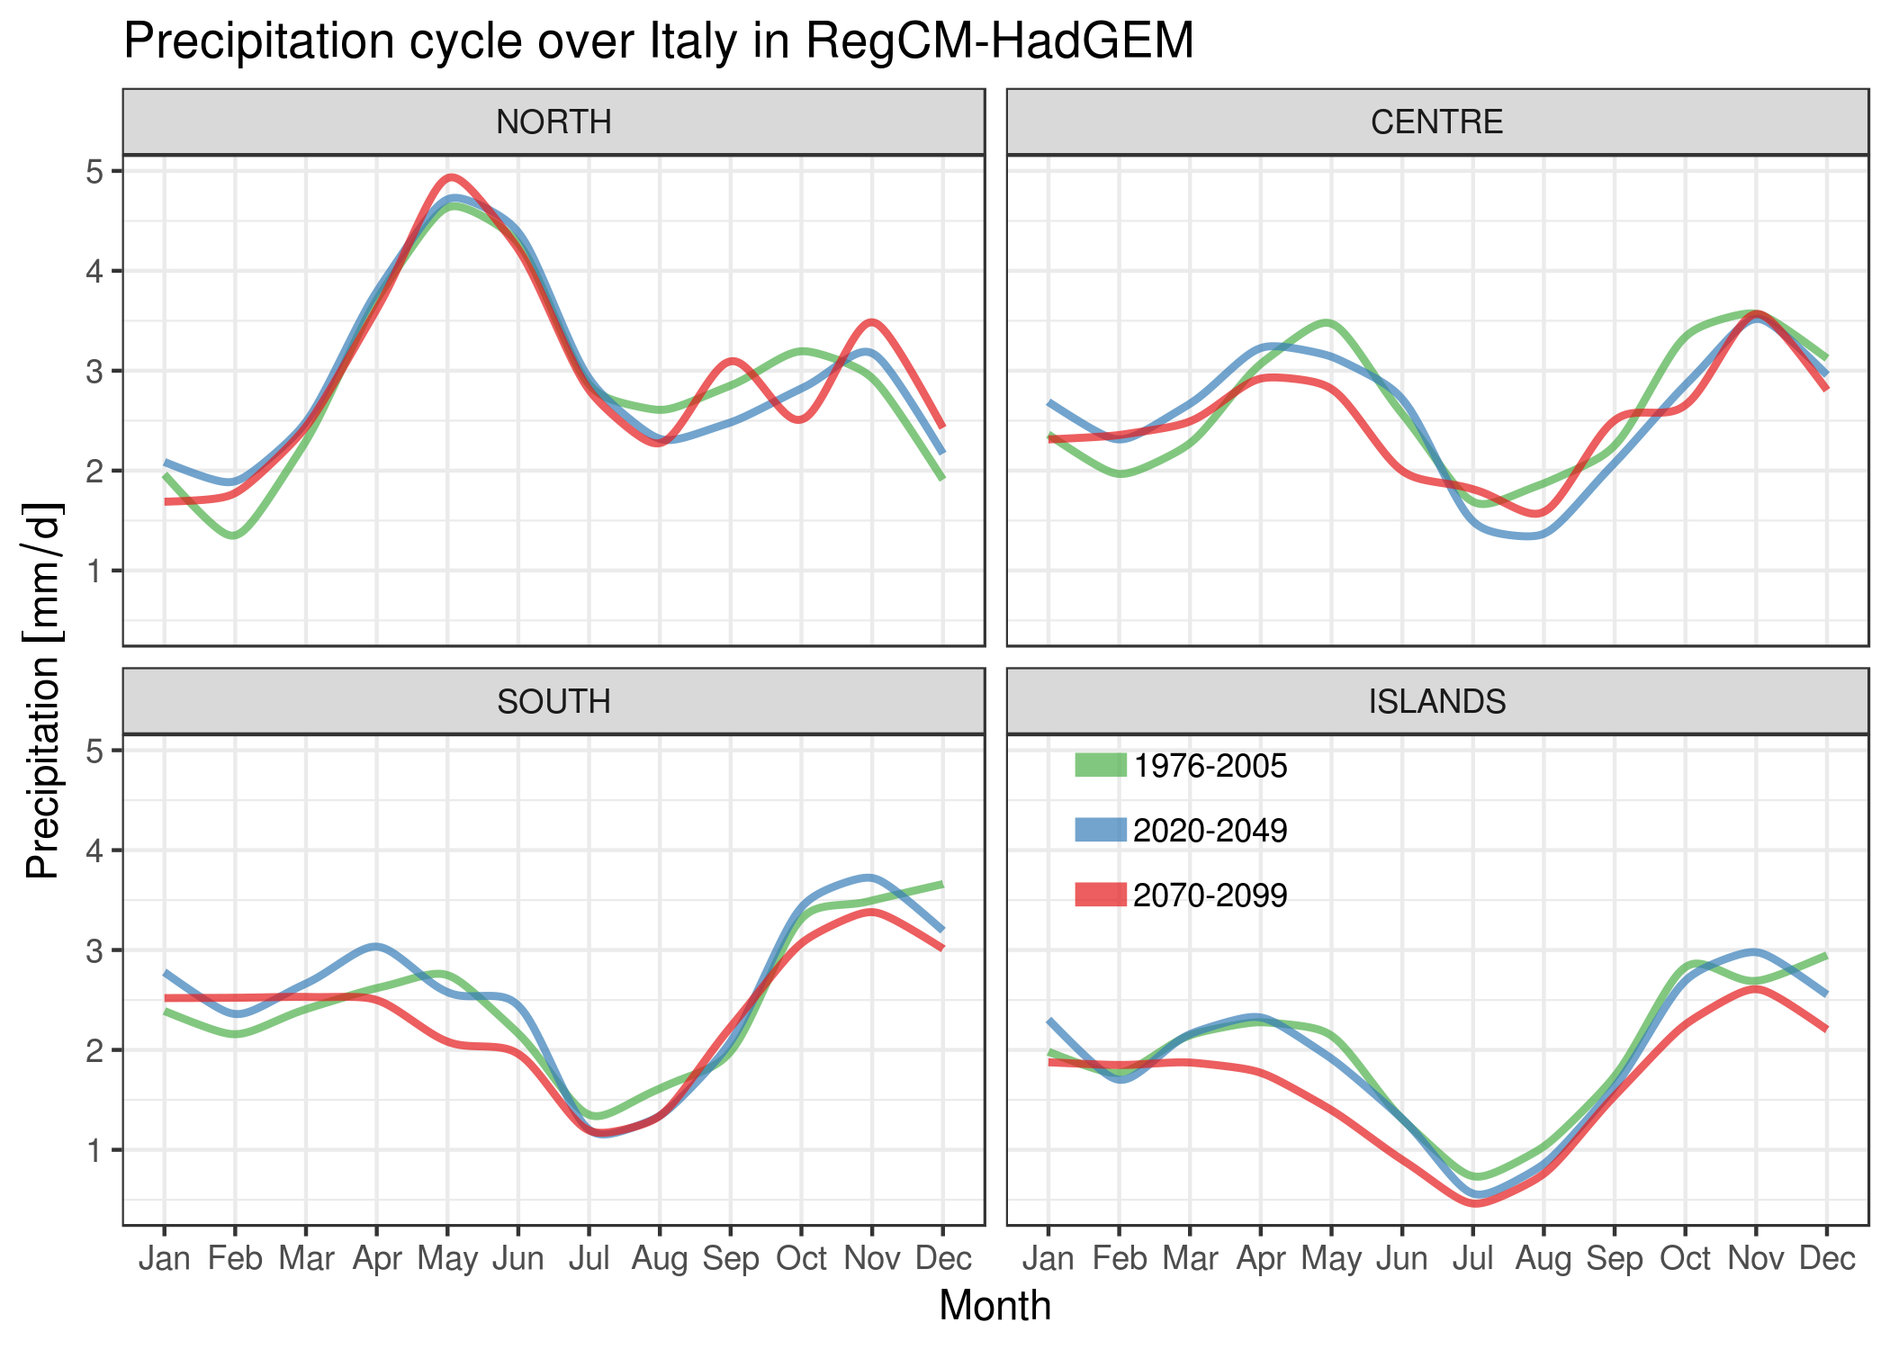
3.5 - Regional Climate Model
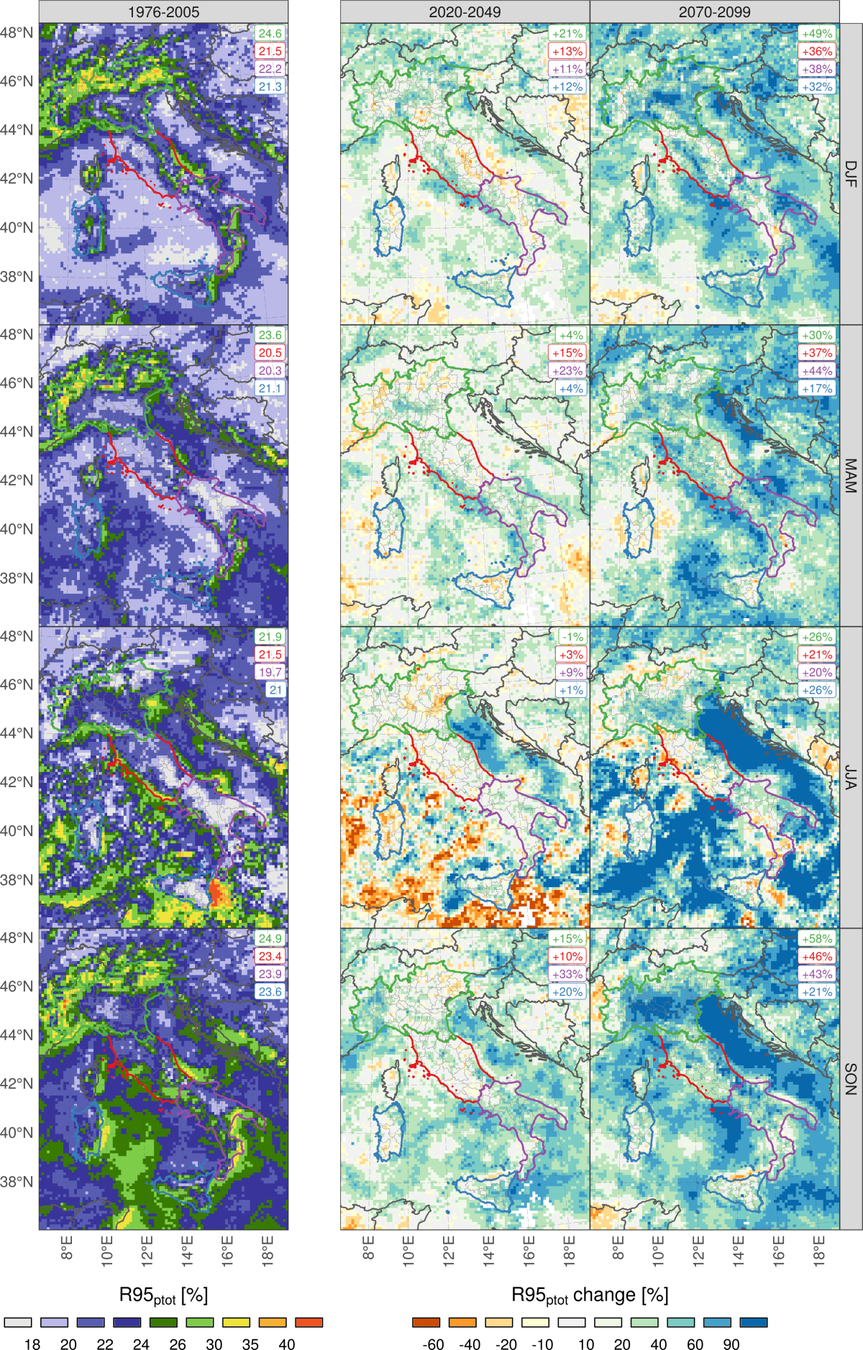
Mean R95ptot change
3.6 - Regional Climate Model
RegCM Conclusions
- Model precipitation and temperature generally in line with observations
- Increased projected average precipitation by the end of the century in winter in the north; decrease in the south and isles in summer dipole
- Precipitation extremes projected to strongly increase
- The most extreme events increase more
3.x - Regional Climate Model
3.x - Regional Climate Model
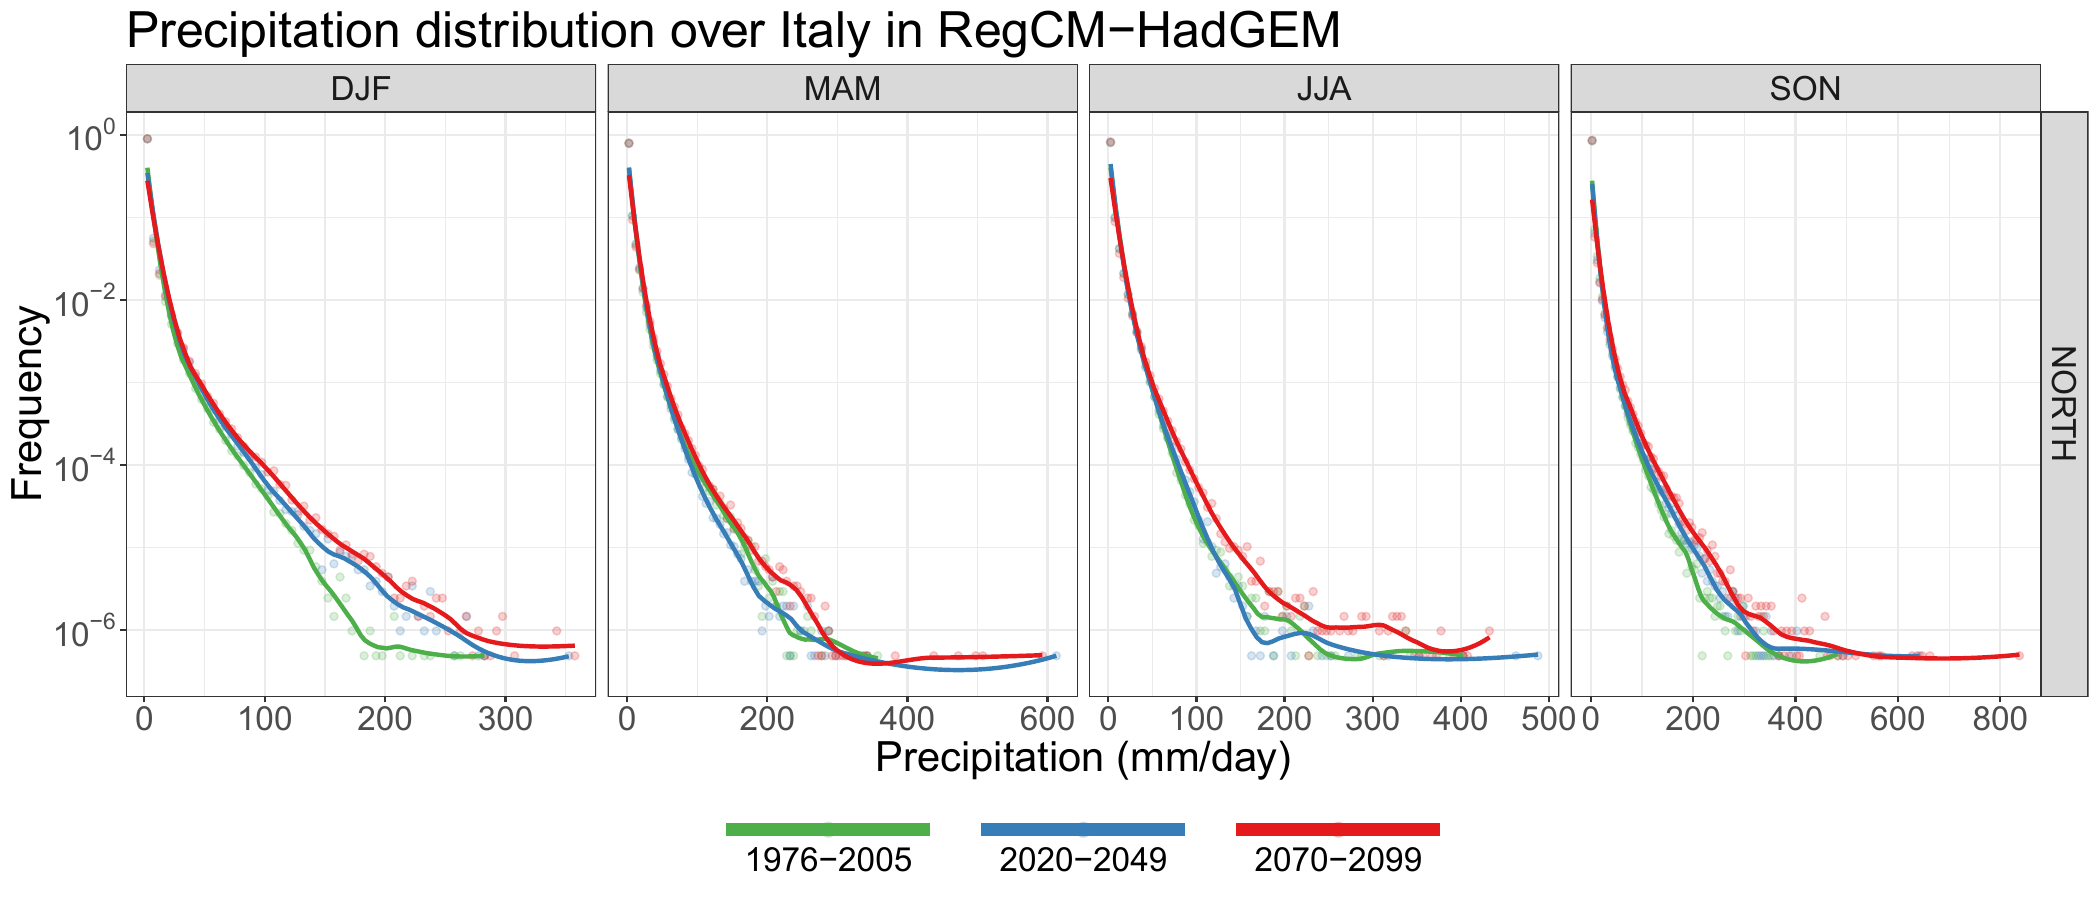
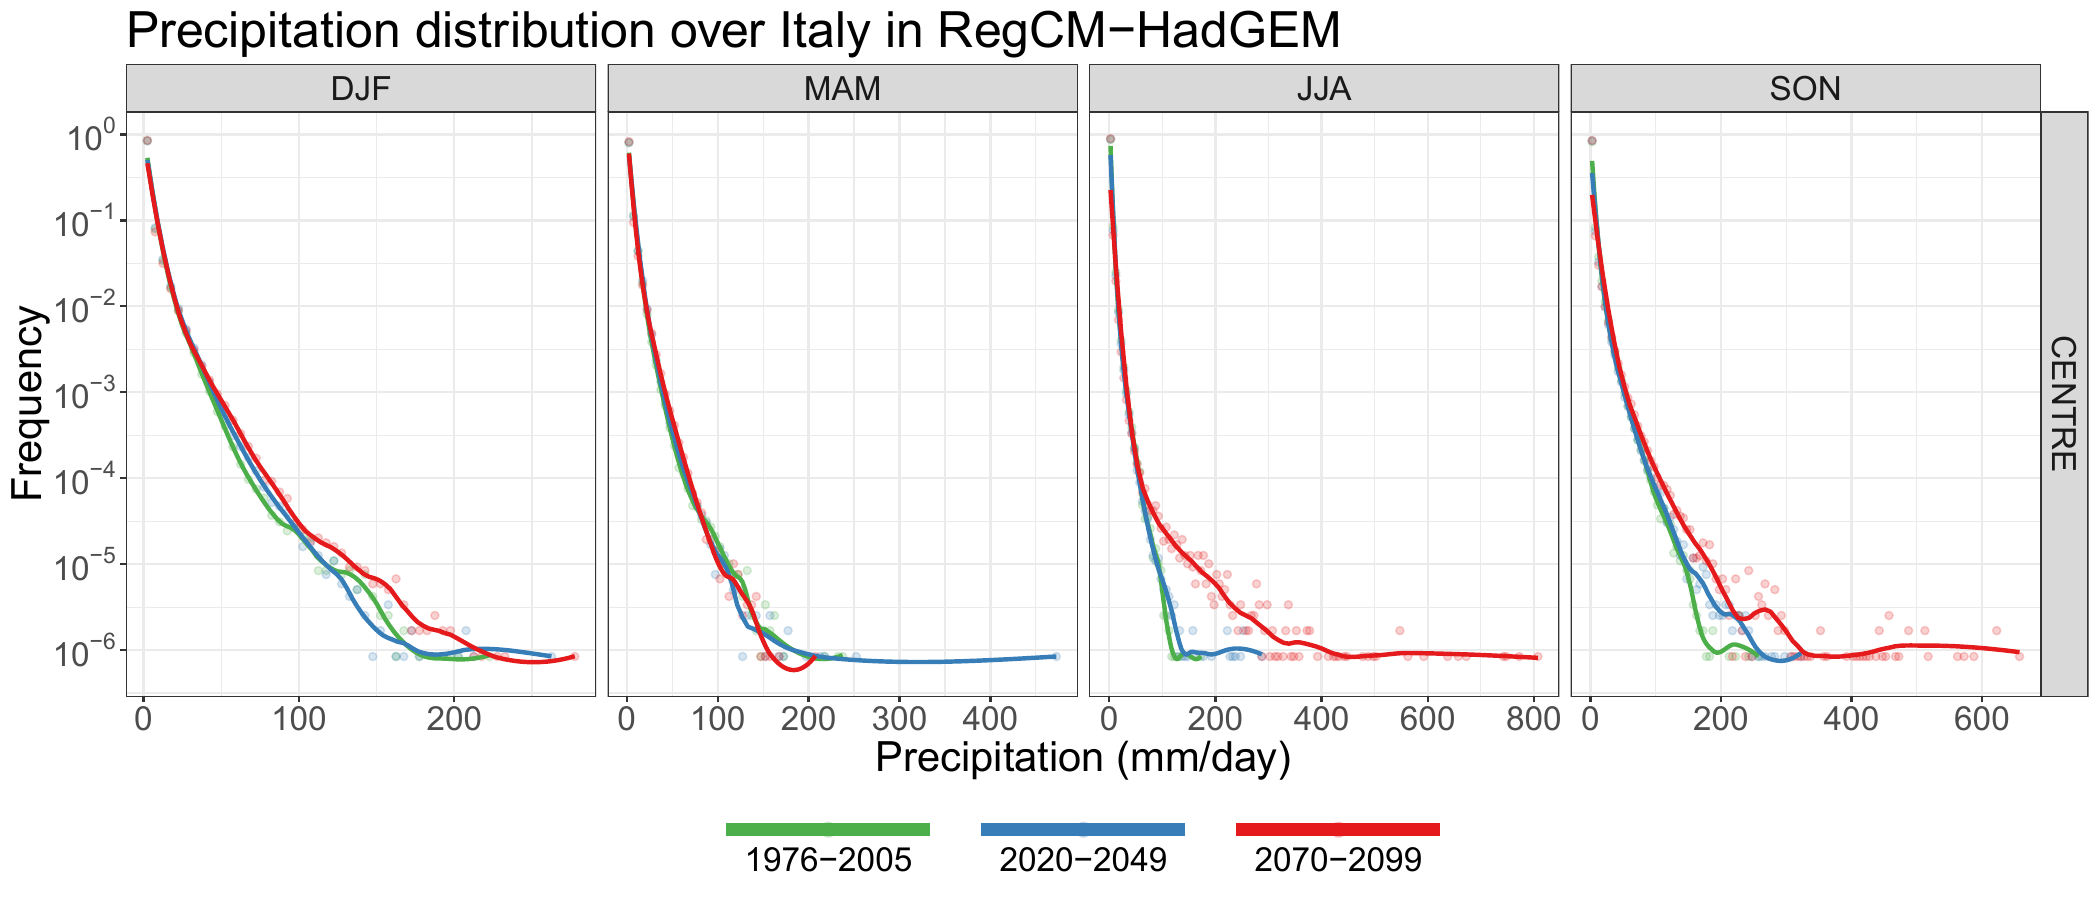
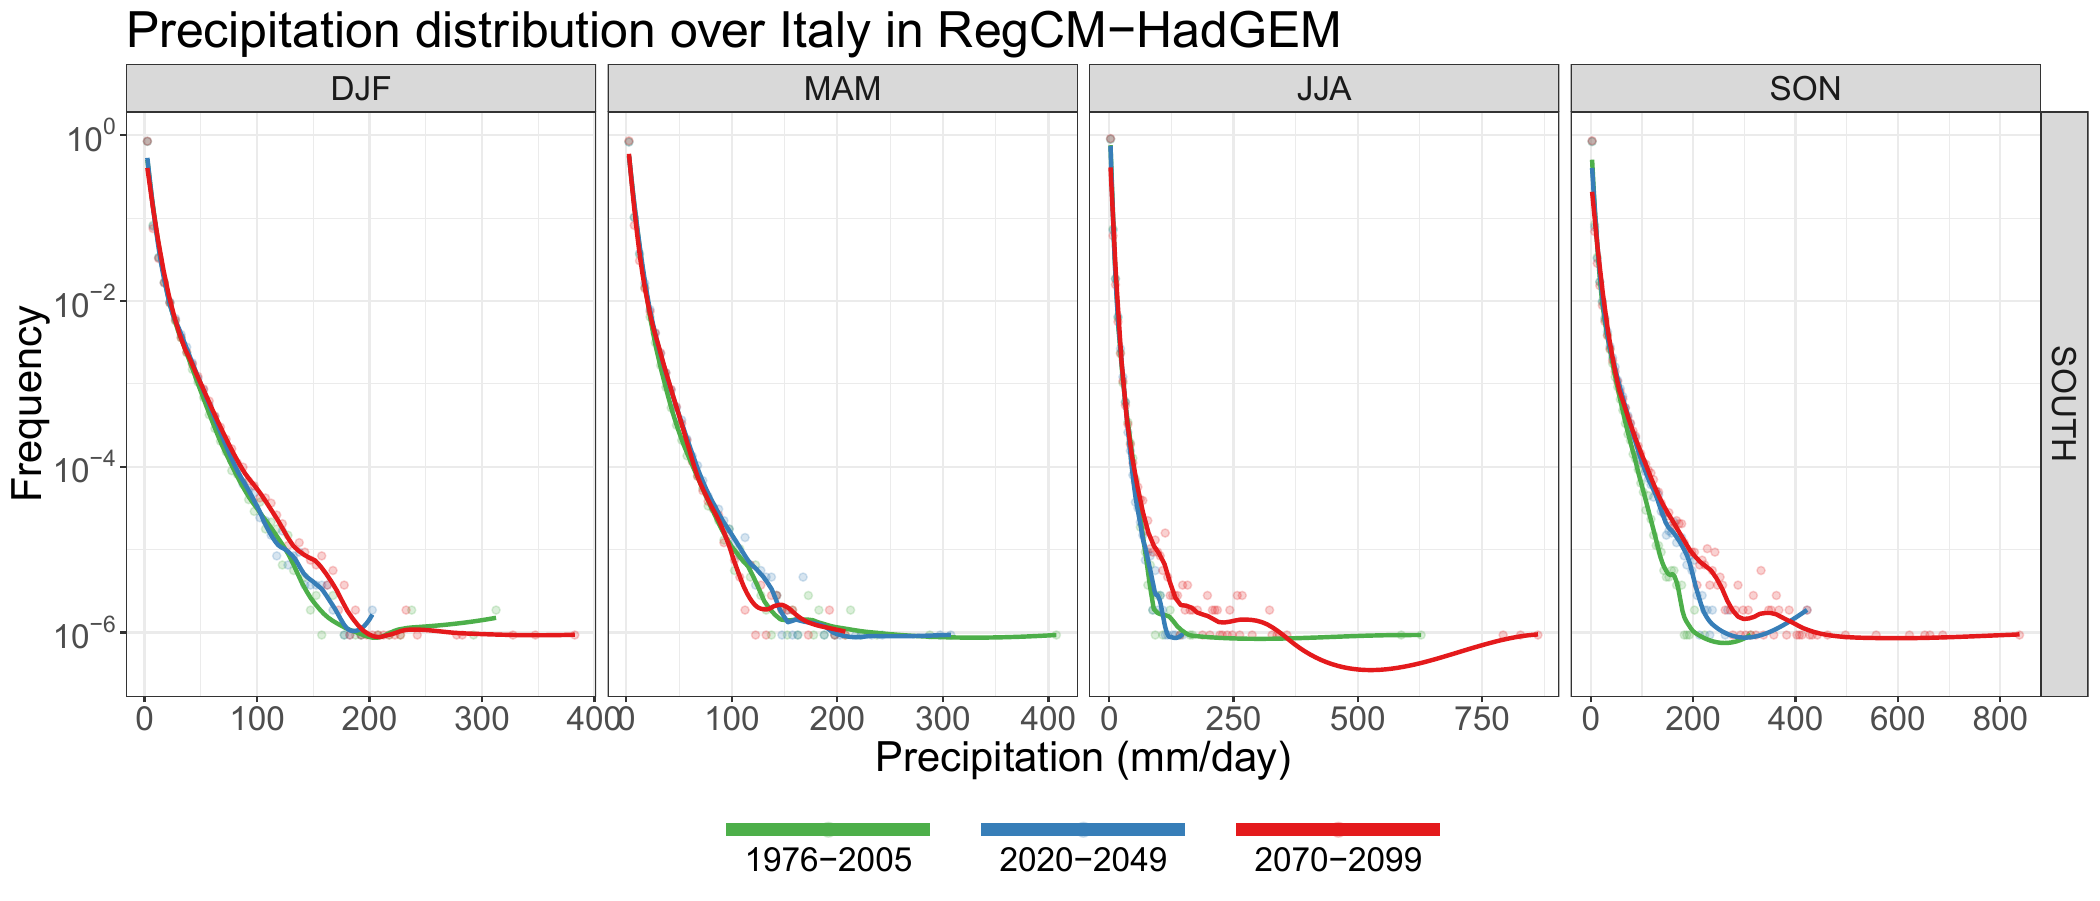
PDF change
3.x - Regional Climate Model
PDF change
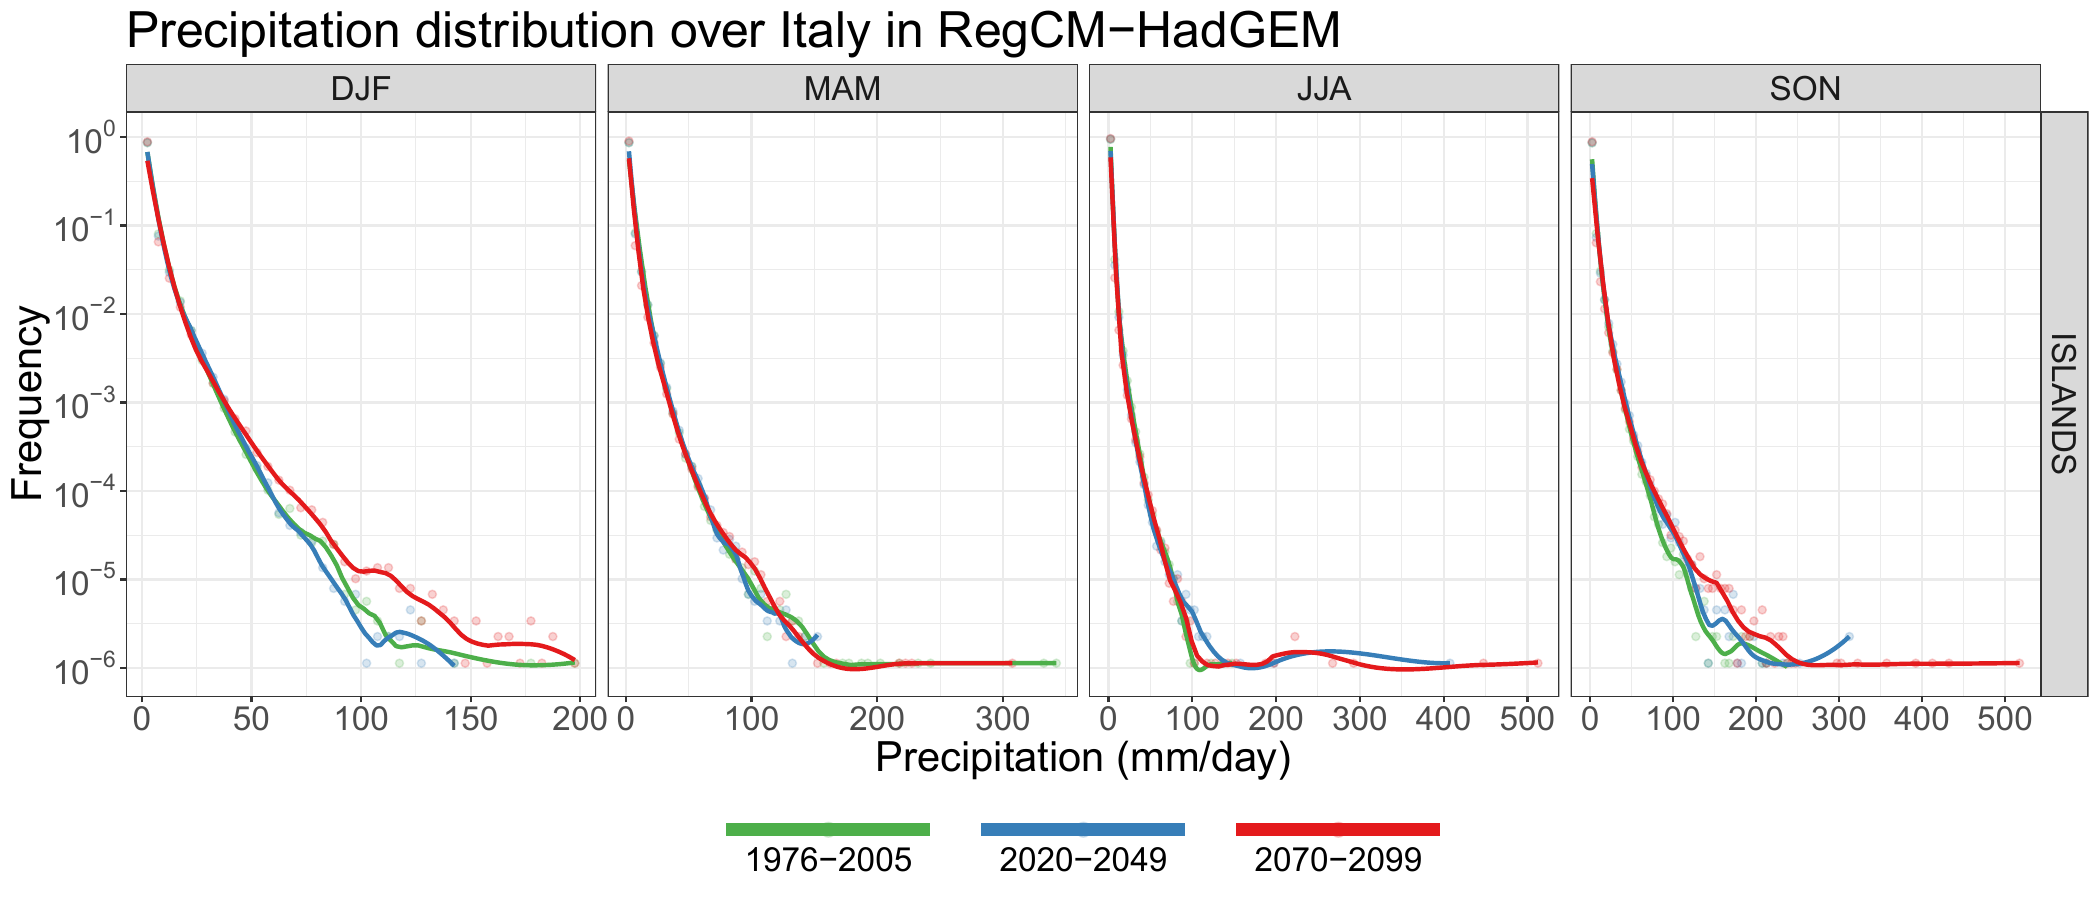
3.x - Regional Climate Model
R95ptot validation
3.x - Regional Climate Model
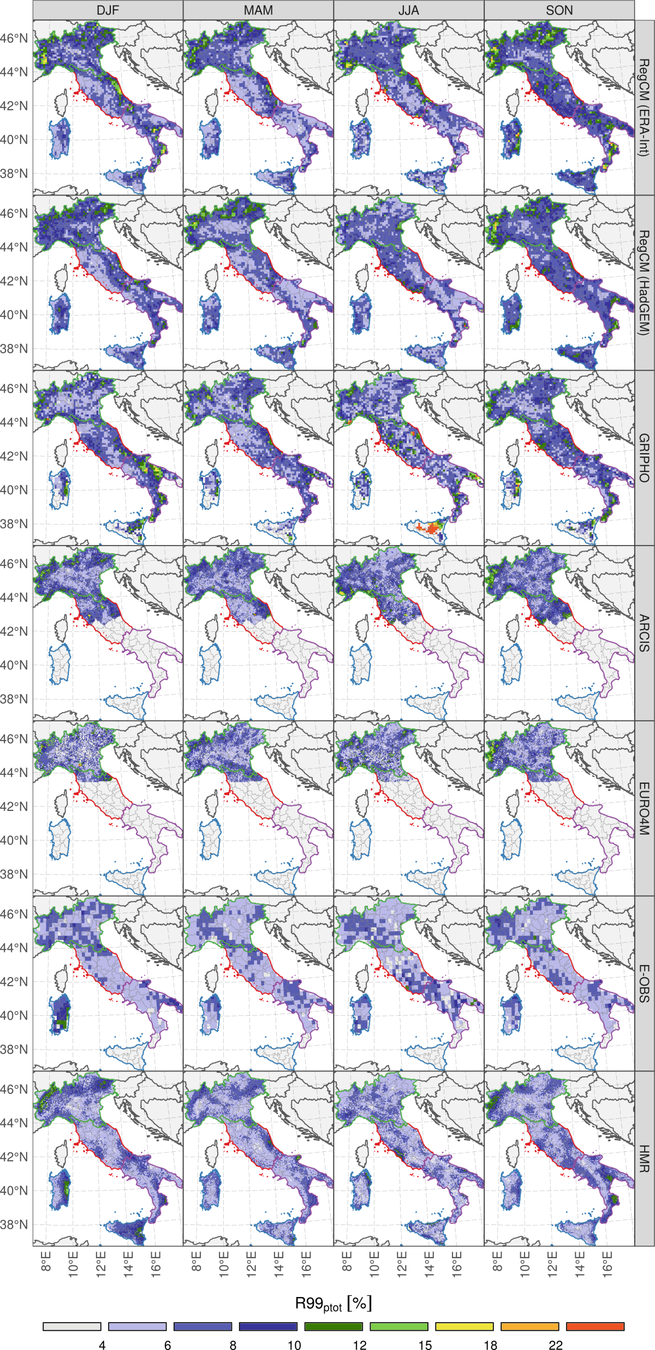
R99ptot validation
3.x - Regional Climate Model
TAS
PR
3.x - Regional Climate Model
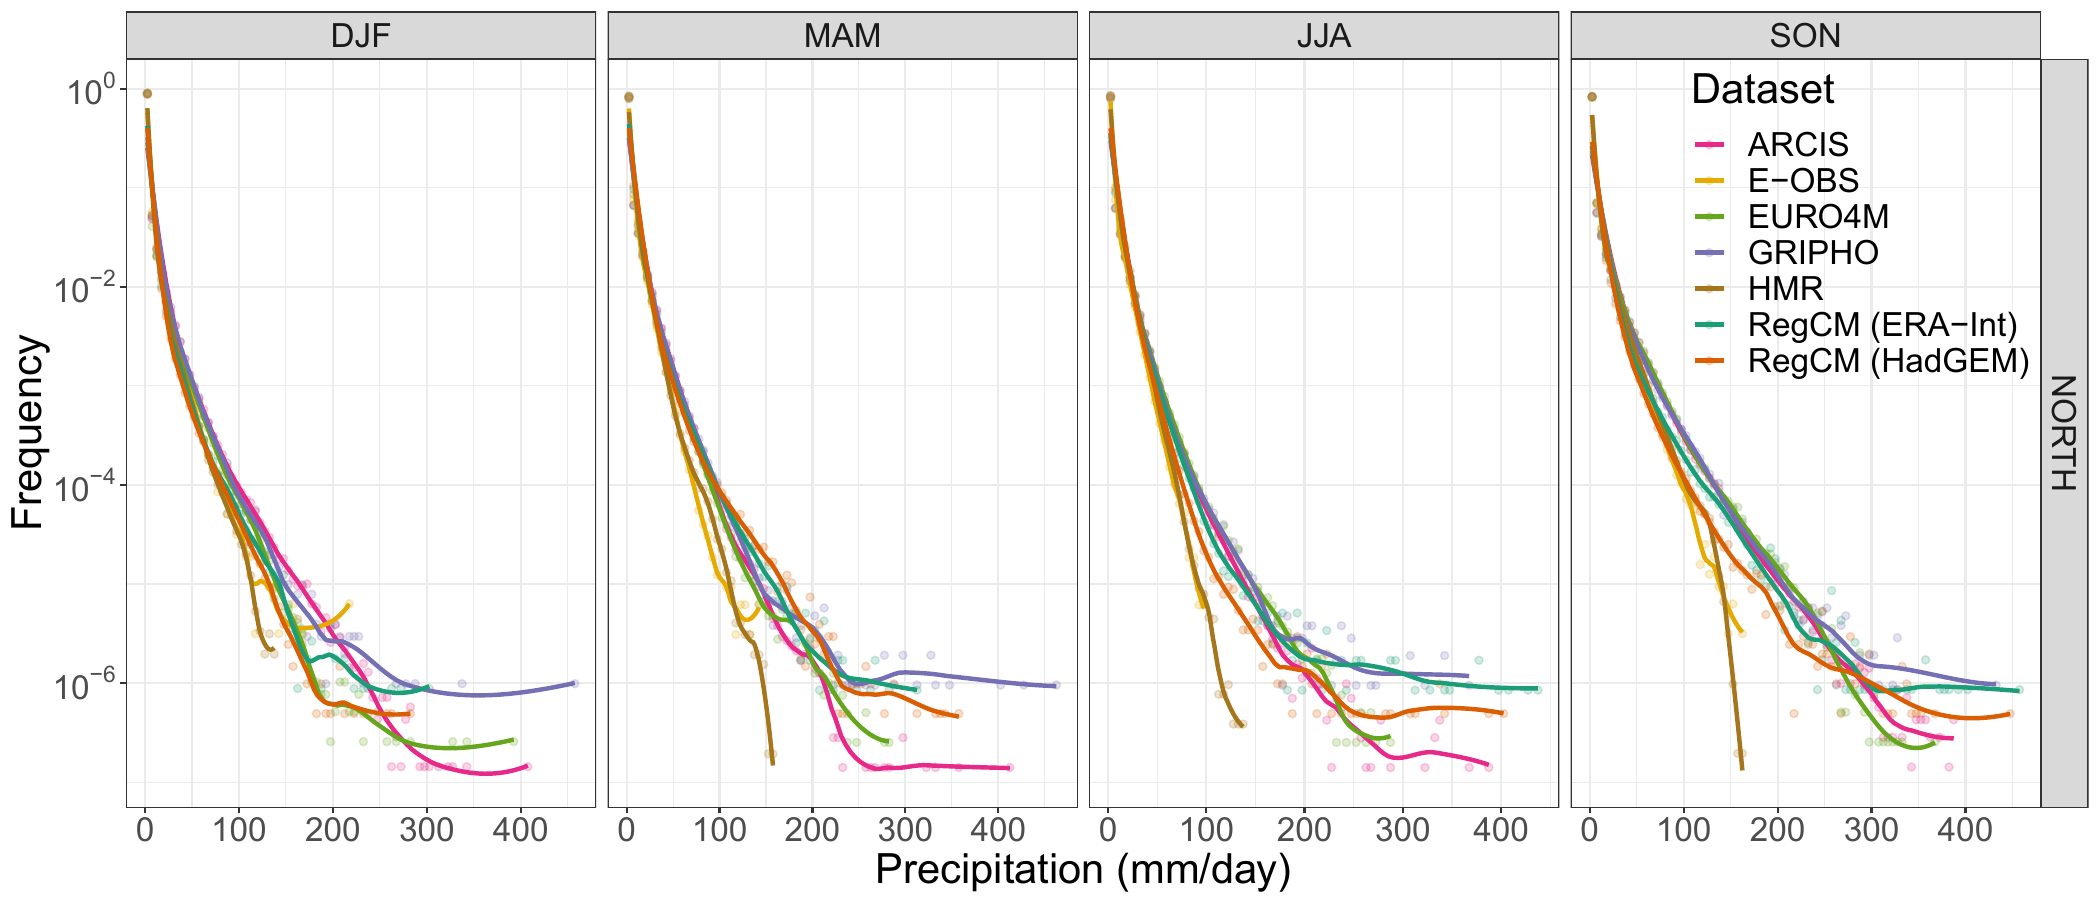
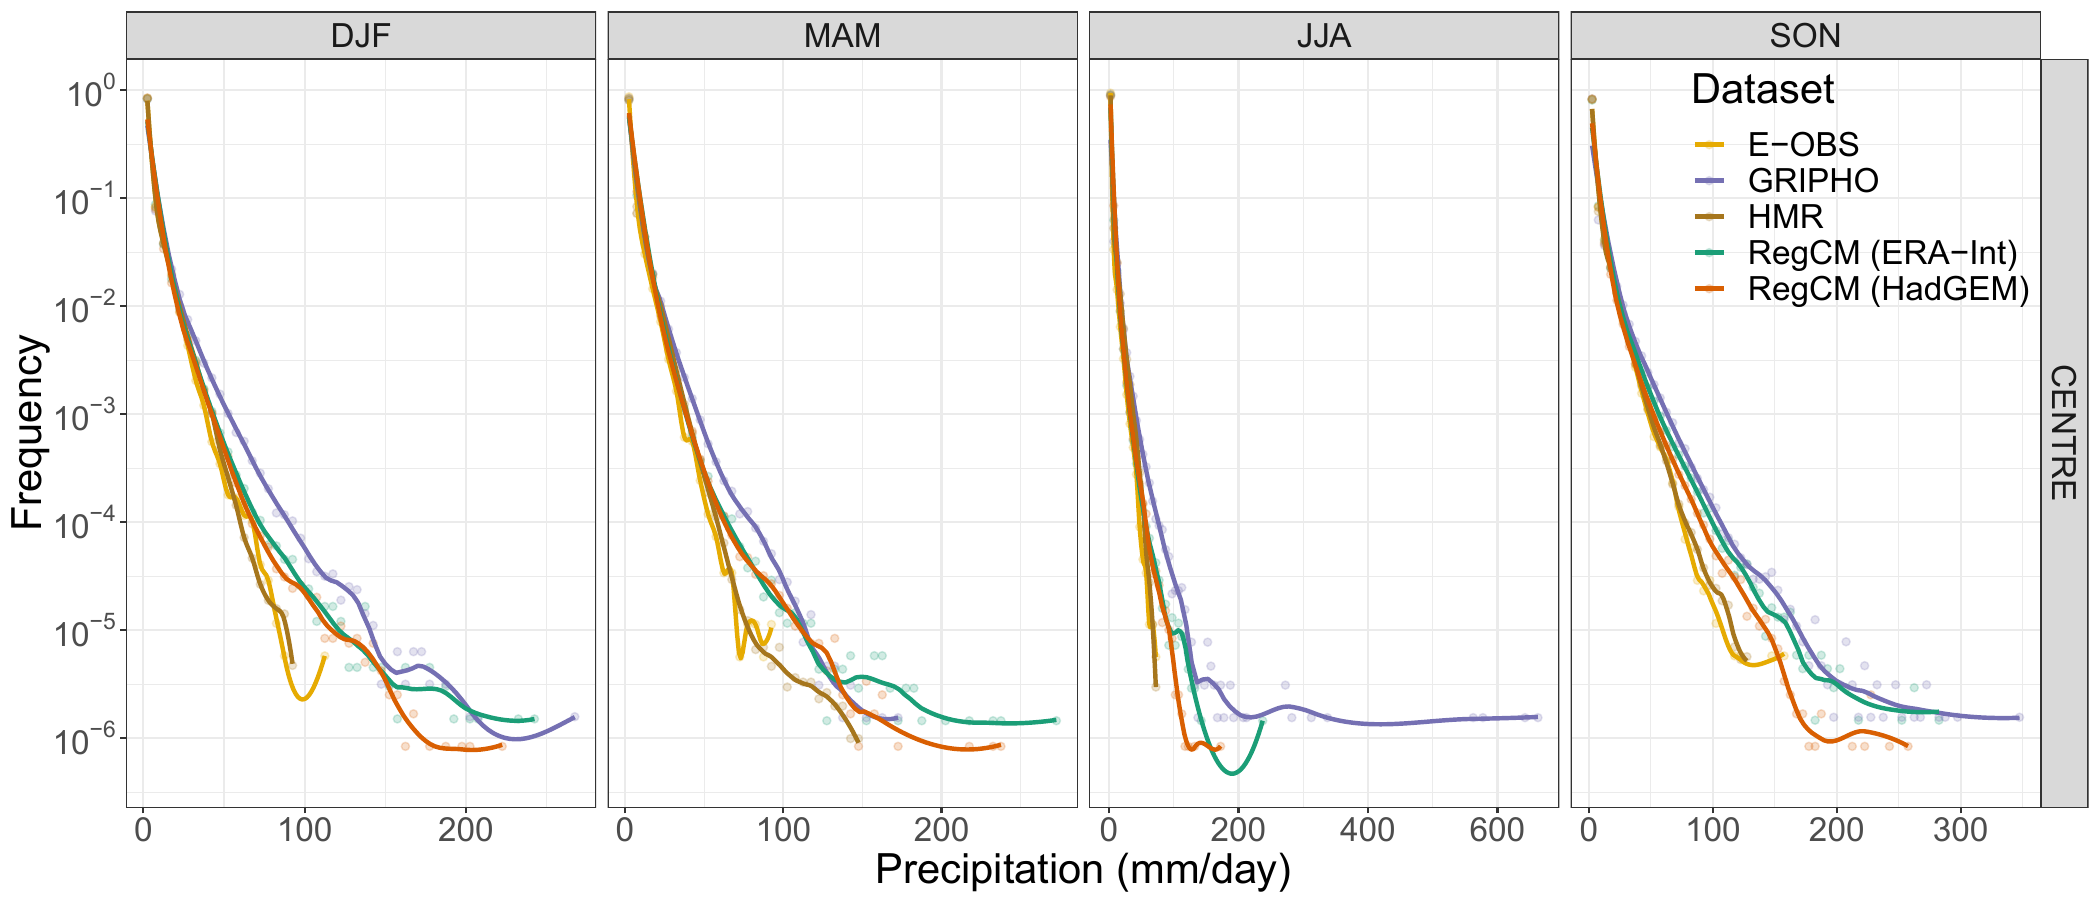
PDF validation
3.x - Regional Climate Model
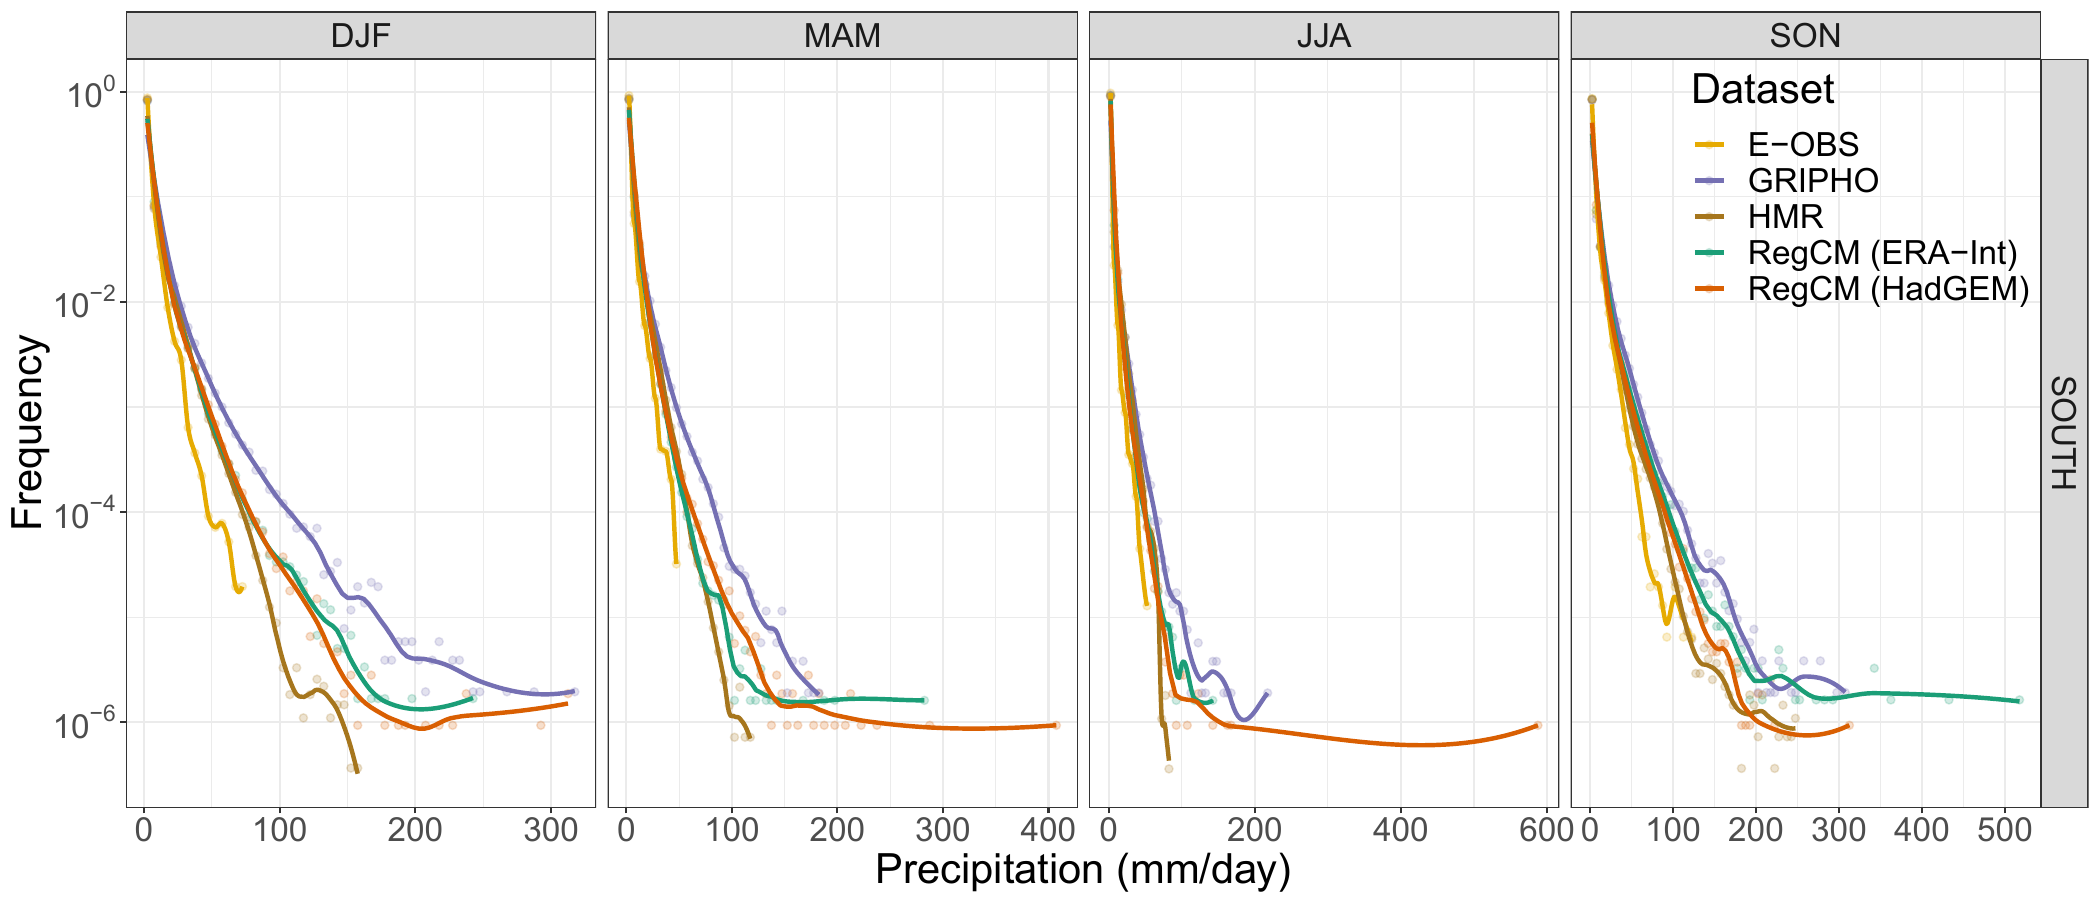
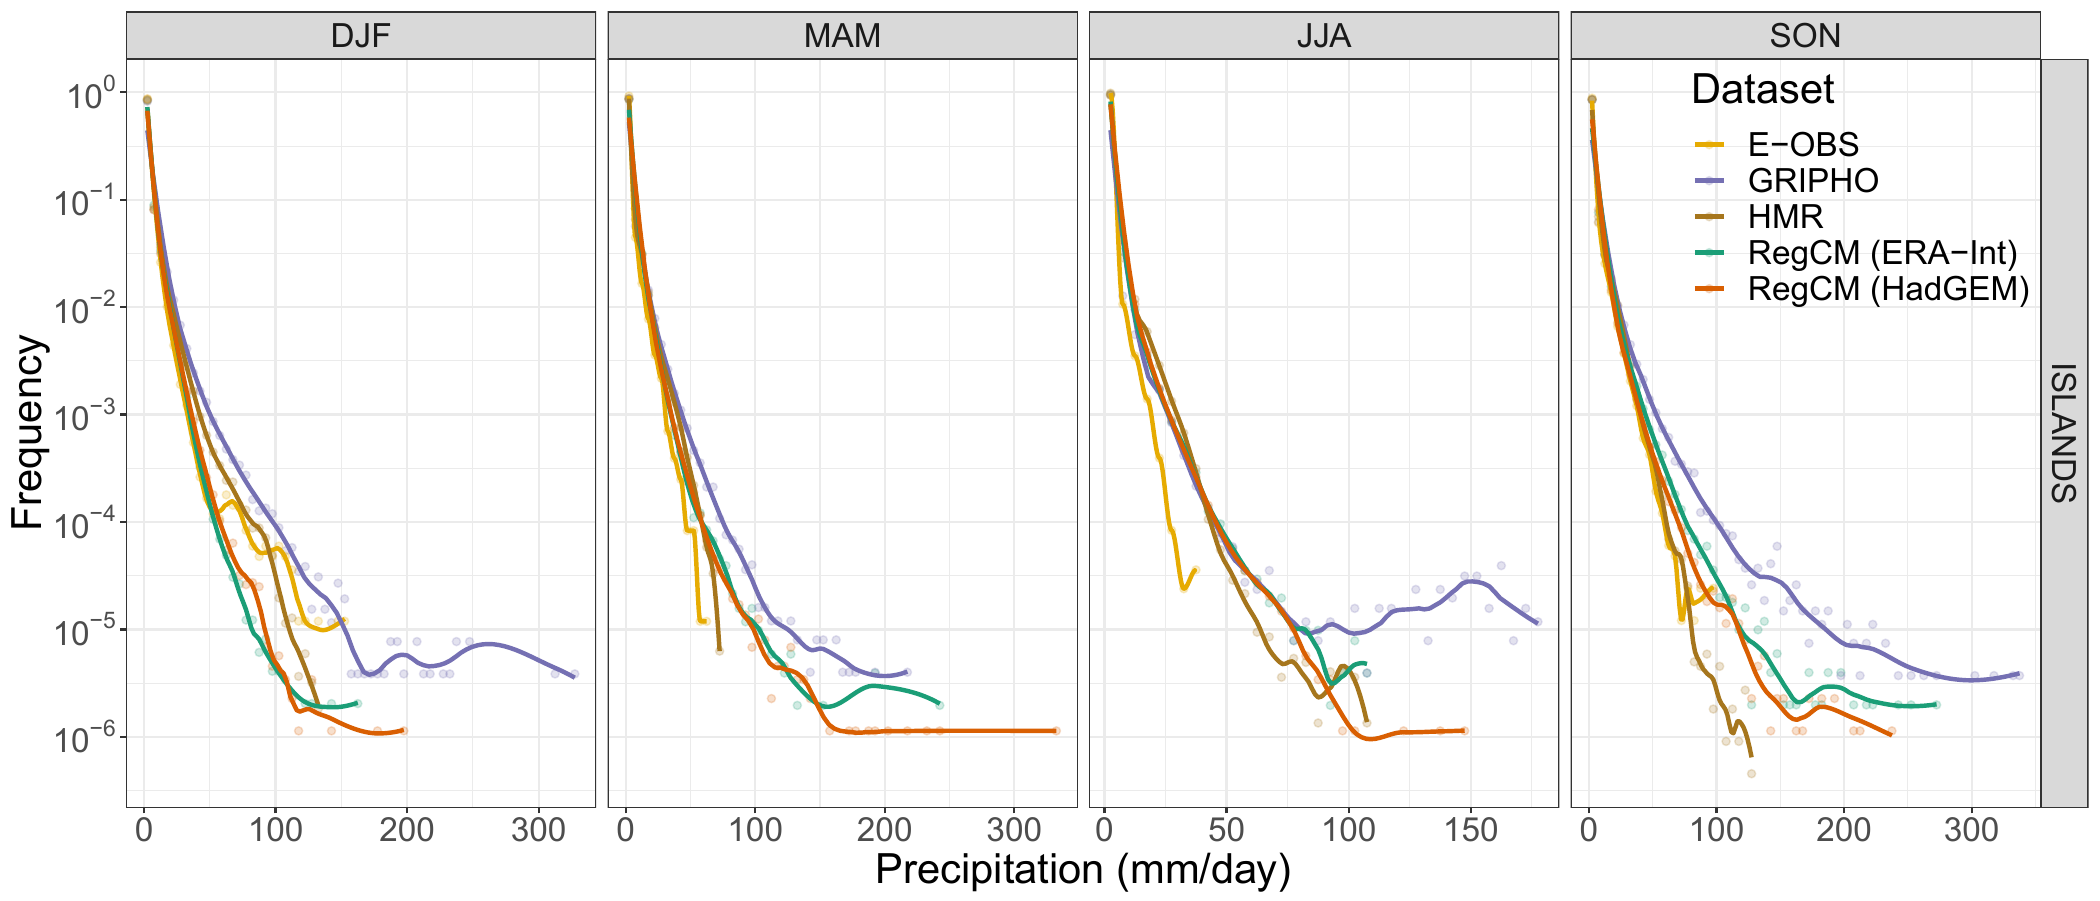
PDF validation
3.x - Regional Climate Model
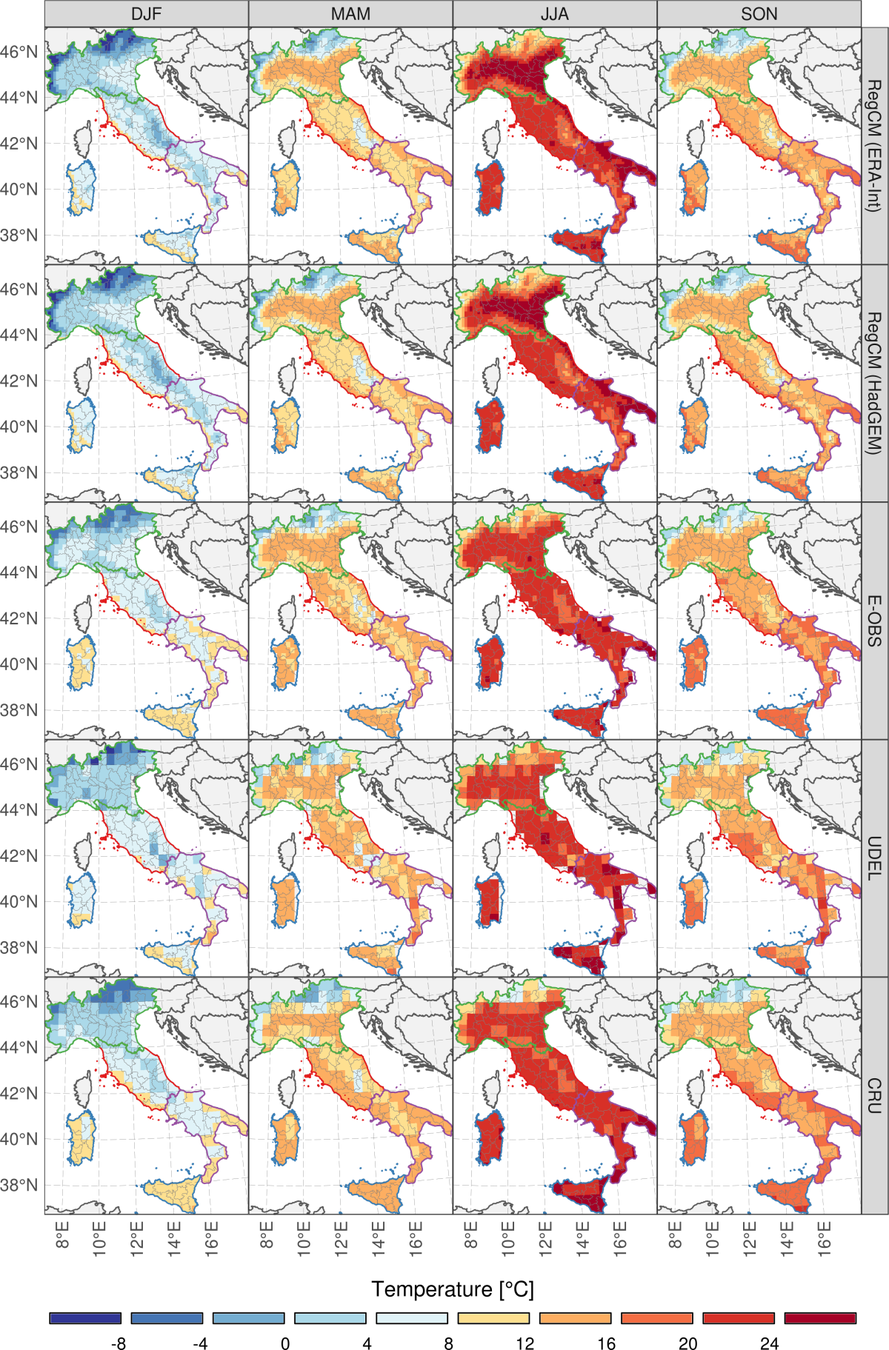
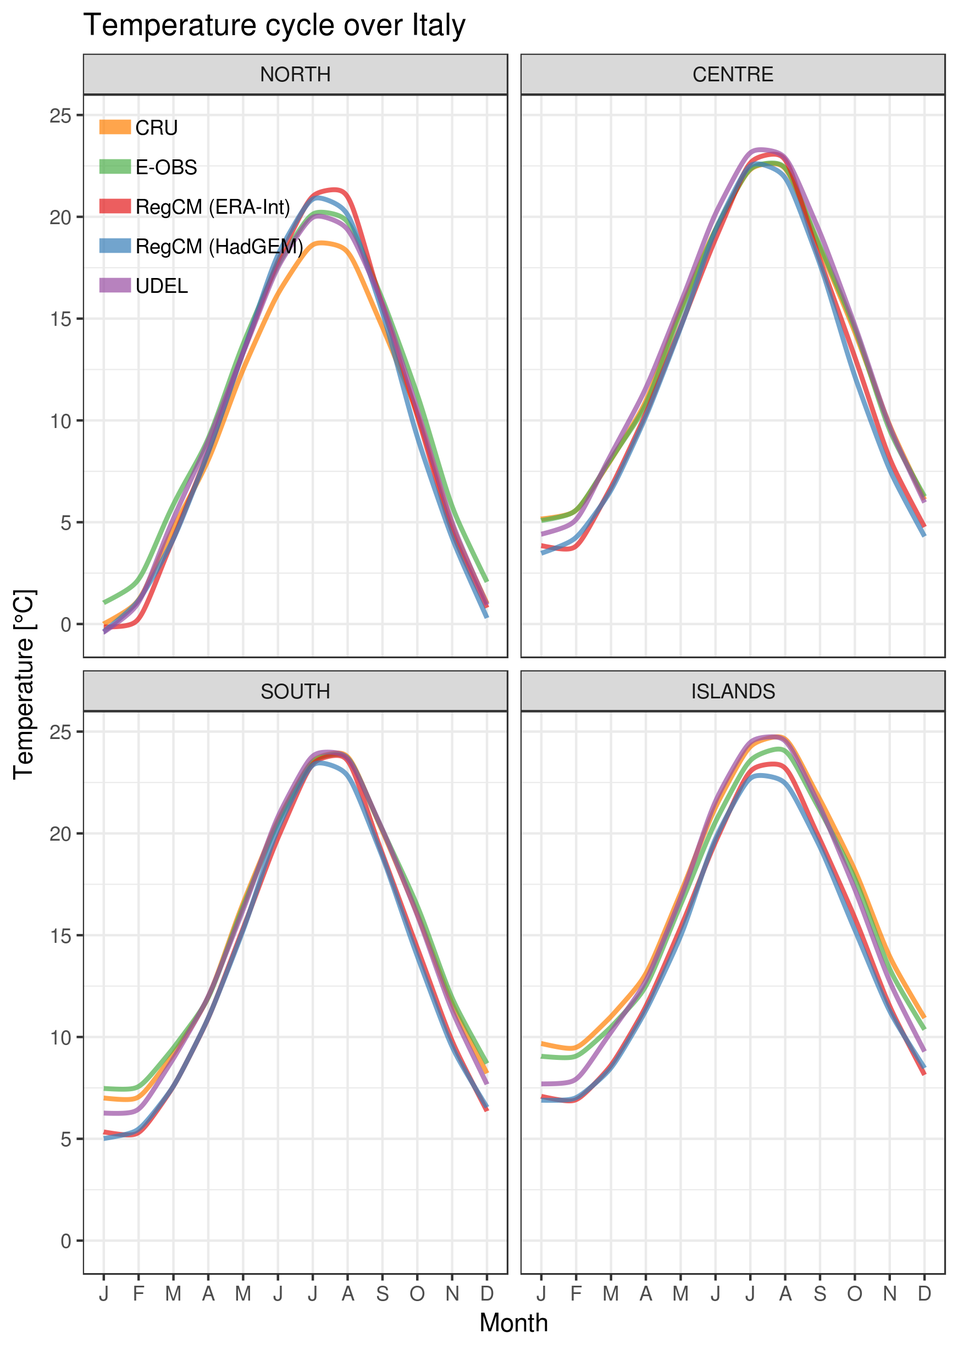
Temperature validation
3.x - Regional Climate Model
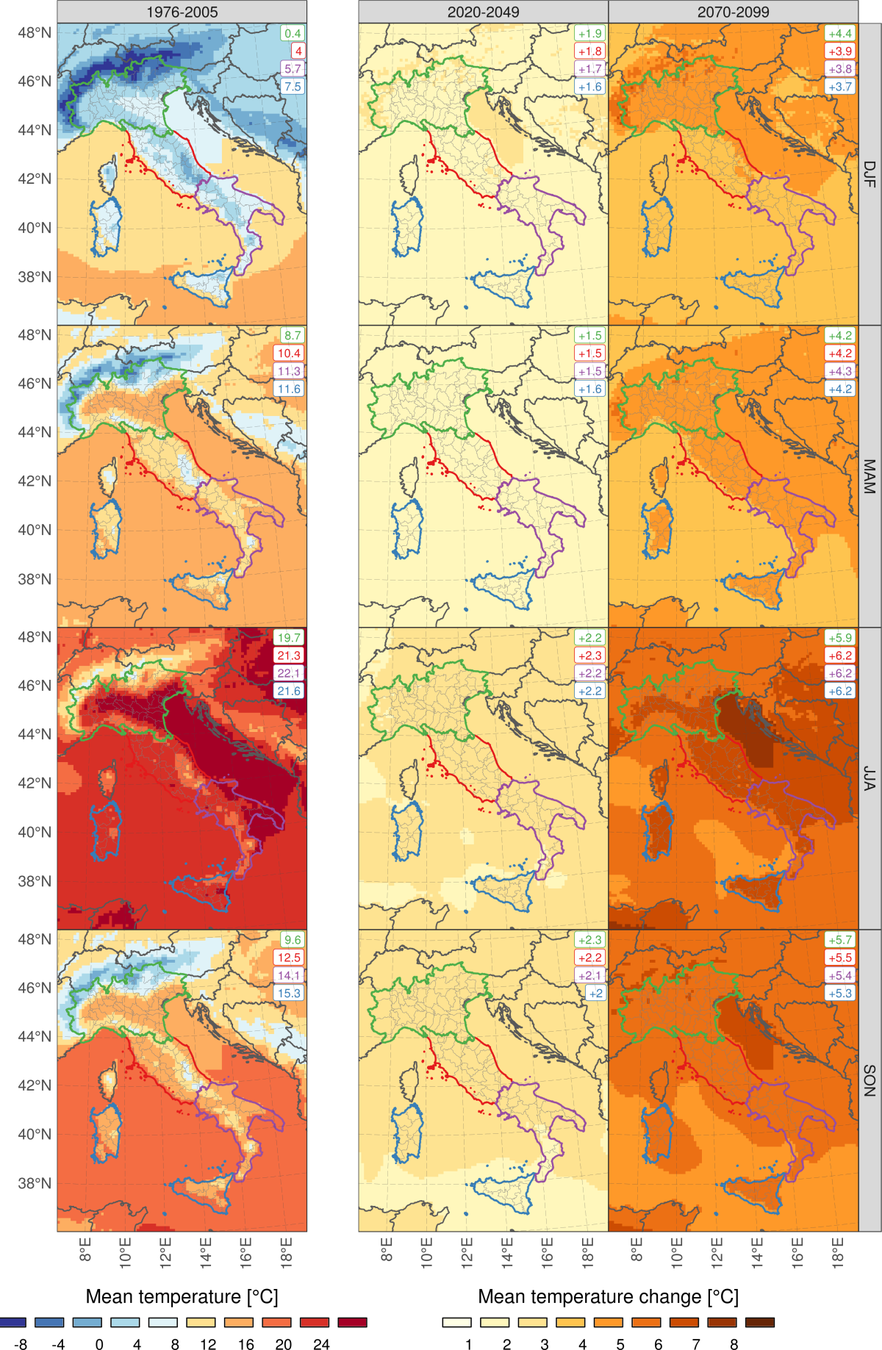
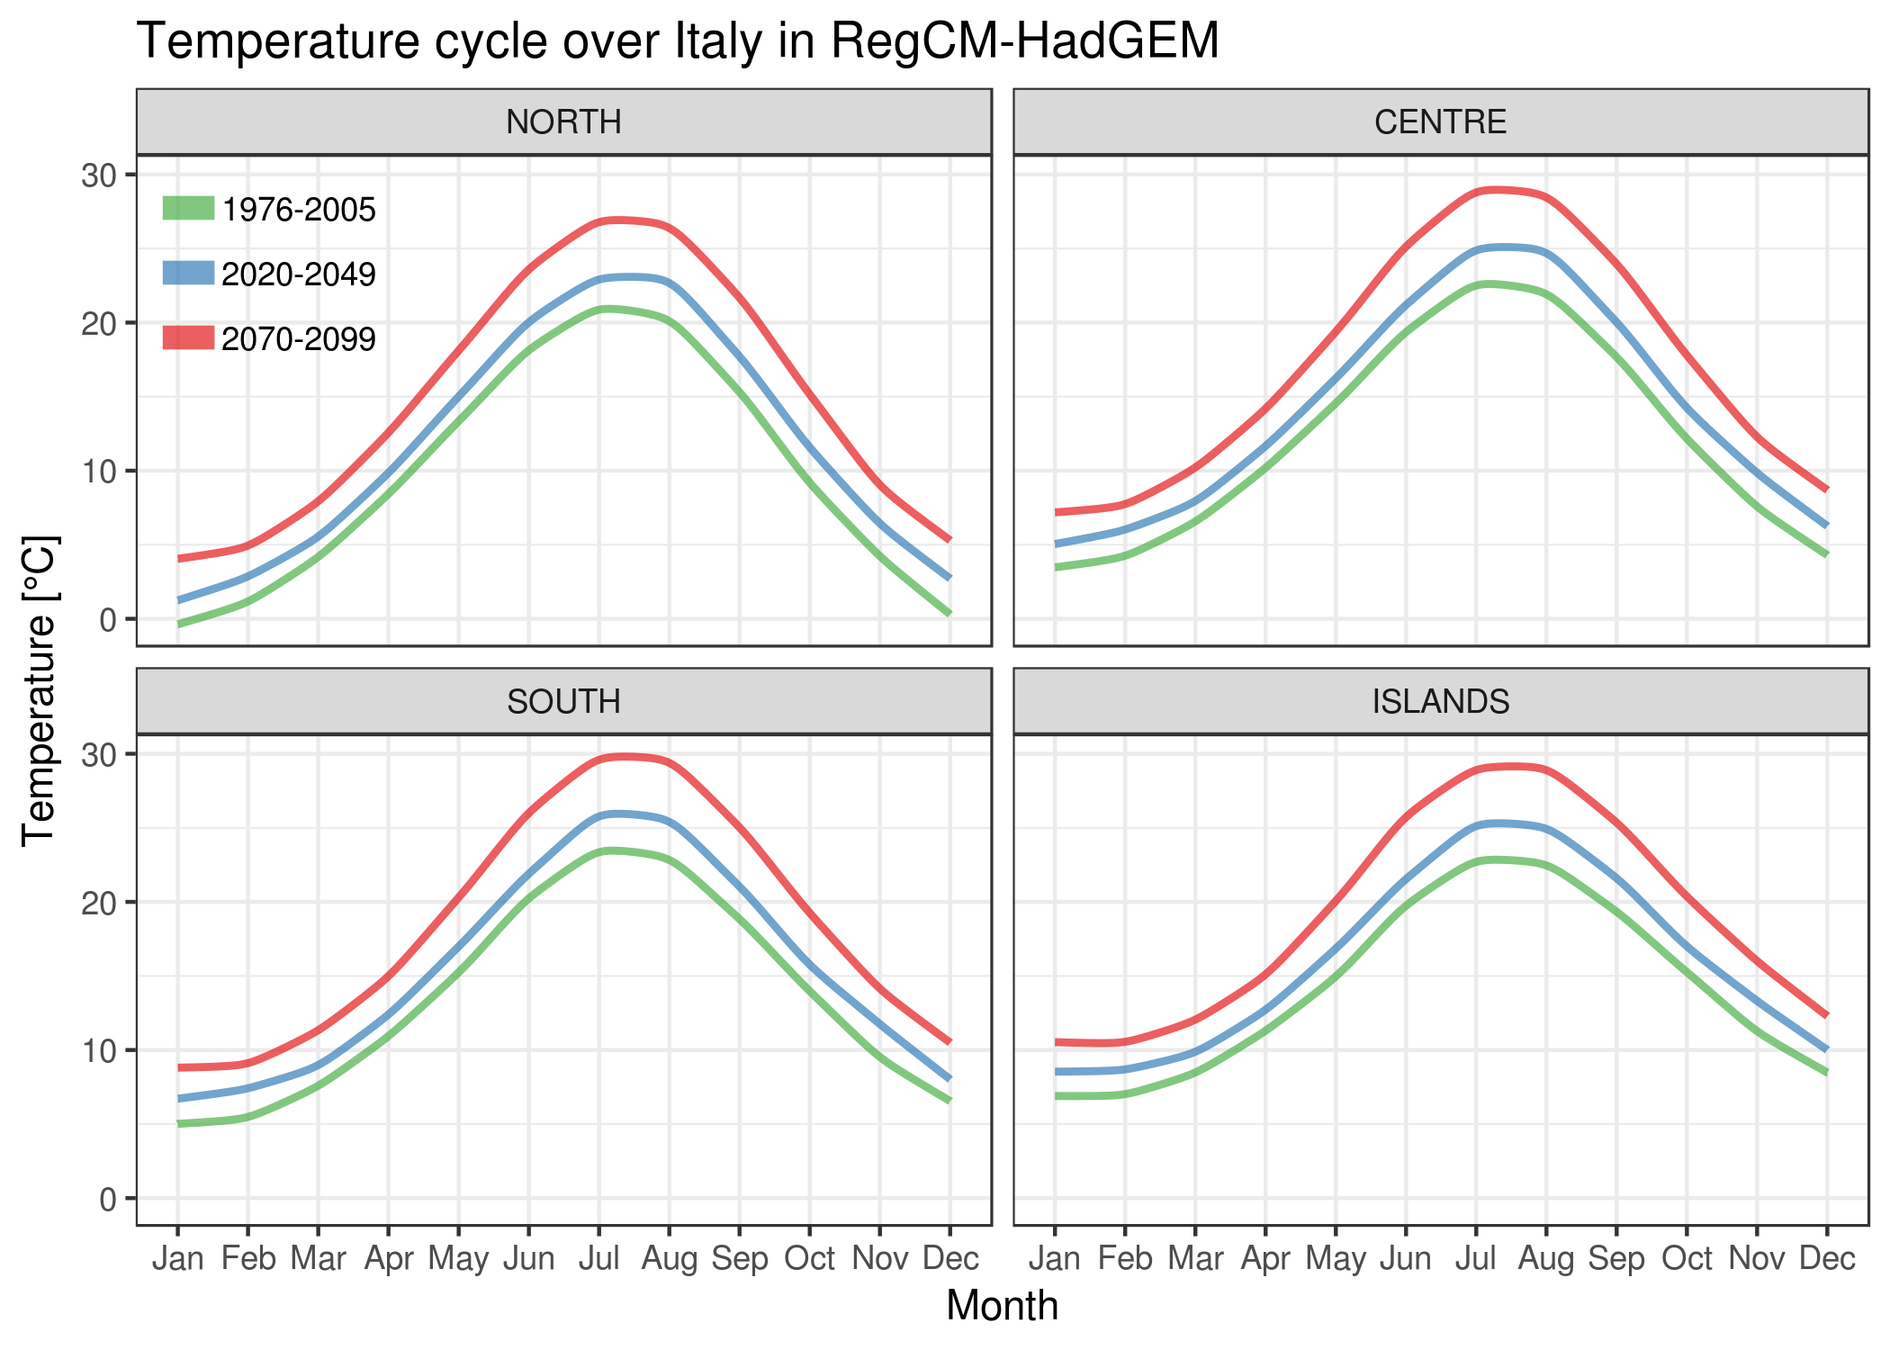
Temperature change
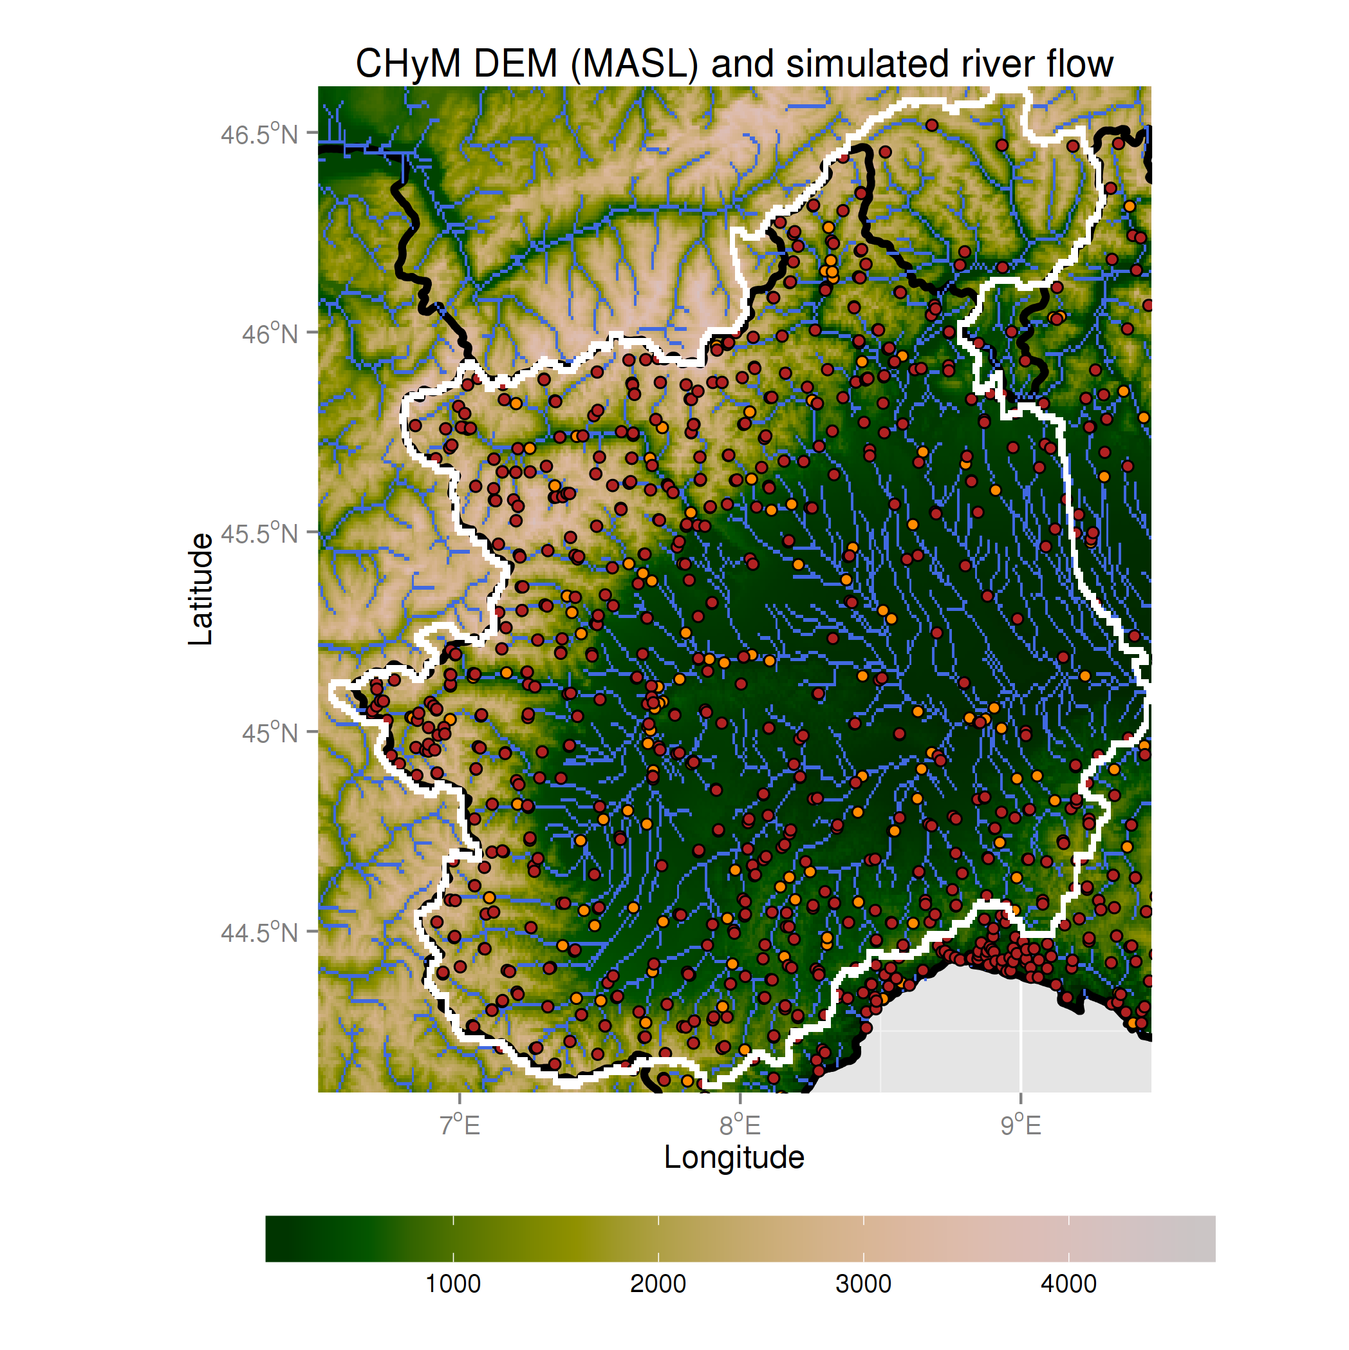
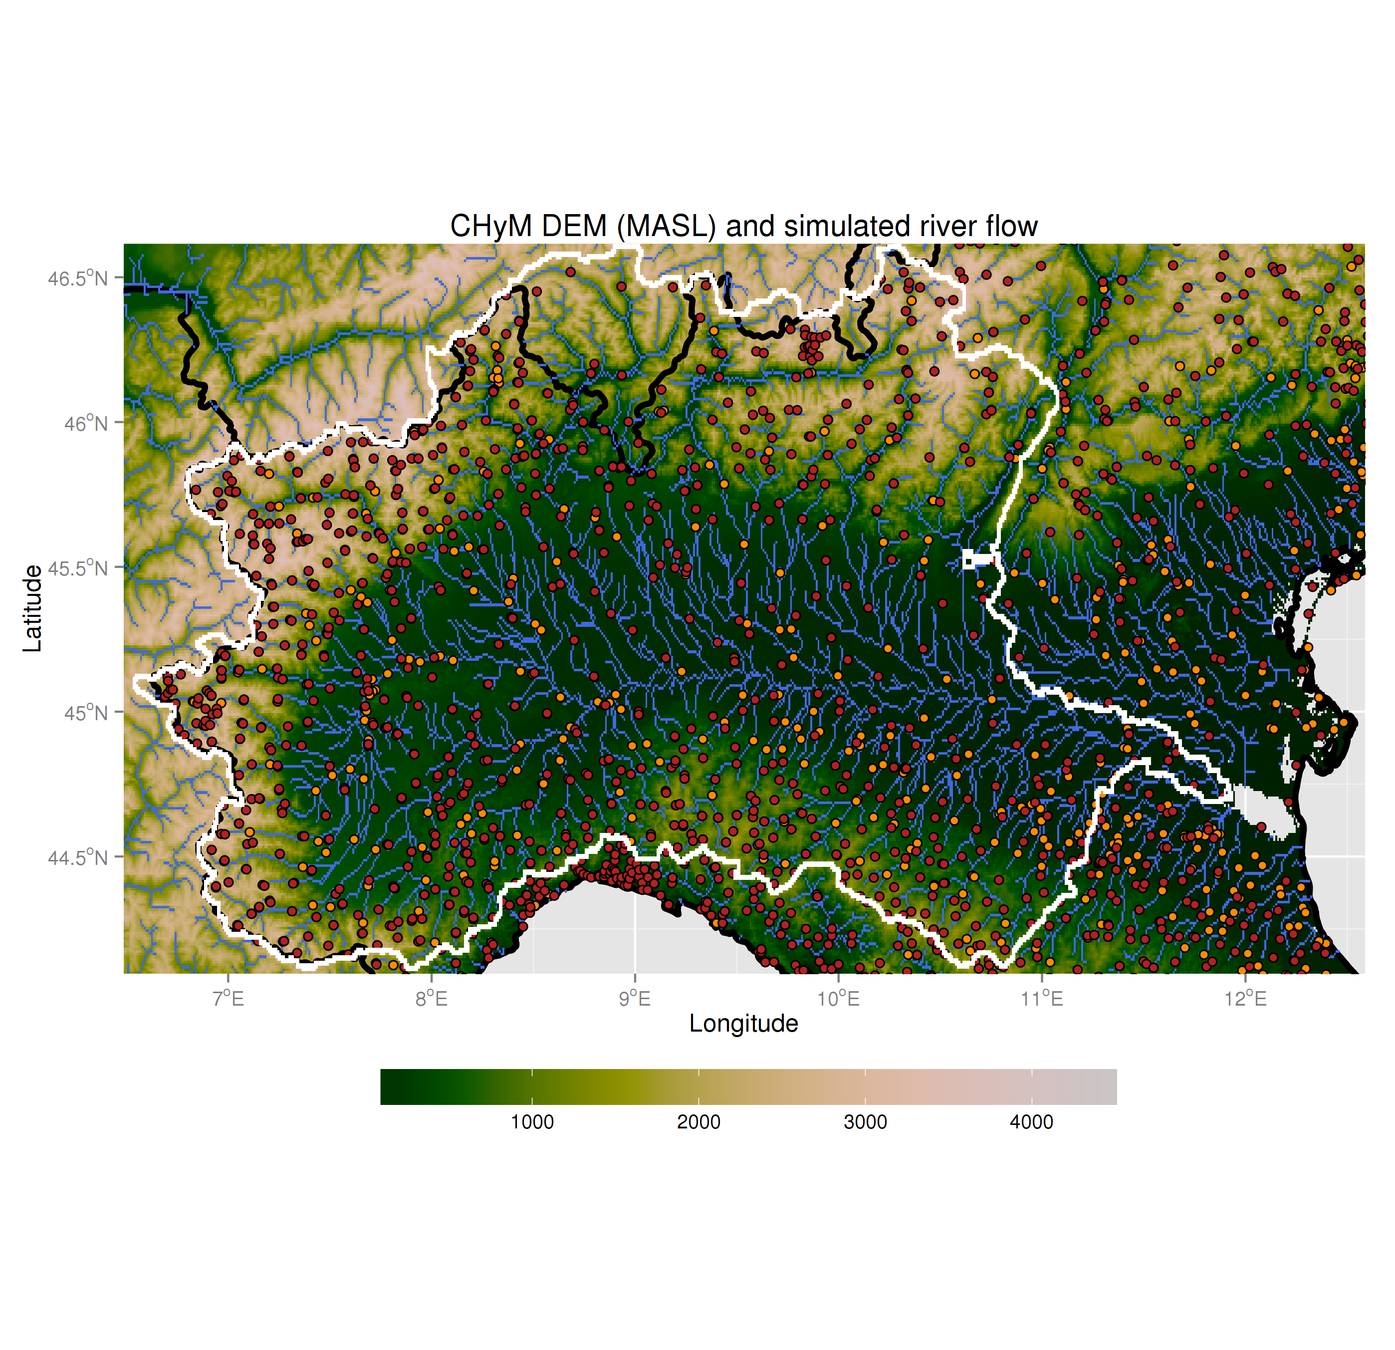
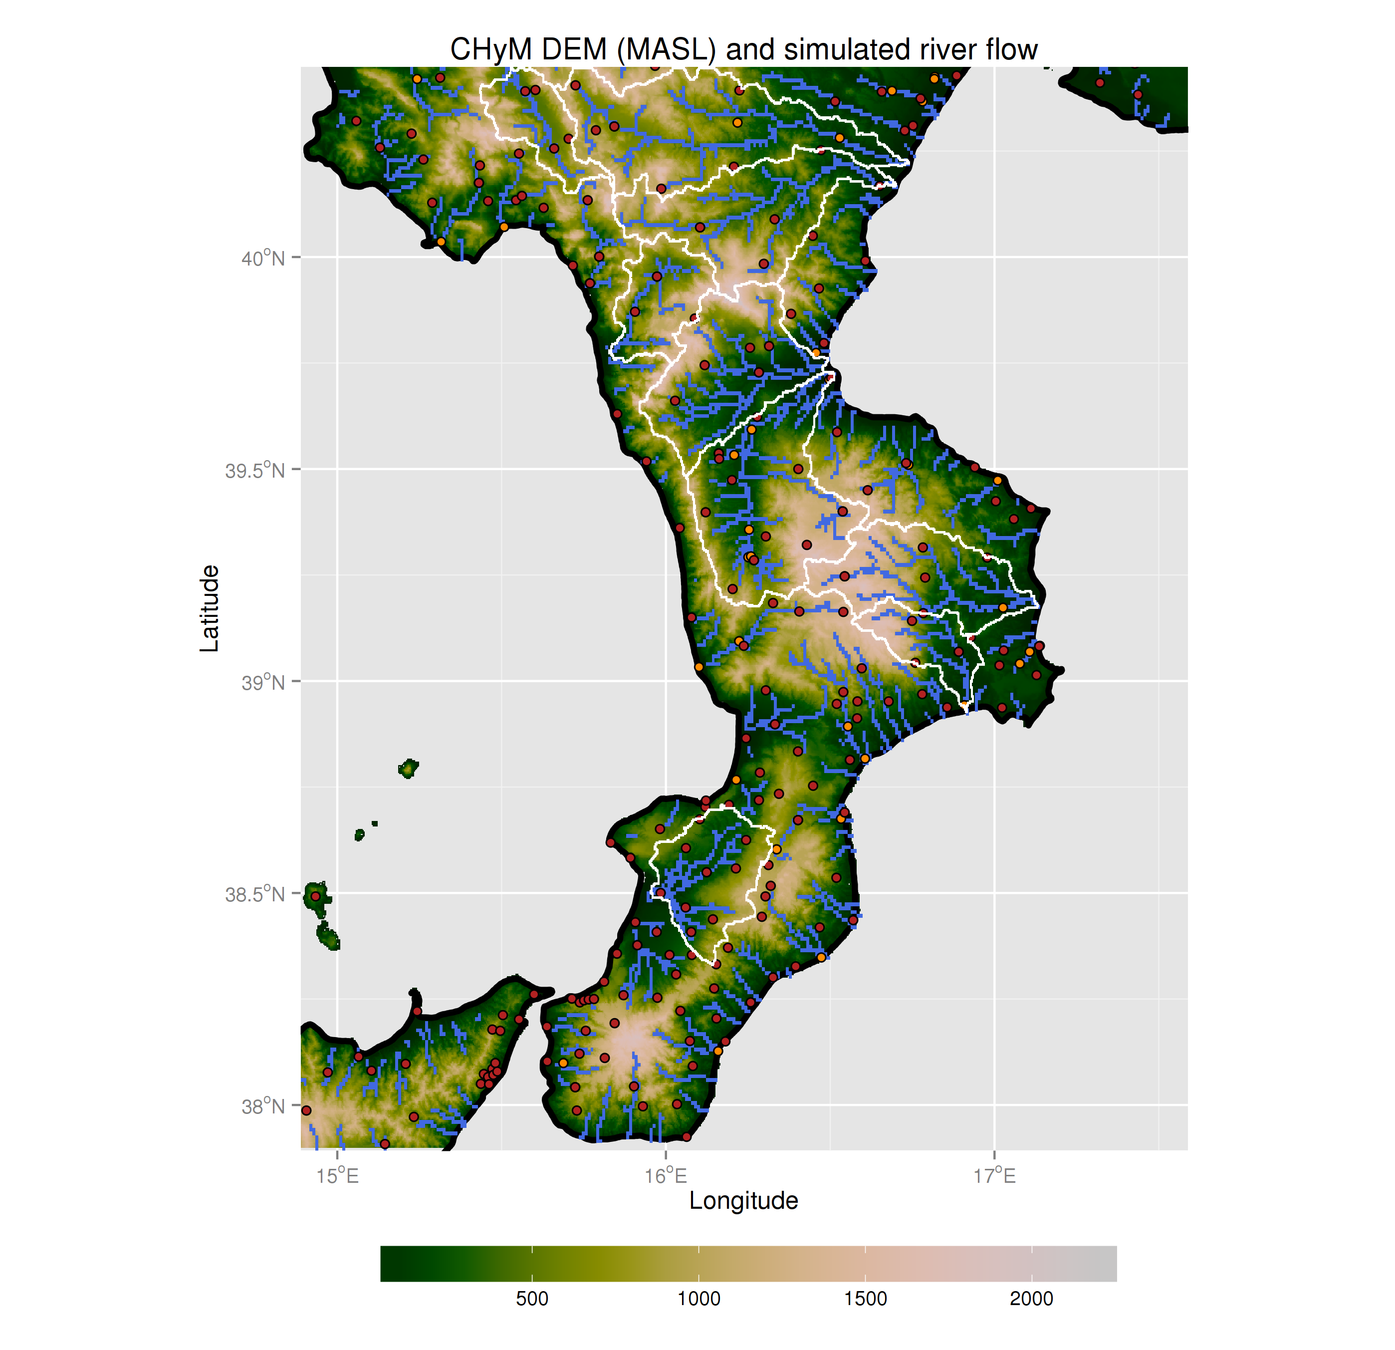
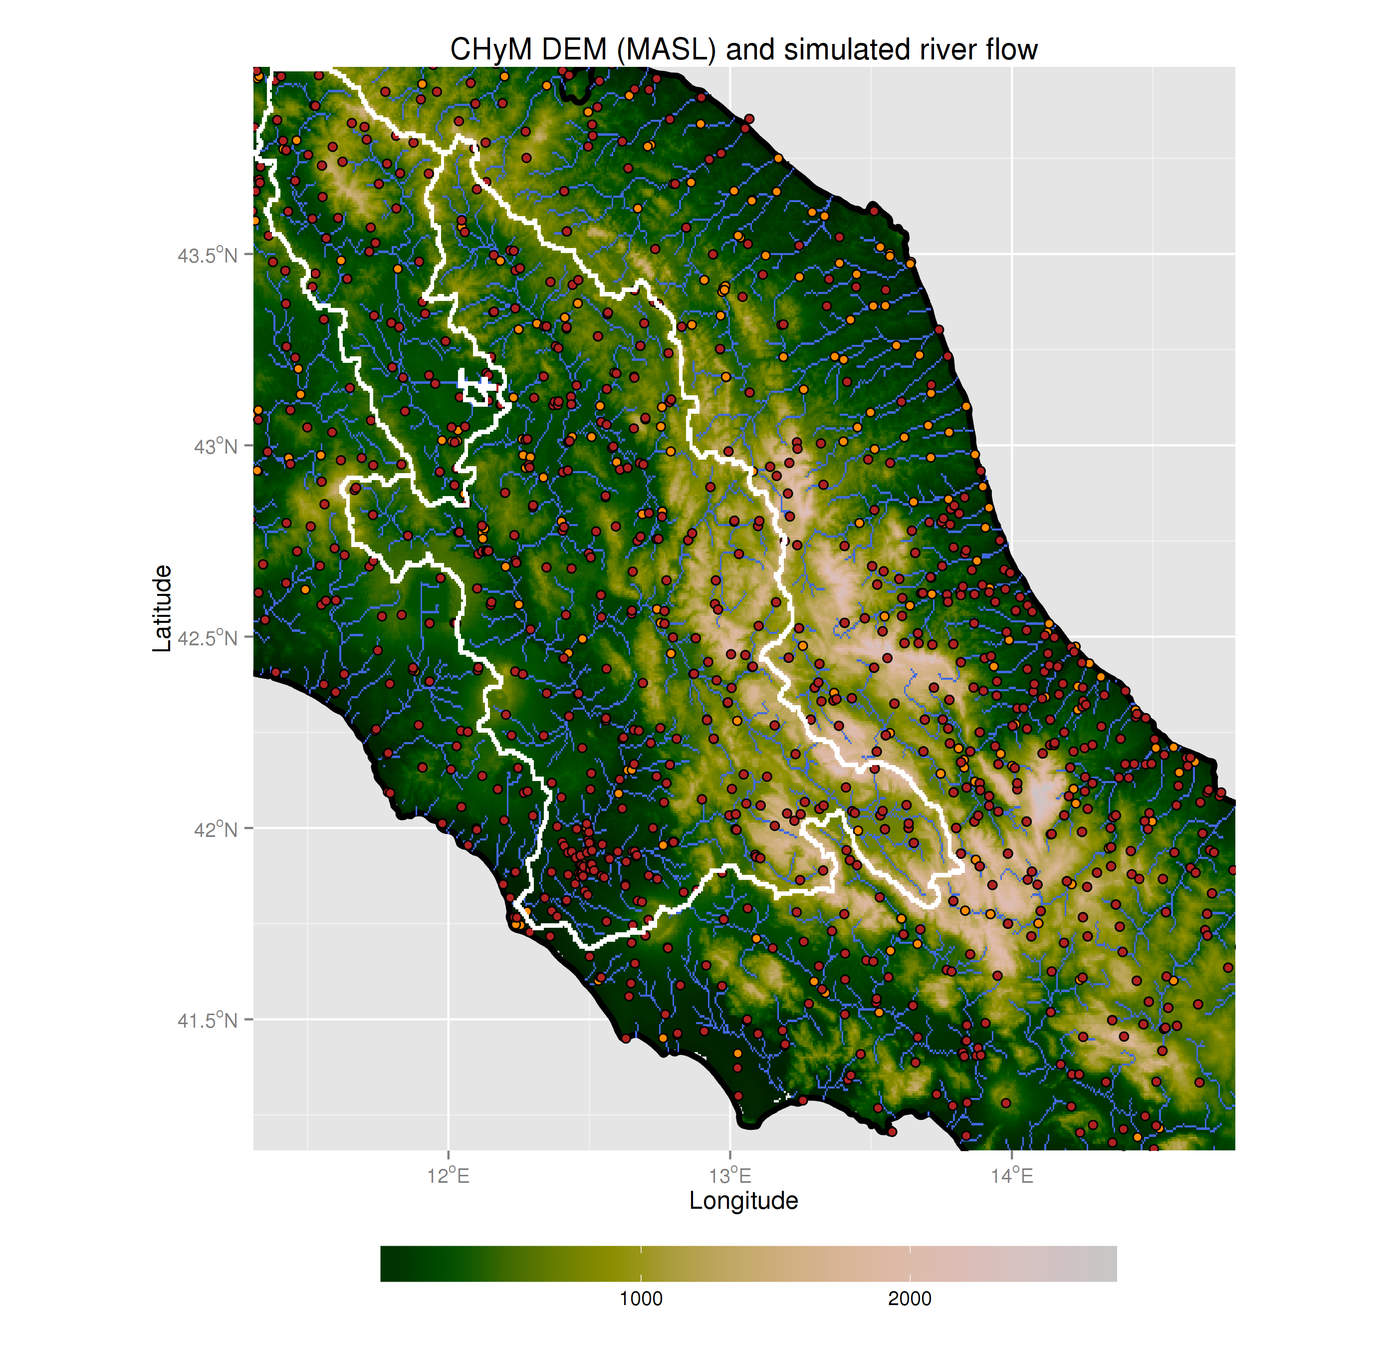
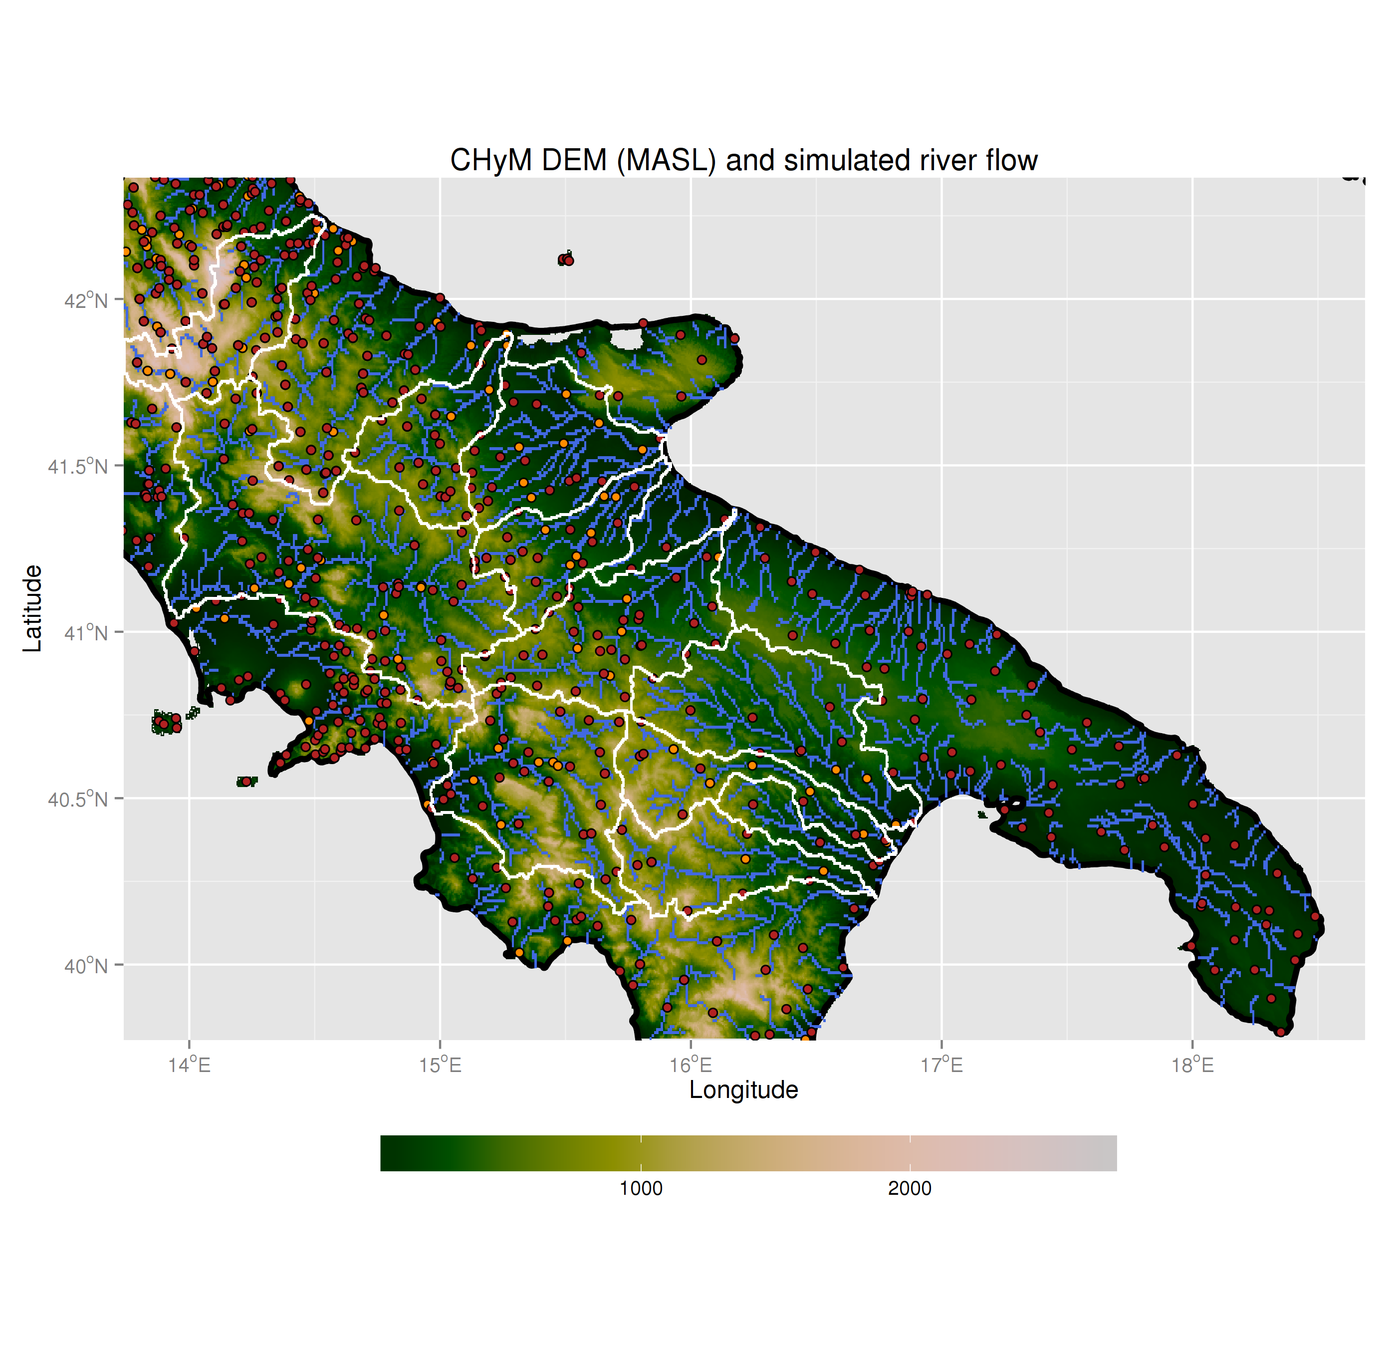
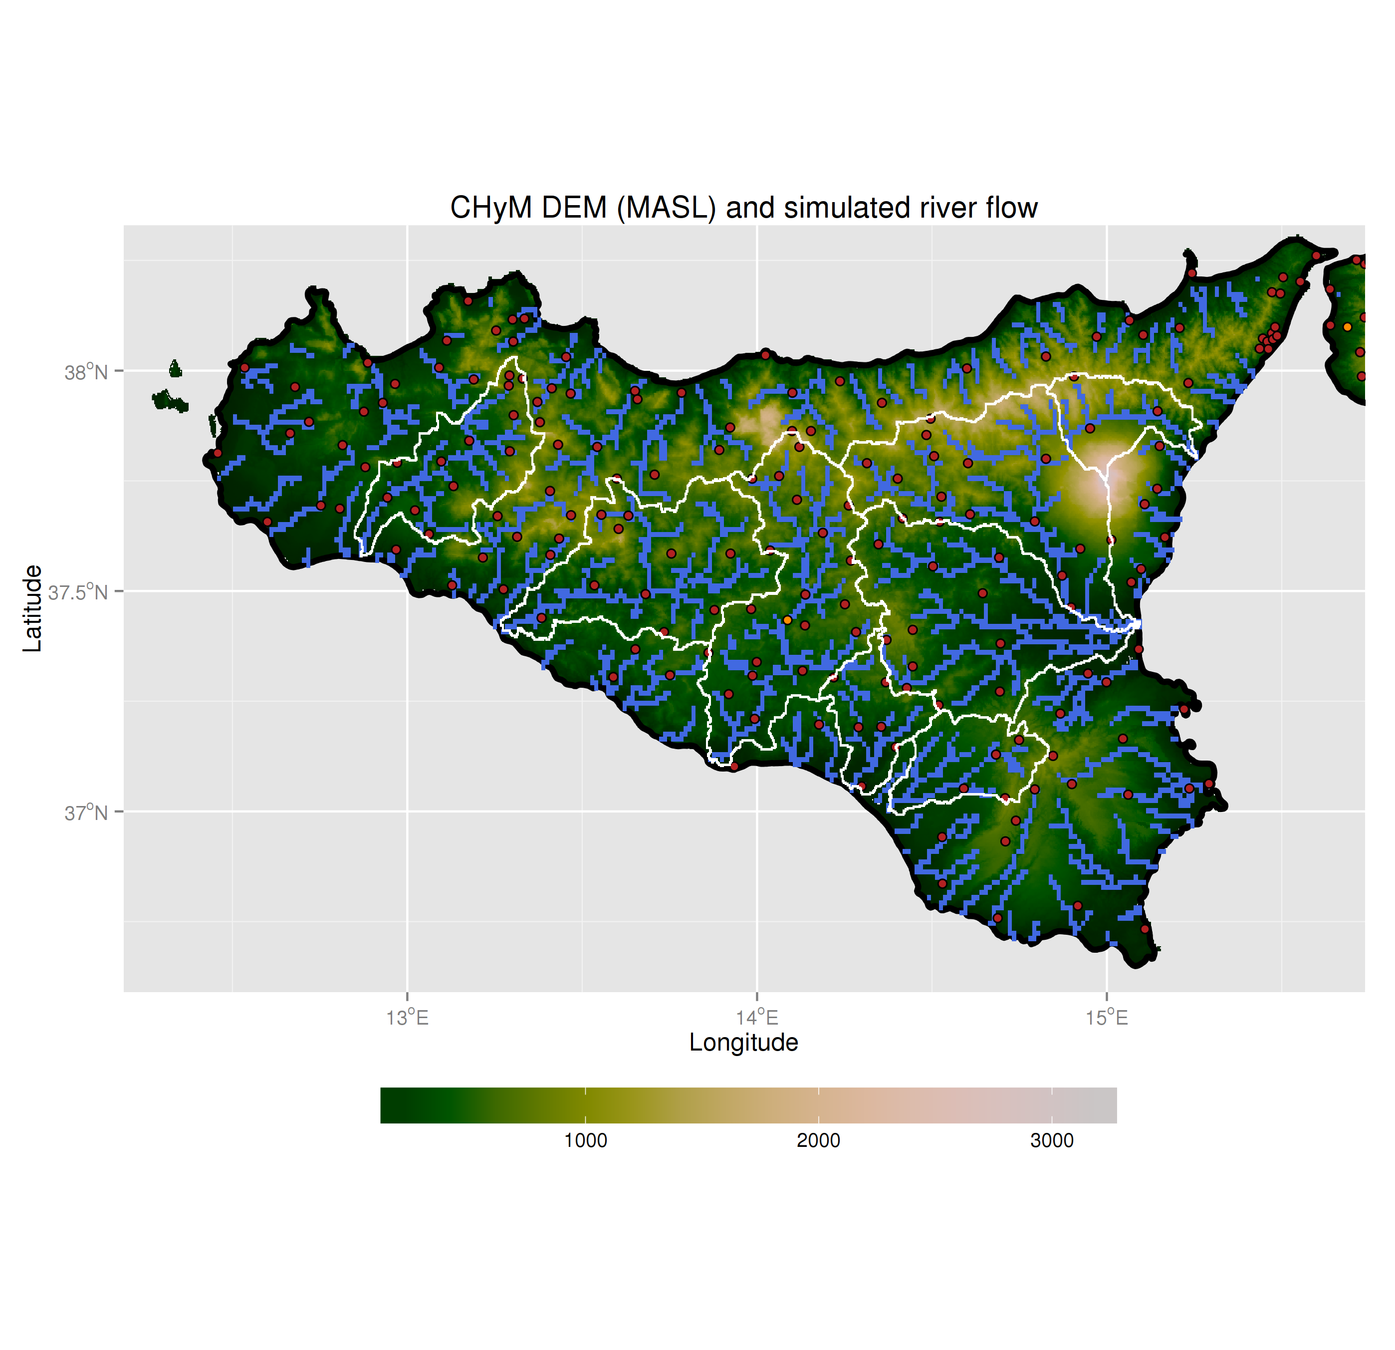
4.0 - Cetemps Hydrological Model
CHyM Is a distributed (gridded) hydrological model. Peculiarities:
- Can build DEM from various sources, smoothing by cellula automata algorithms
- Can use several kind of inputs, such as station observations, gridded model data, etc.
- Designed to work on any domain
- Used daily at CETEMPS for operational forecasts
- Hourly NetCDF output
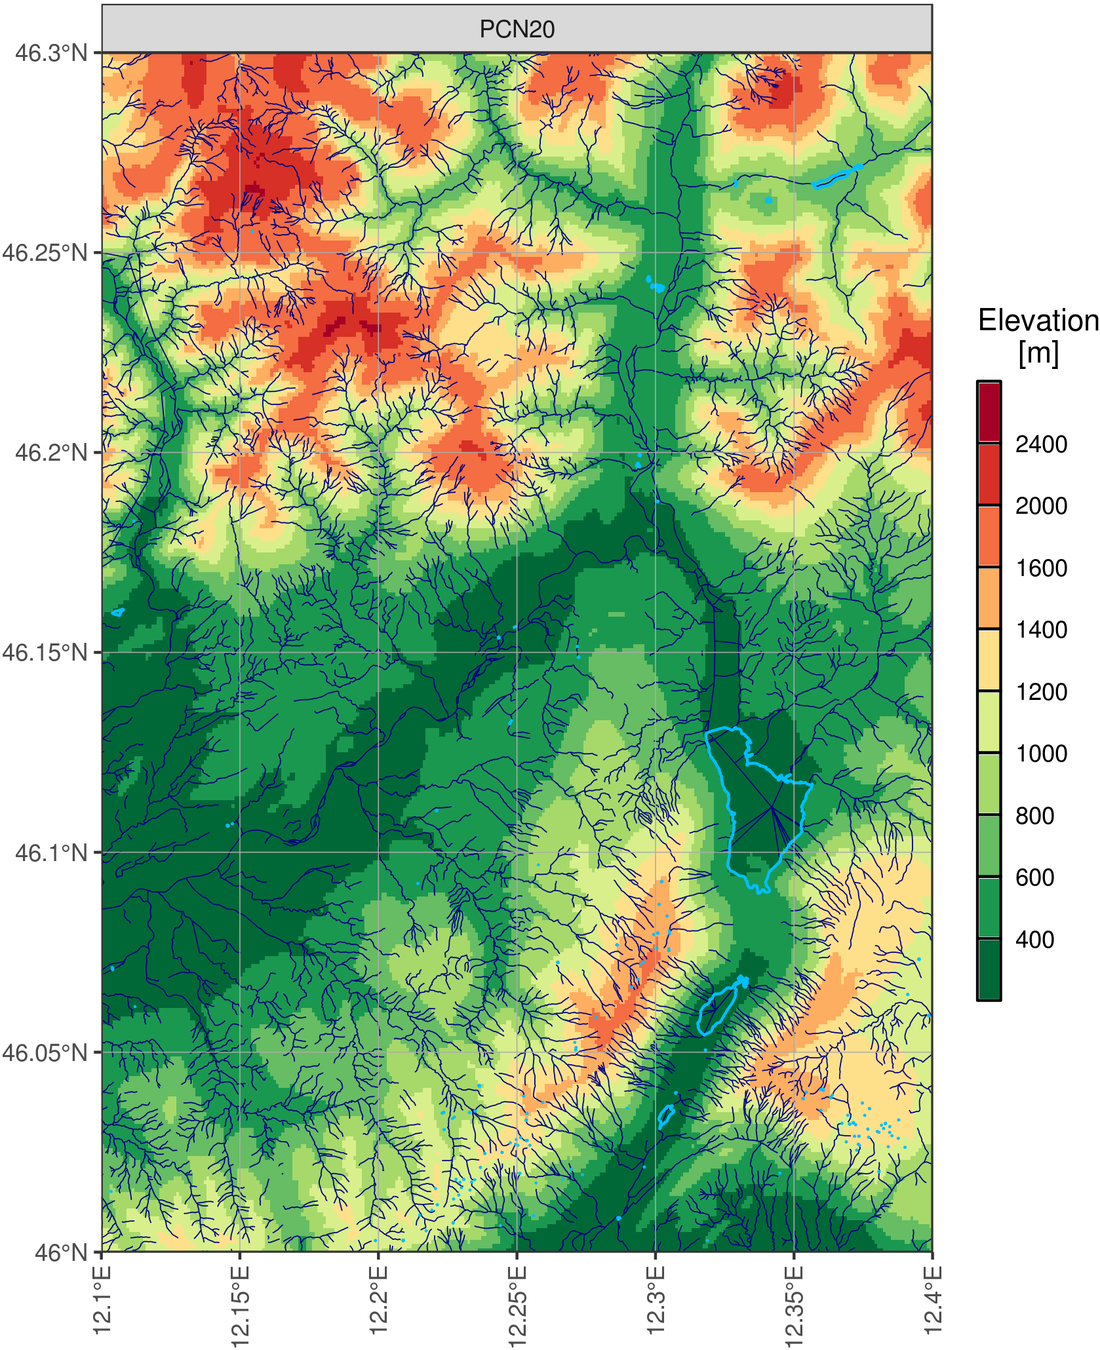
4.1 - Cetemps Hydrological Model
- 9 simulated domains
- Tested several Digital Elevation Models, chose HydroSHEDS
- Specific tuning for each region
- 300-900m resolution
- Argo and Marconi clusters
- 3000 runtime hours
- 100k core-hours
- ~35TB
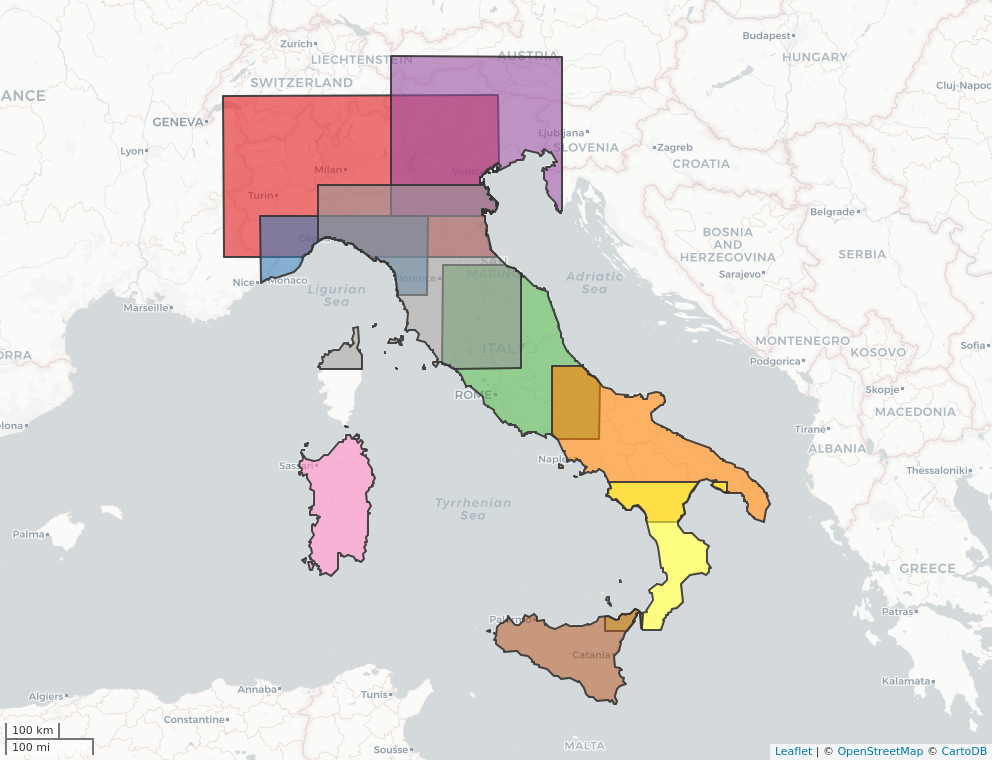
Three PR drivers:
- GRIPHO (MM5) 2001-2016
- RegCM-ERA 1980-2016
- RegCM-HAD 1972-2099
4.2 - Cetemps Hydrological Model
Does the model perform well?
Validation only possible against a few discharge stations:
- Average discharge
- Yearly maximum discharge
- Projected Q100 discharge
- Standard hydrological model metrics (NSE, KGE, correlation, index of agreement, ...)
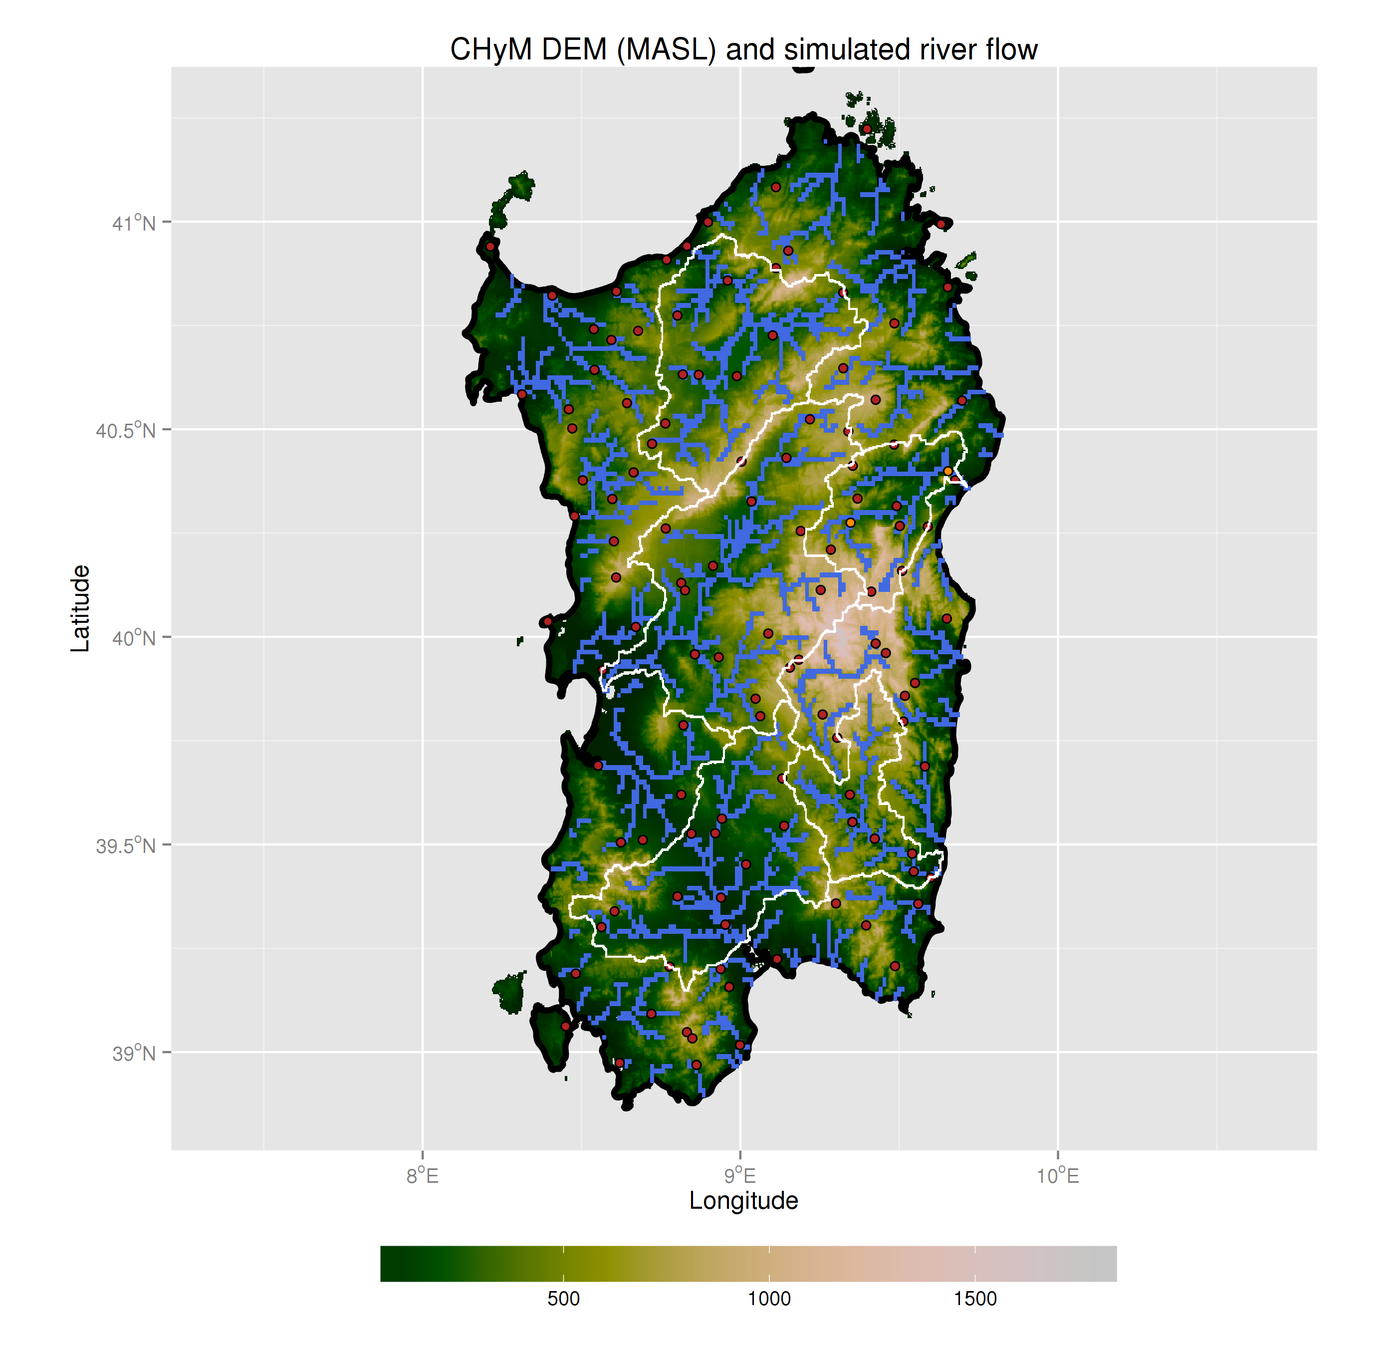
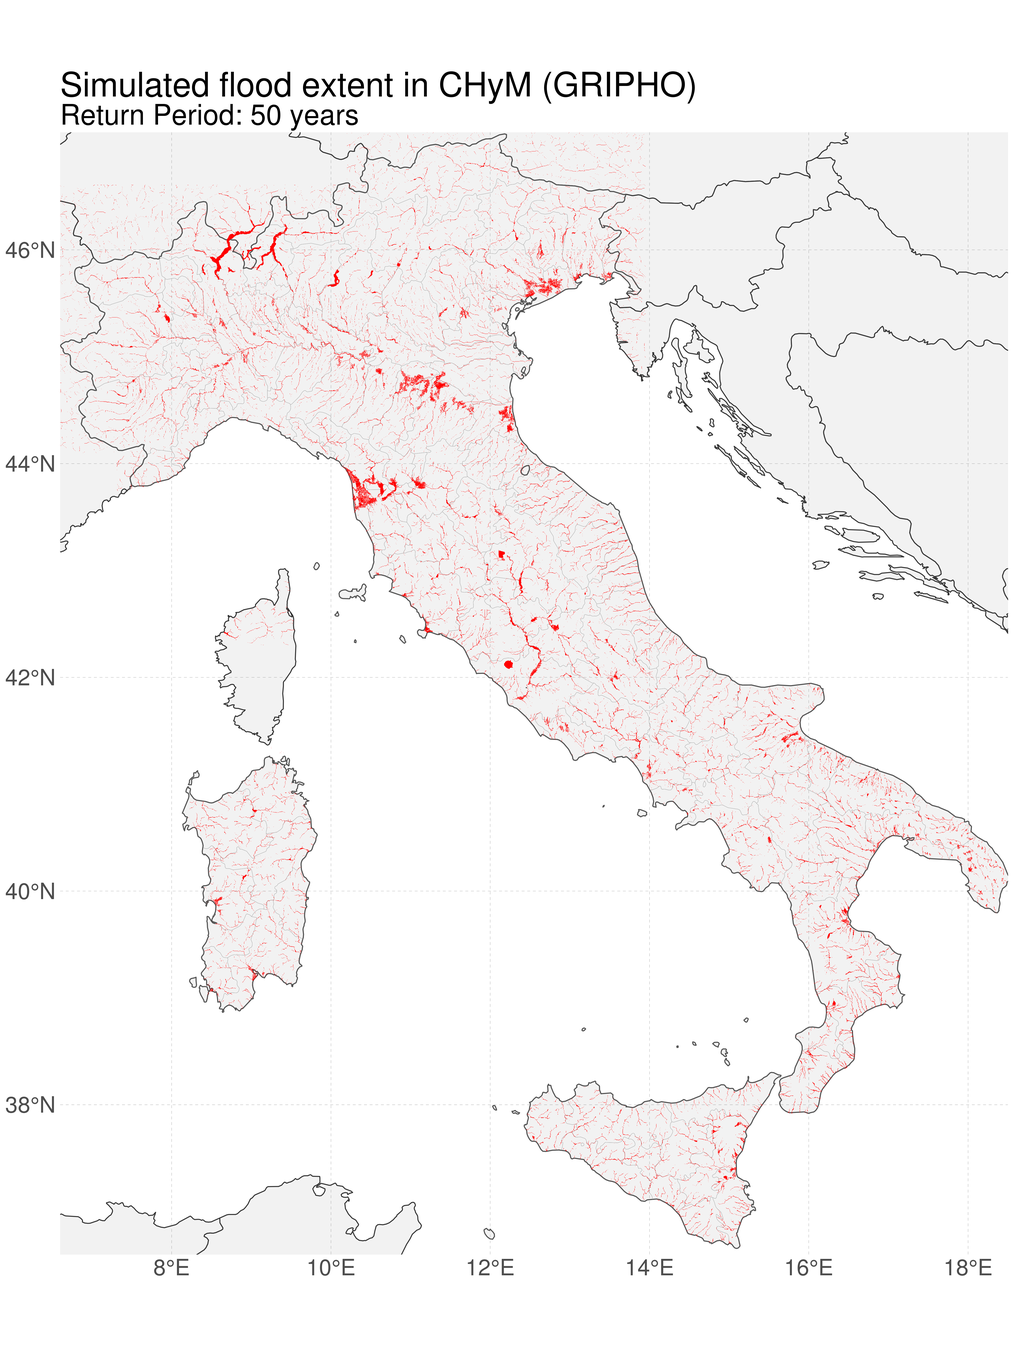
4.3 - Cetemps Hydrological Model
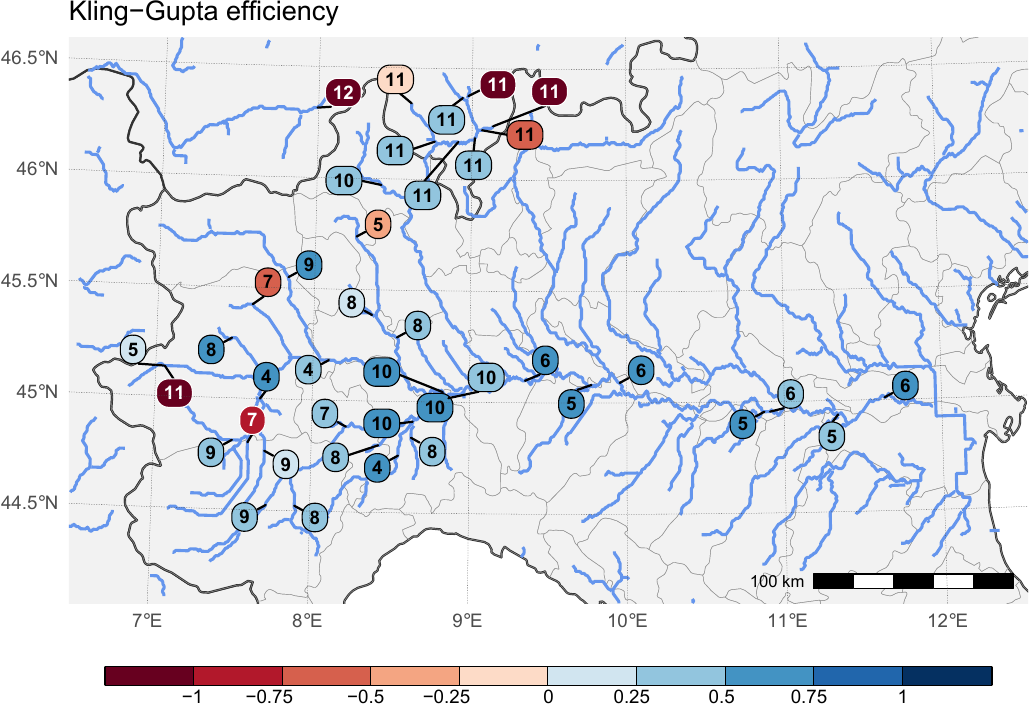
CHyM (GRIPHO)
4.4 - Cetemps Hydrological Model
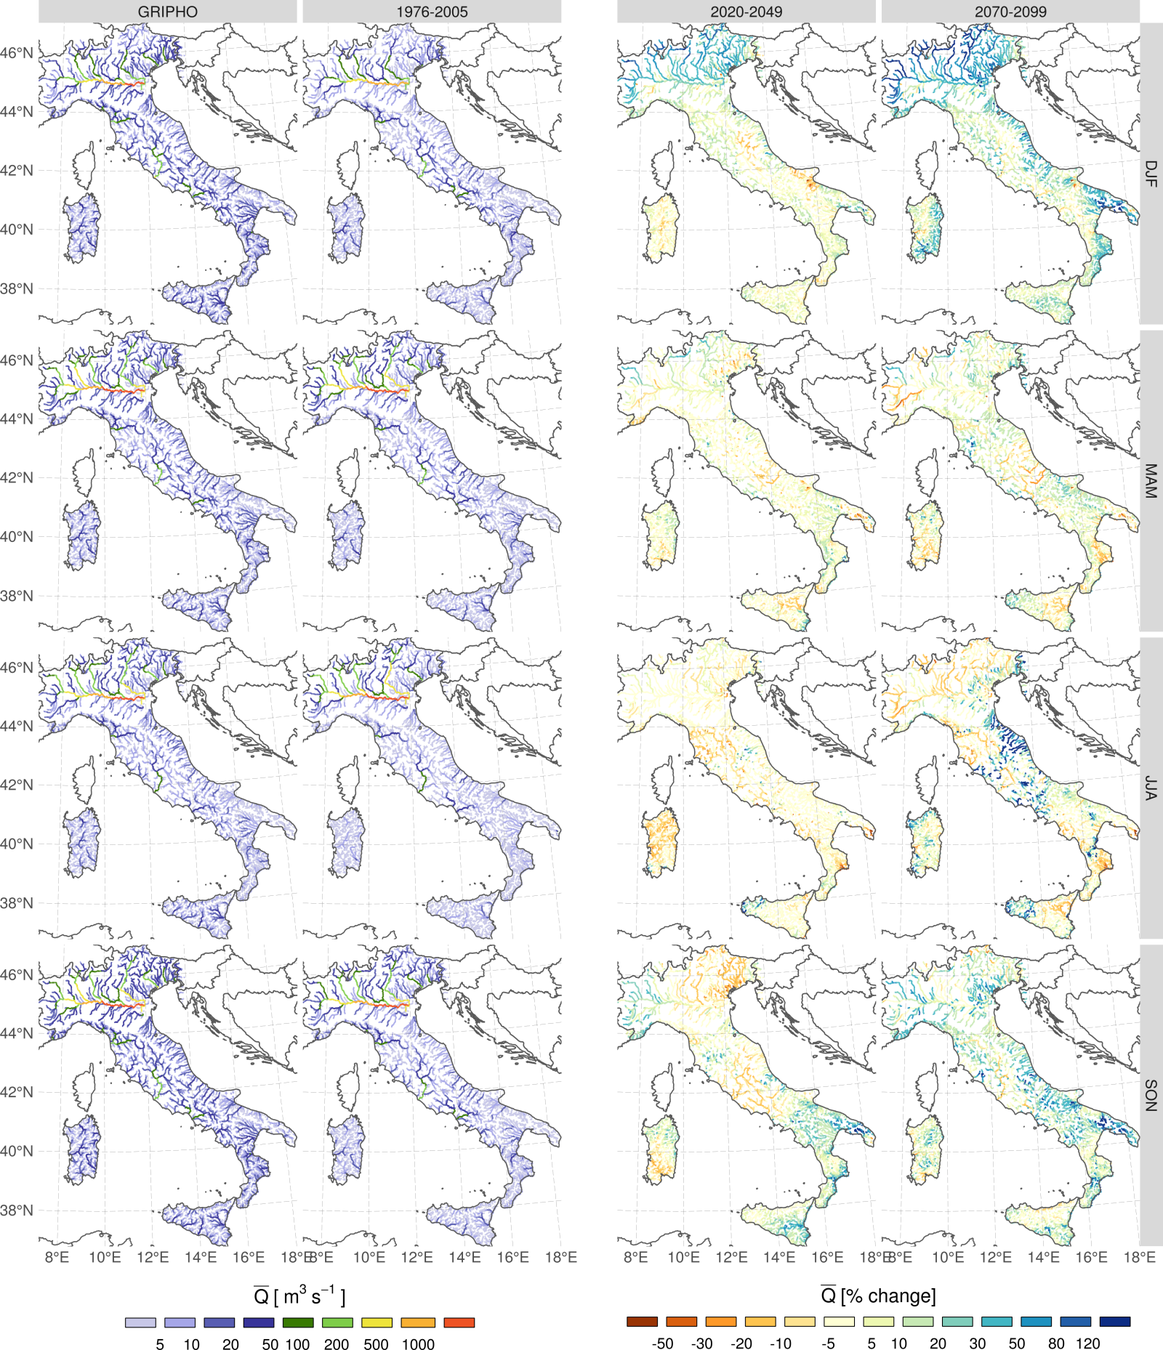
MEAN DISCHARGE
MEAN DISCHARGE CHANGE
MEAN PRECIP CHANGE
4.5 - Cetemps Hydrological Model
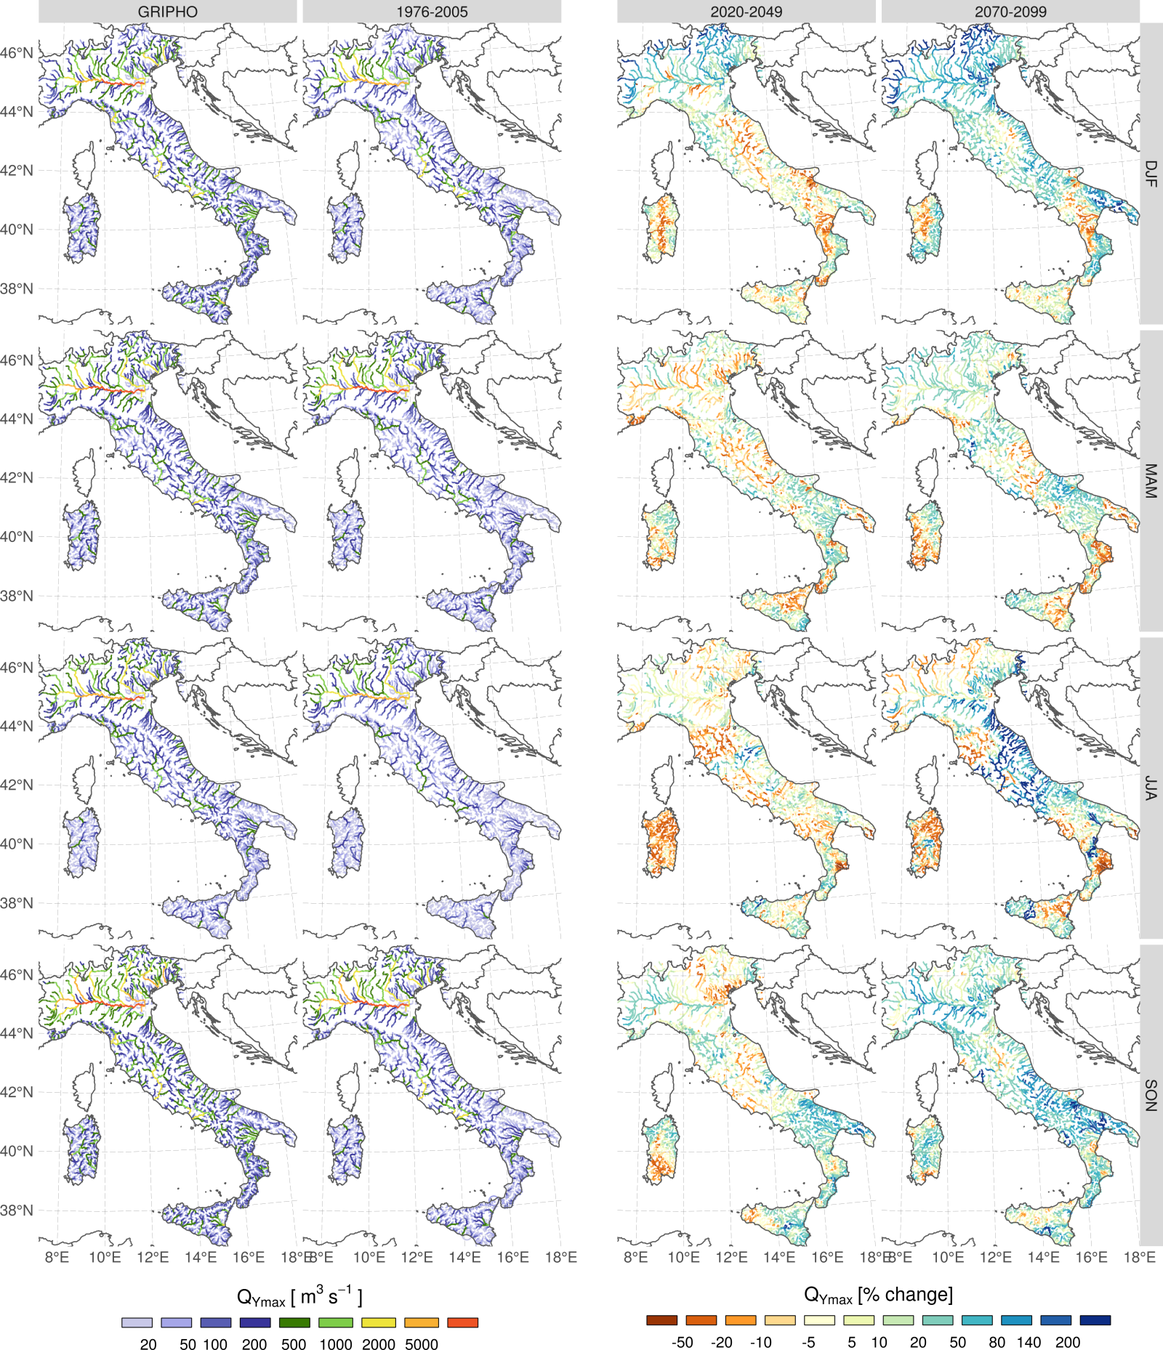
MEAN ANNUAL MAXIMUM DISCHARGE
Qymax DISCHARGE CHANGE
R95ptot PRECIP CHANGE
4.6 - Cetemps Hydrological Model
CHyM Conclusions
- Model discharges in line with observations, for the few available stations
- Average discharge projected to slightly increase in the north; mixed changes elsewhere
- Extreme discharges projected to strongly increase by the end of the century (often >1.5x)
- Extreme discharge changes (Q100) do not match extreme precipitation changes hydrological model adds useful information!
4.x - Cetemps Hydrological Model
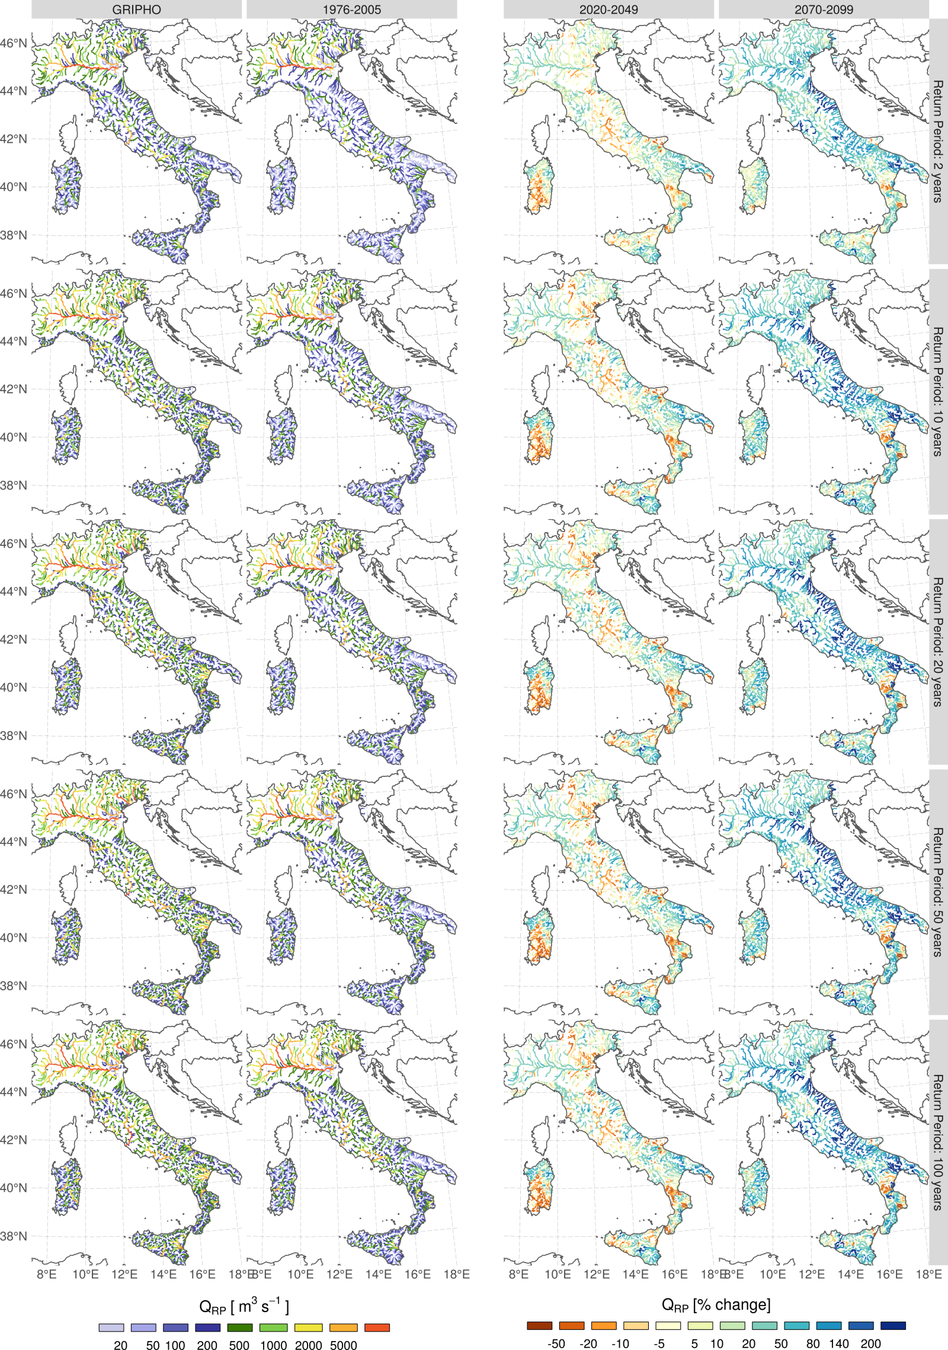
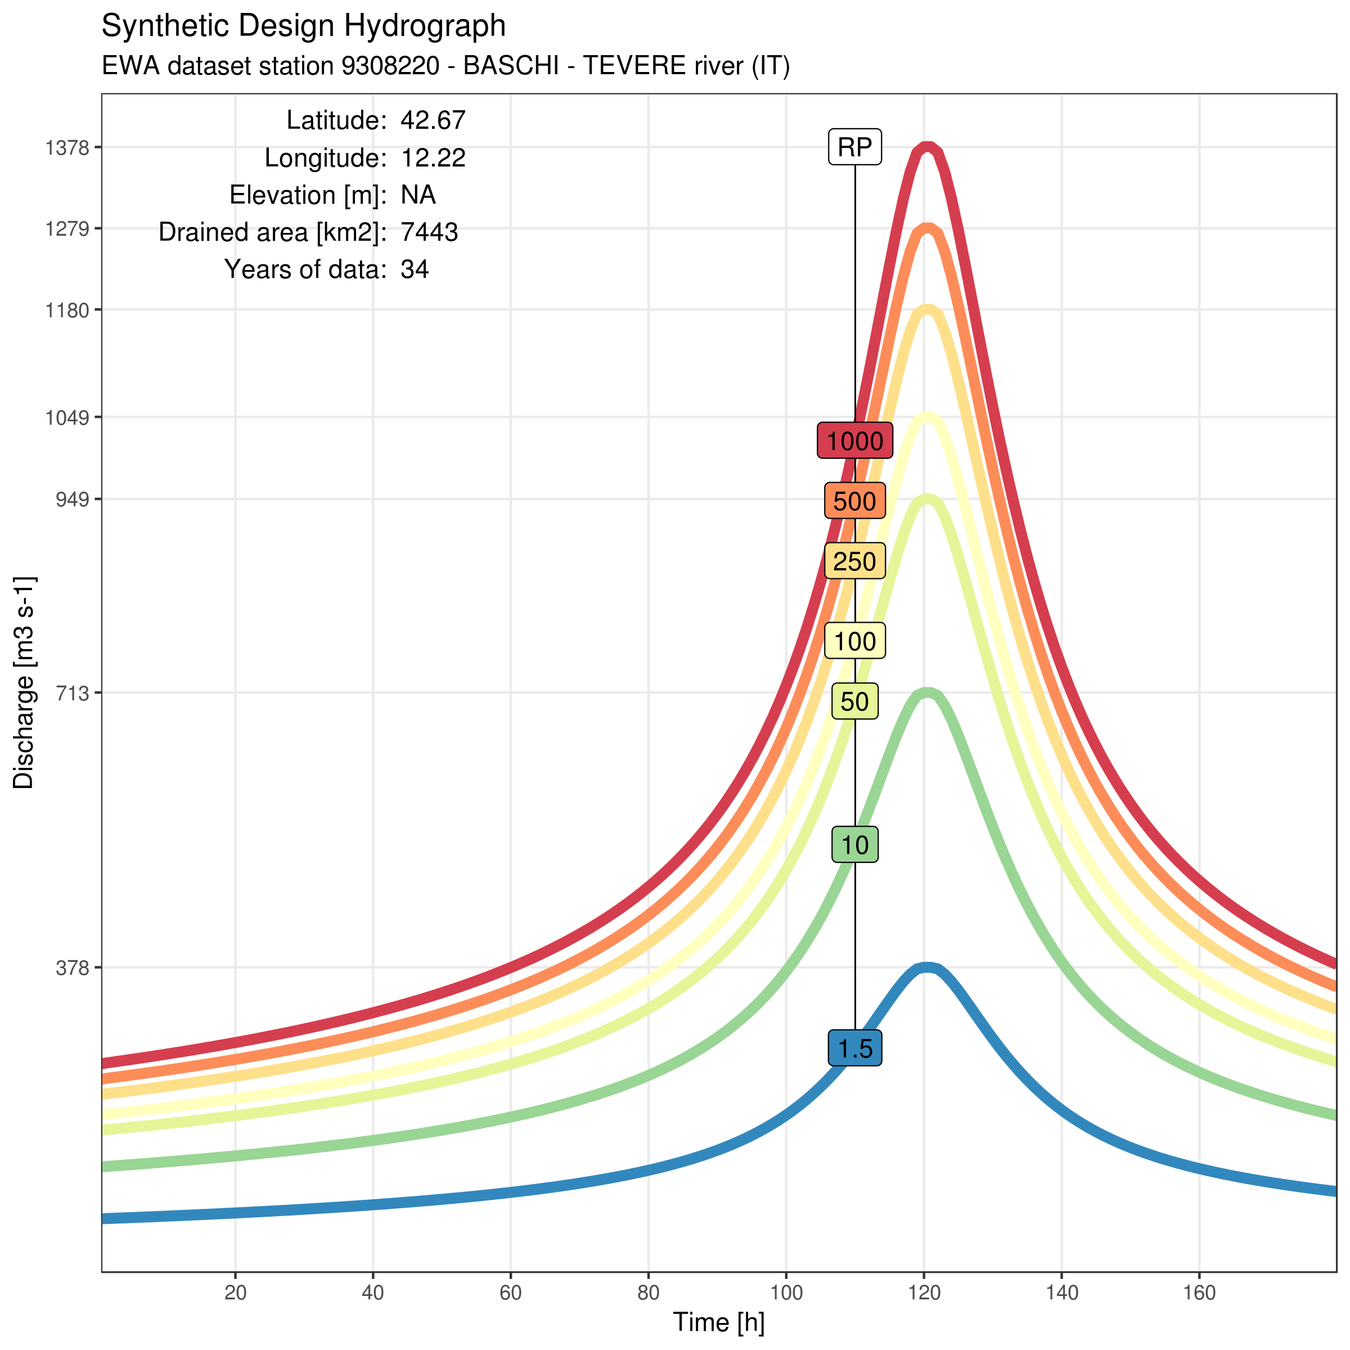
Q100: 100 YEAR ESTIMATED DISCHARGE
GRIPHO
HadGEM
present
HadGEM
2020-2049
HadGEM
2070-2099
100-year discharges estimated following:
Maione et al., 2003: Regional estimation of synthetic design hydrographs
Thanks to Francesca Raffaele for the research work!
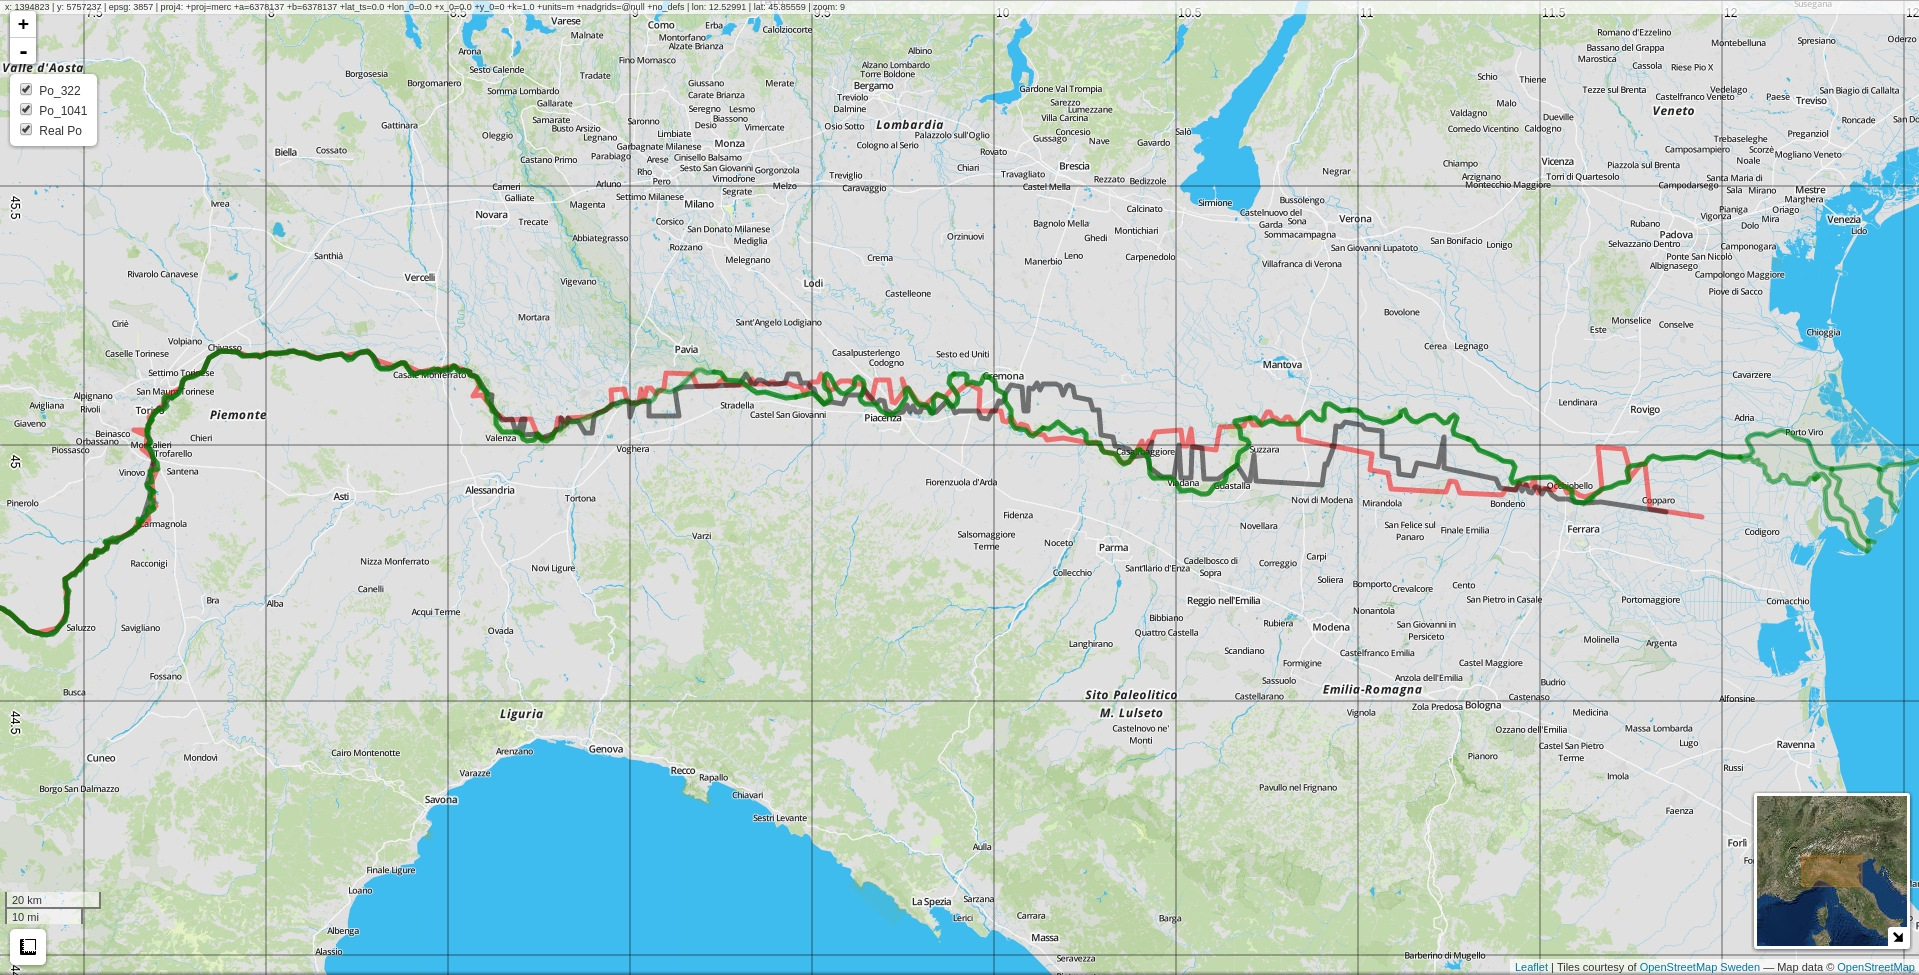
4.x - Cetemps Hydrological Model
96 river network reconstruction tests for each region
(manual and automatic, with distance measures)
4.x - Cetemps Hydrological Model
CHyM-OP reproduced domains:
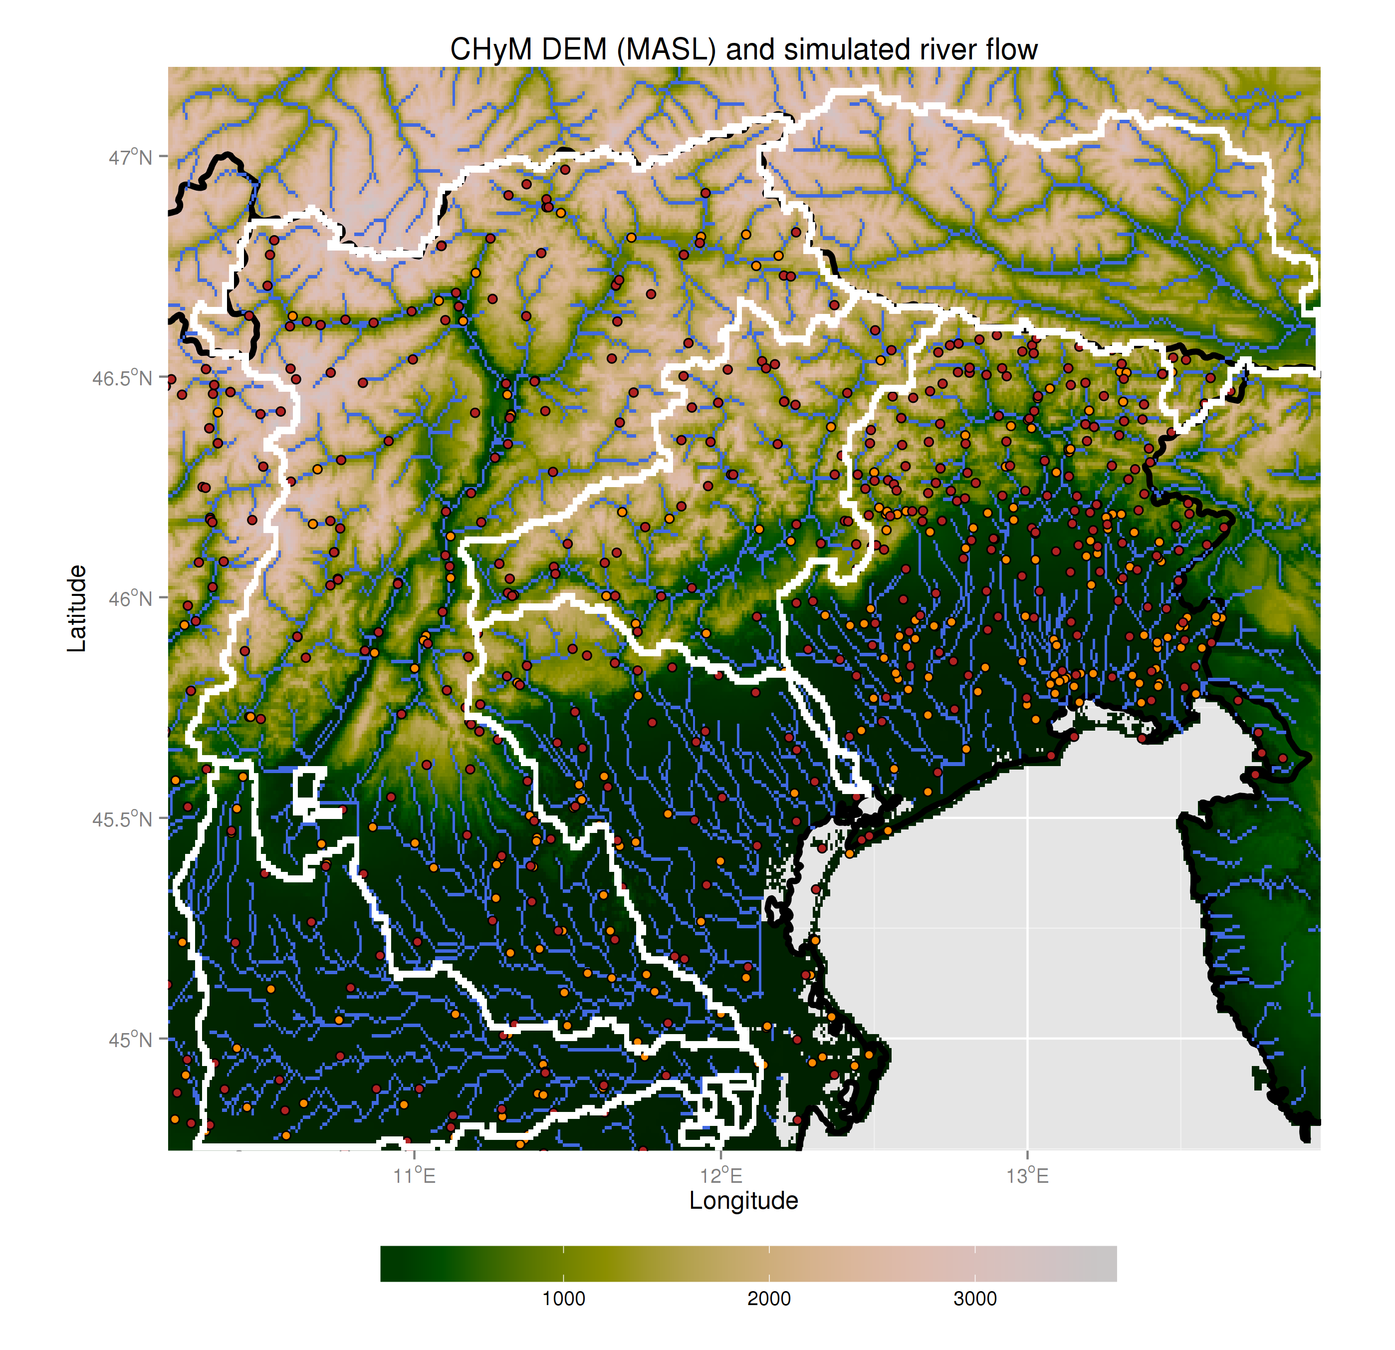
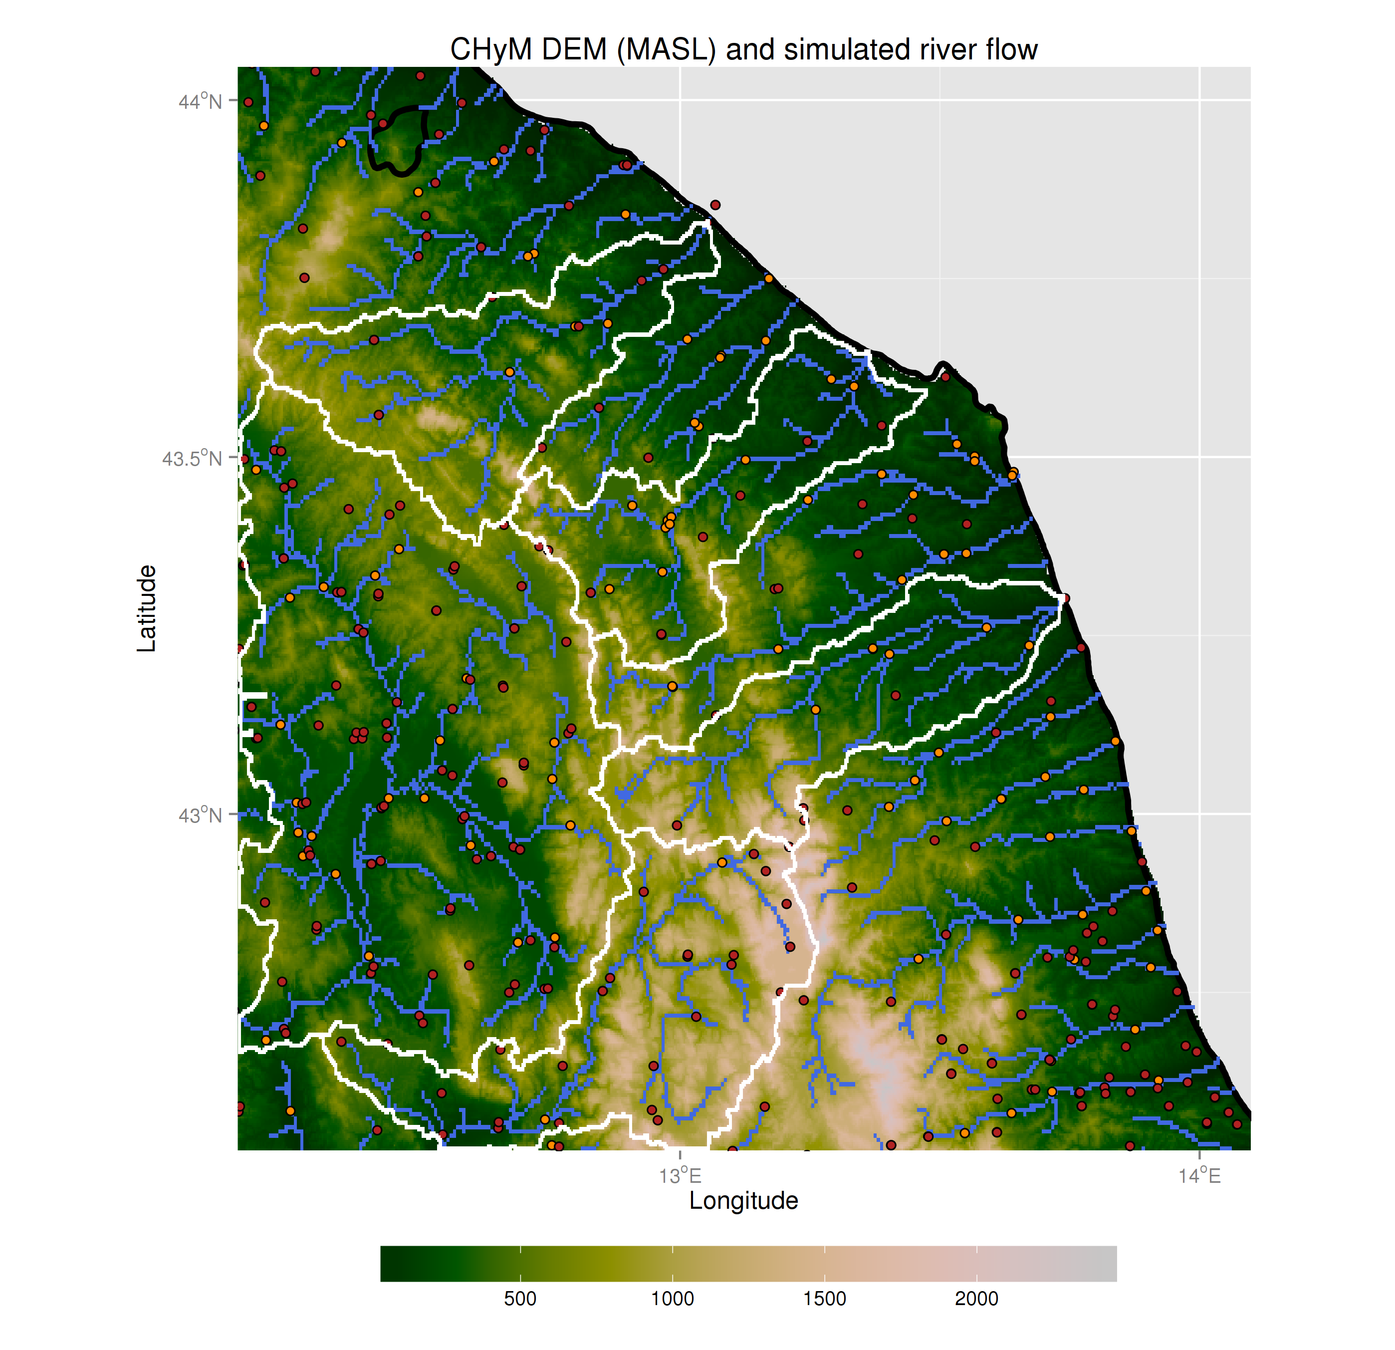
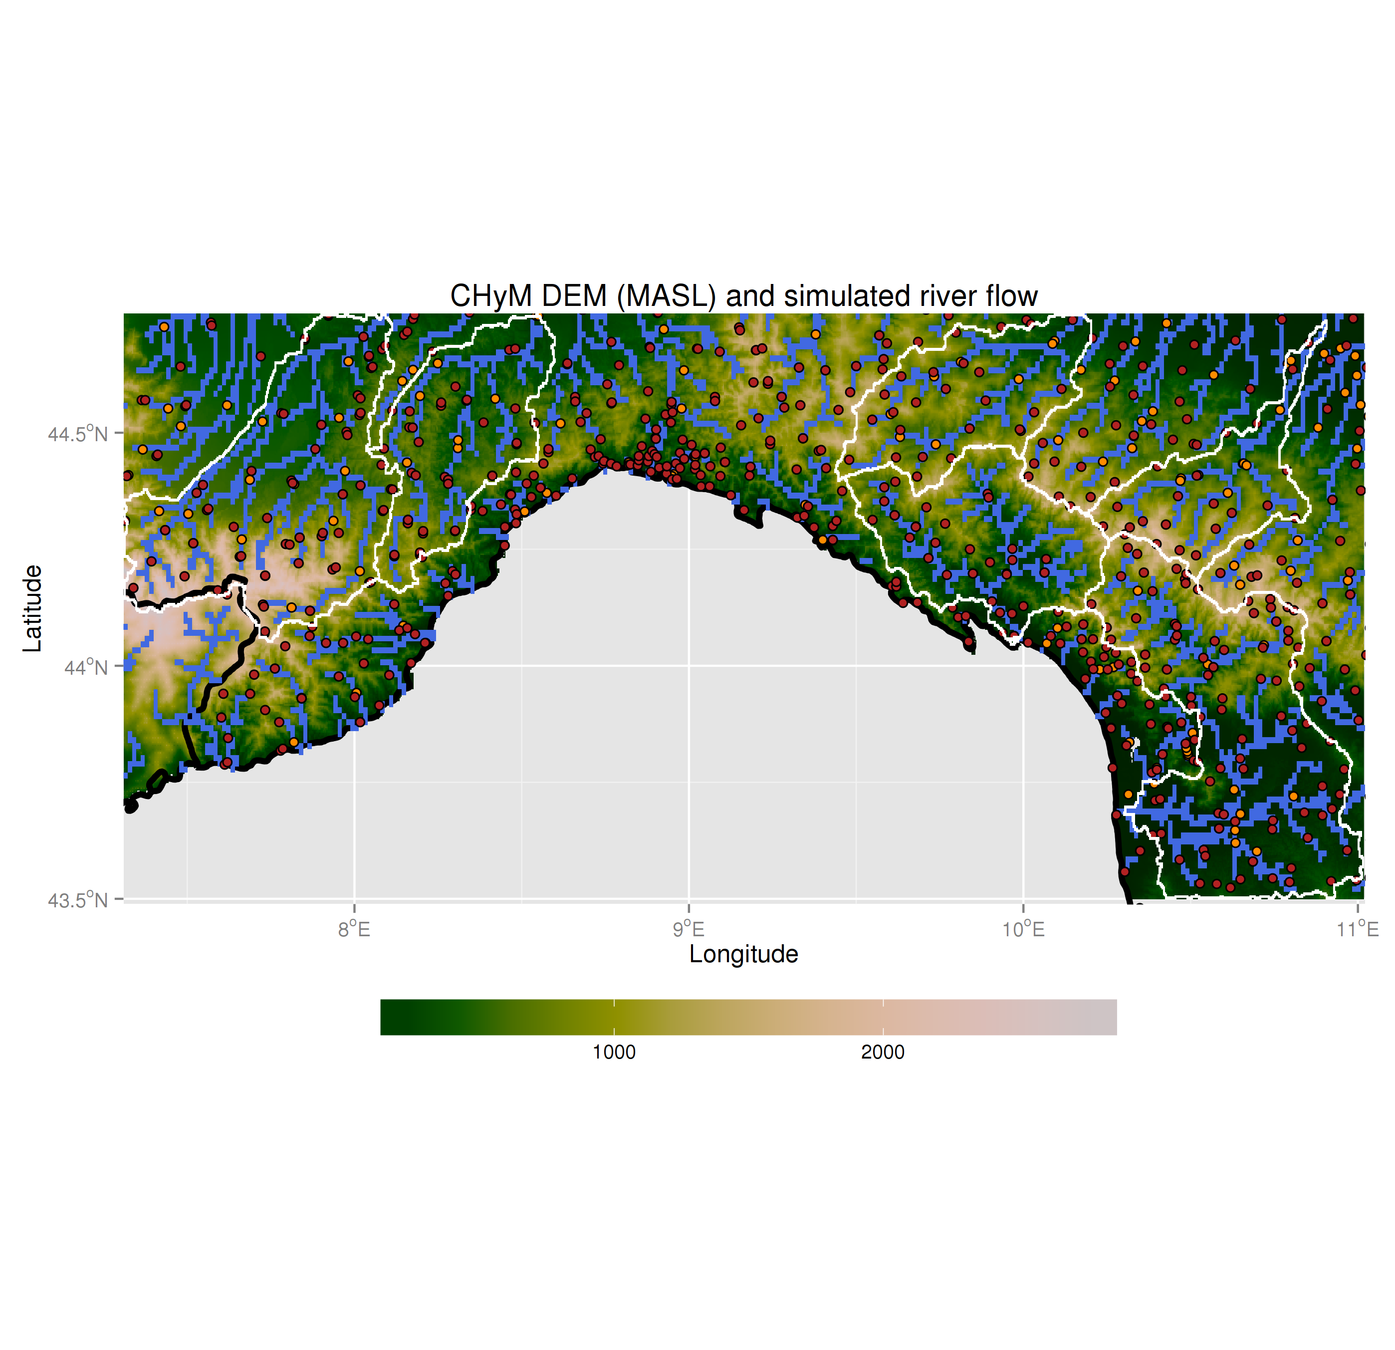
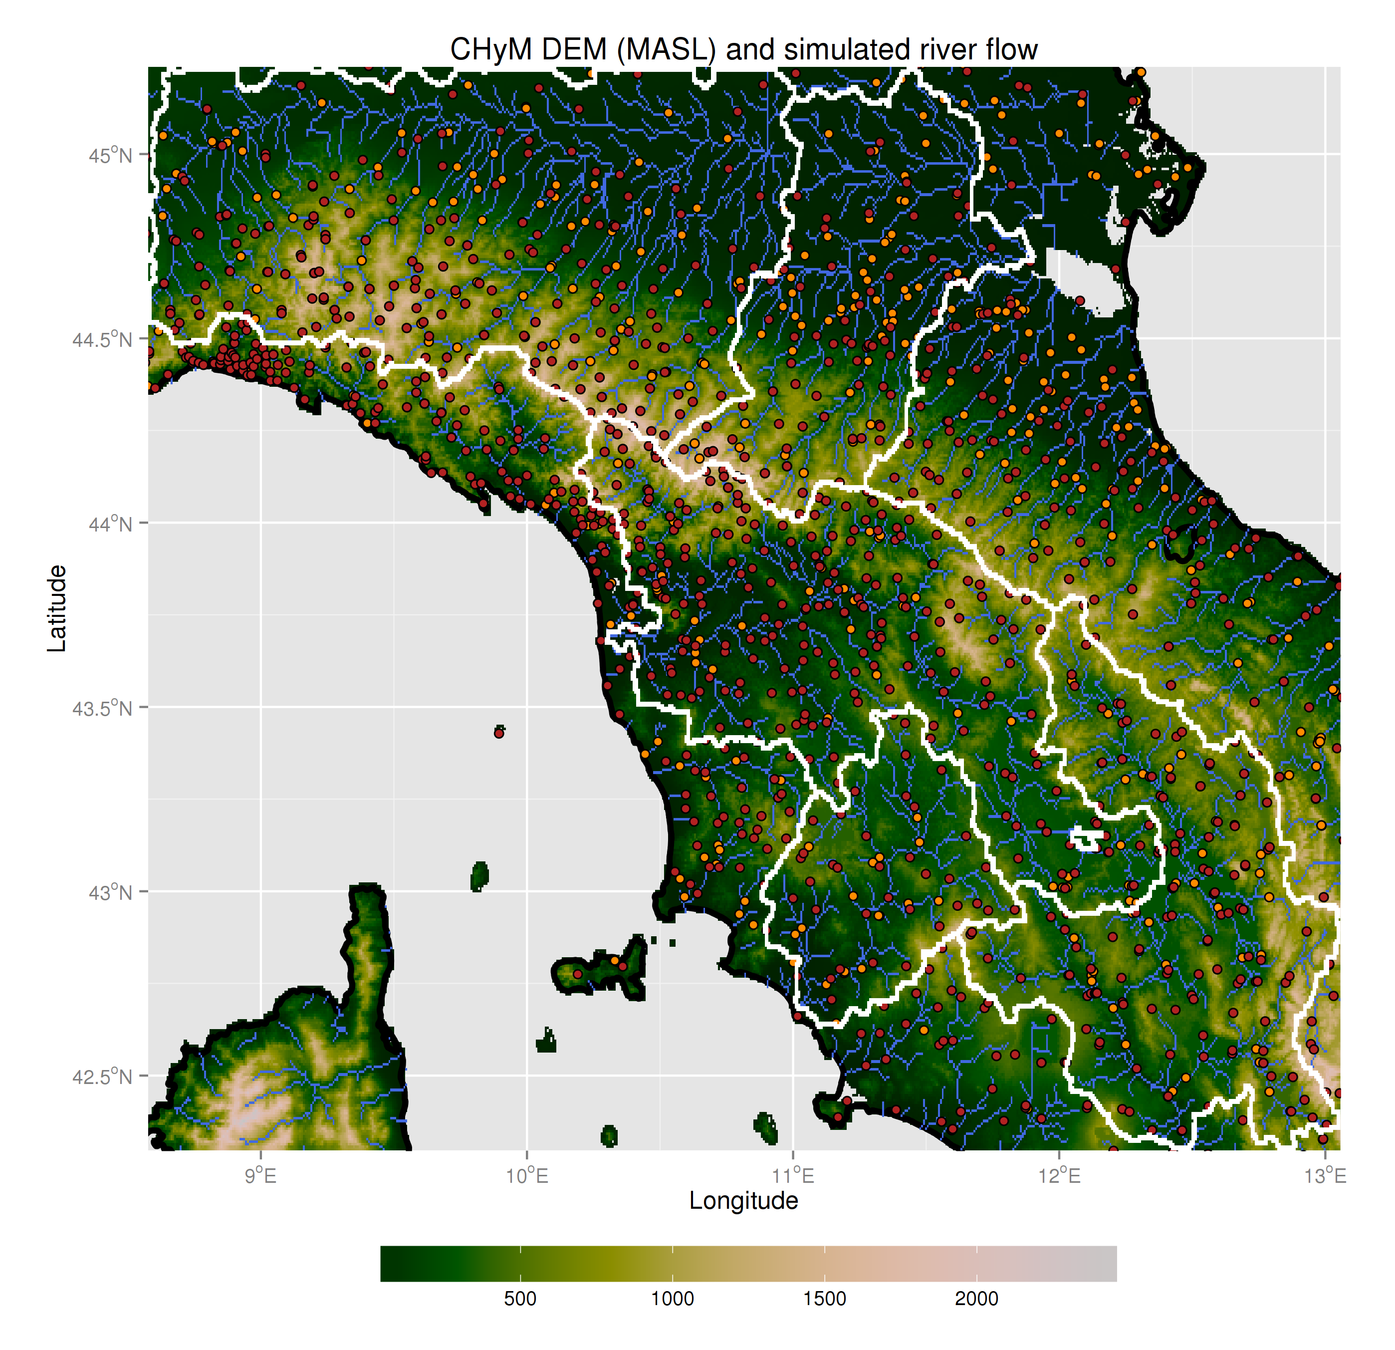
4.x - Cetemps Hydrological Model
CHyM-OP reproduced domains:
4.x - Cetemps Hydrological Model
4.x - Cetemps Hydrological Model
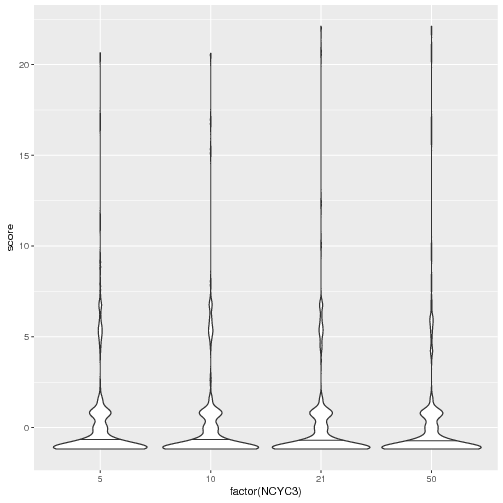
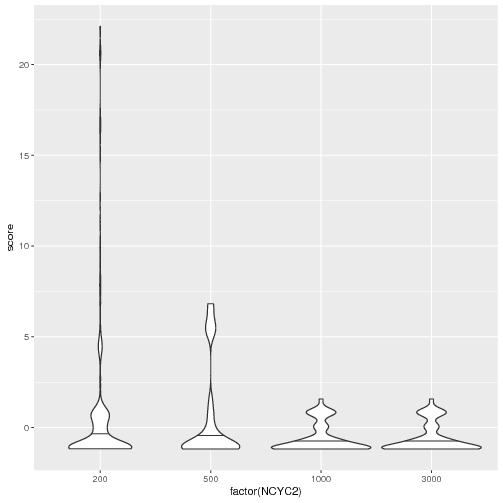
So far:
- Performed ~2000 model simulations to find the best configuration for the river network reconstruction
- Identify and compare the reconstruction of the Po river with different metrics: mean distance, basin area, distance Q95...
4.x - Cetemps Hydrological Model
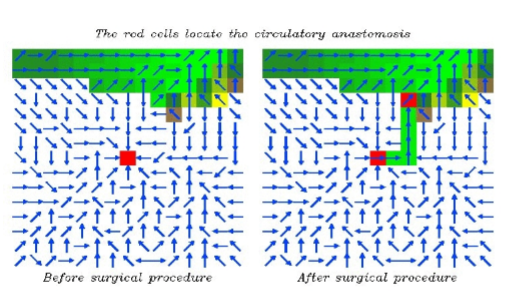
5.0 - CA2D hydraulic model
2D flood inundation model from Dottori and Todini, 2010, 2011, modified by Rita Nogherotto to run in parallel
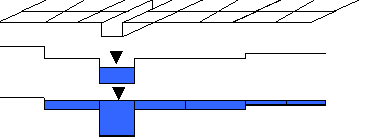
- DEM
- River network
- SDH
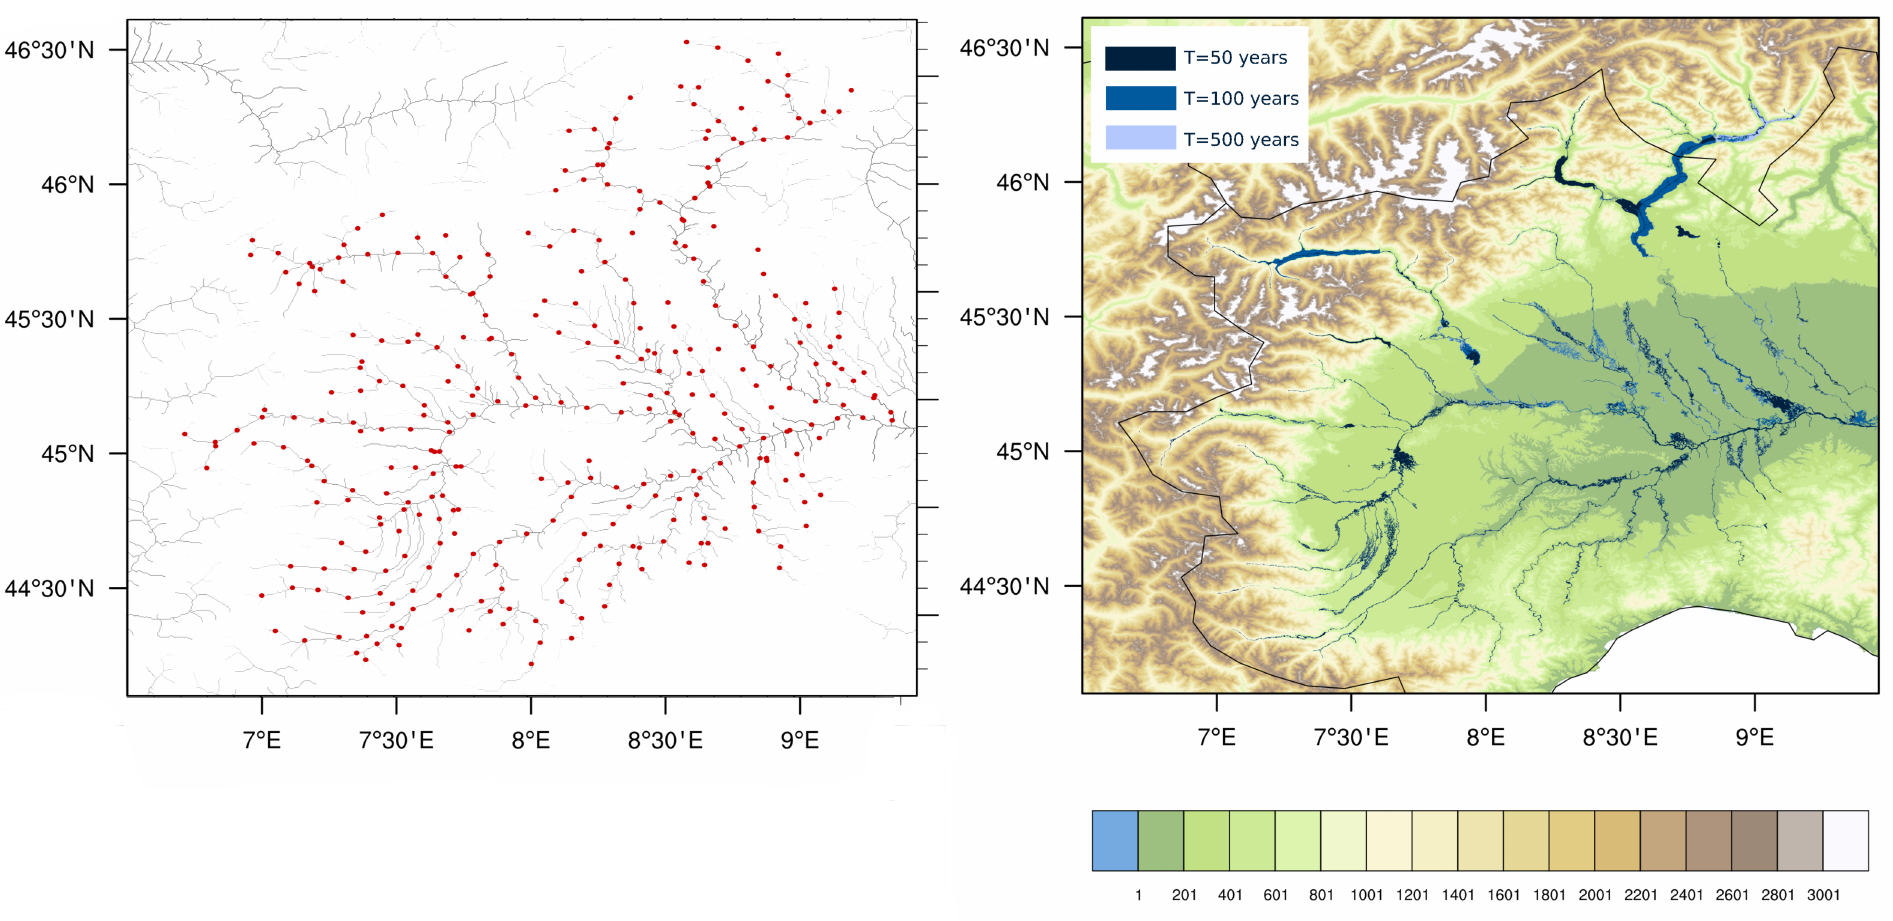
5.1 - CA2D hydraulic model
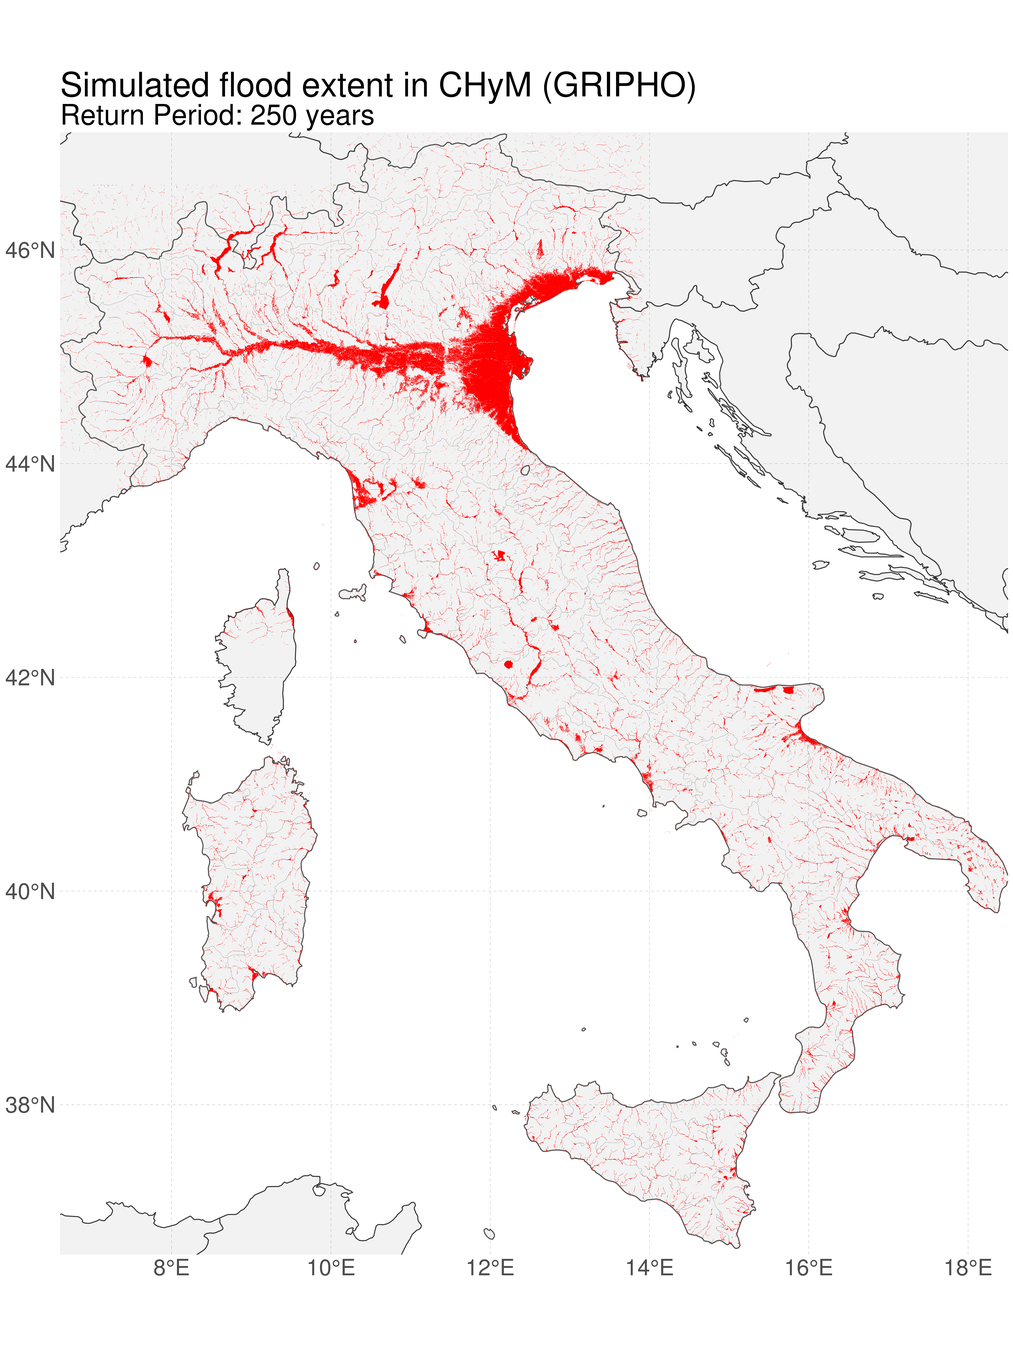
- 90m resolution
- HydroSHEDS DEM and river channels
- Still ongoing, currently completed only for CHyM (GRIPHO)
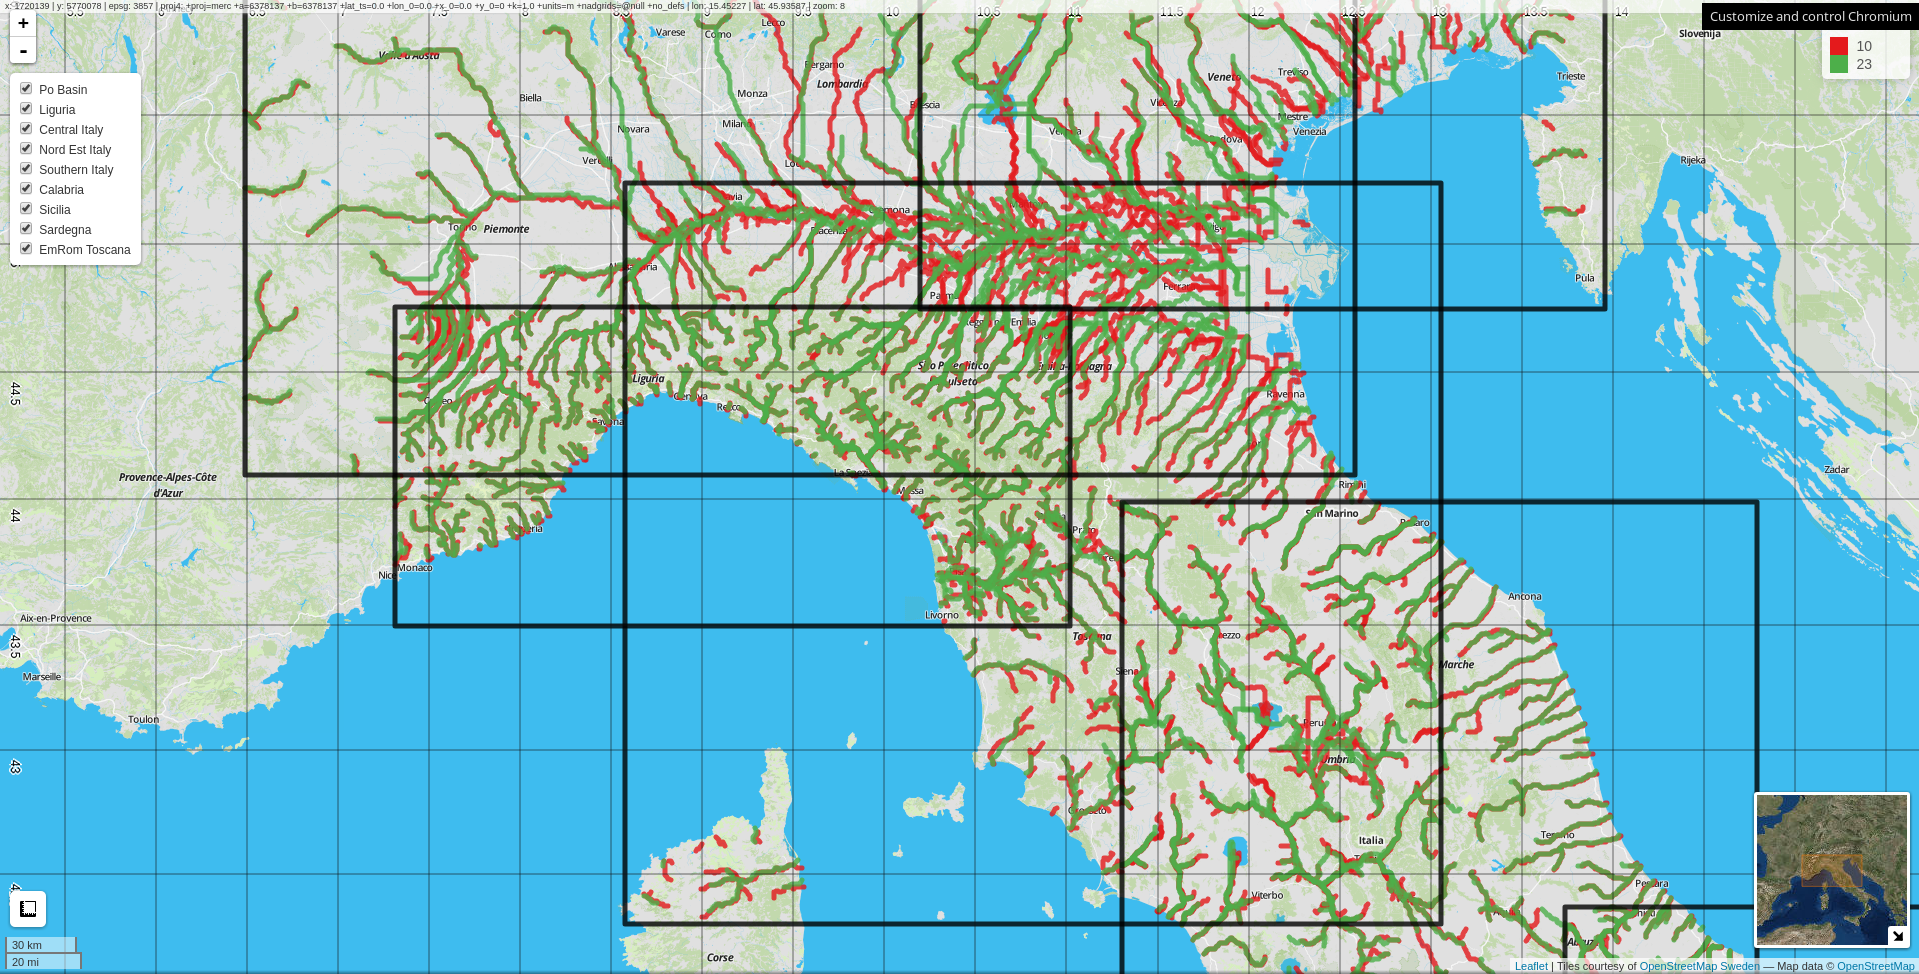
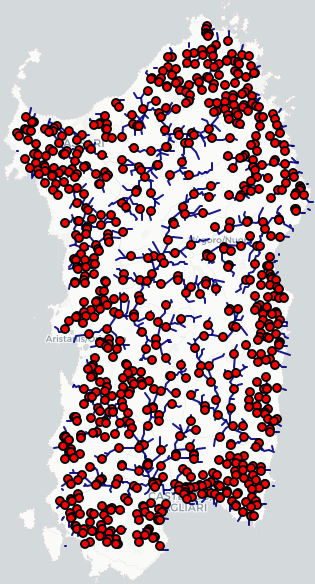
- 5528 "virtual stations" cover all rivers every 5-10km
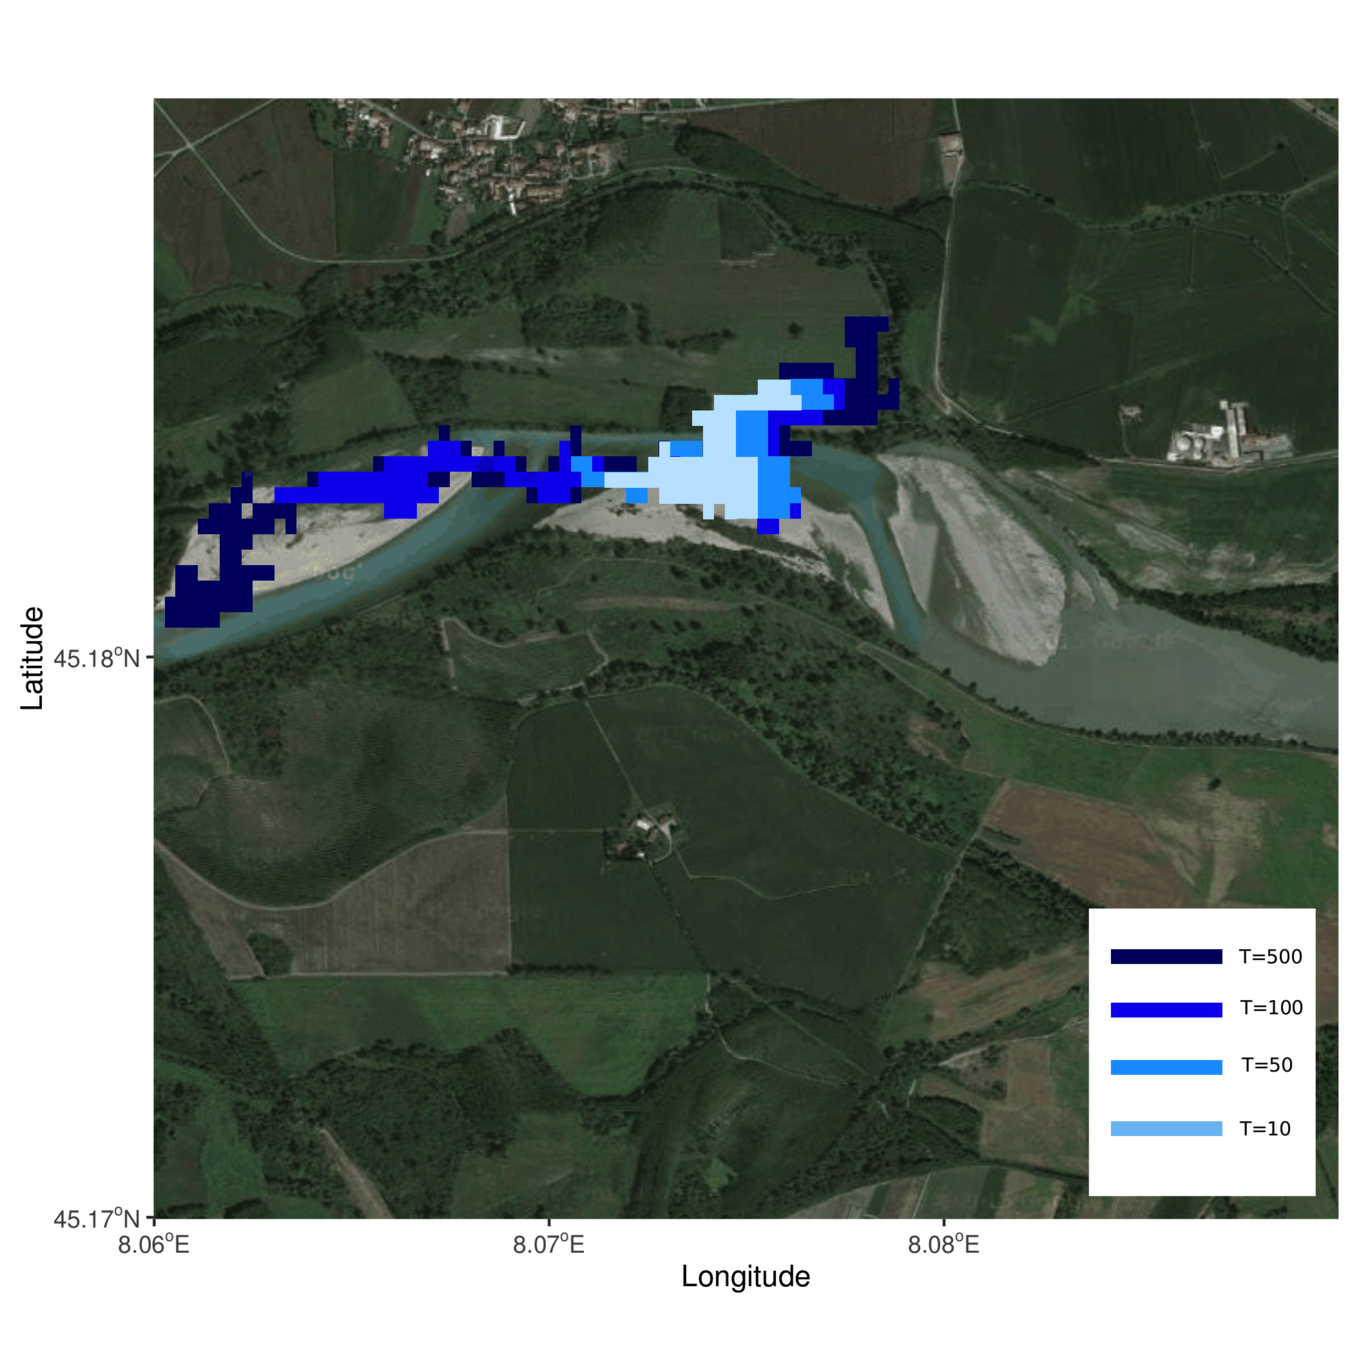
- Two case studies in North-Western Italy
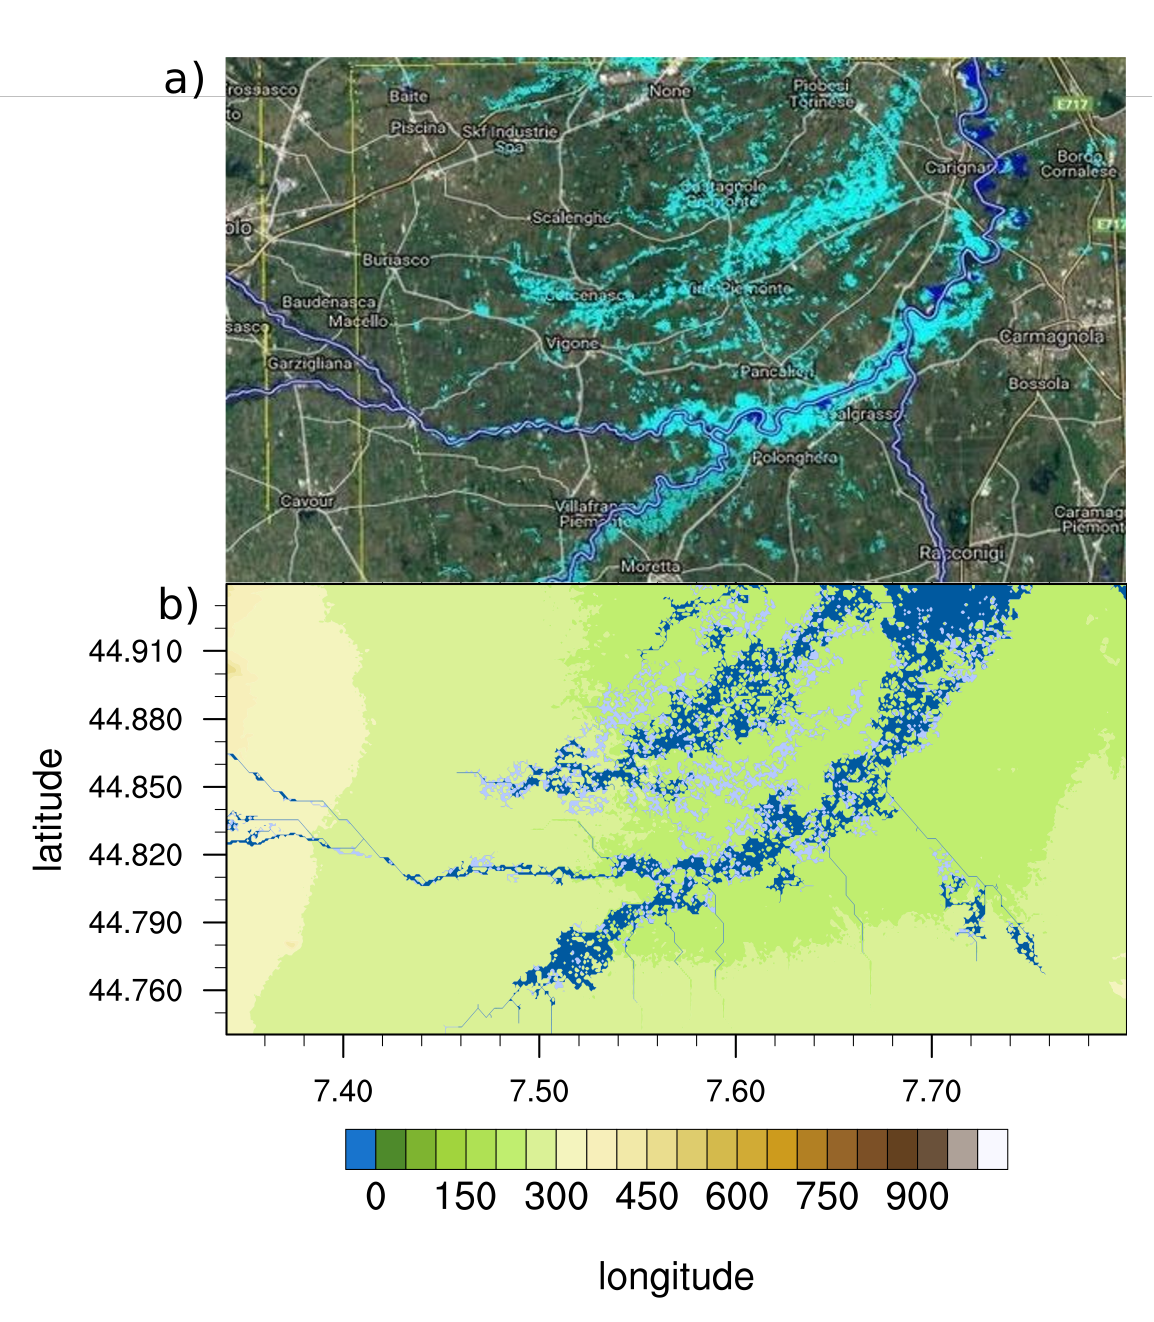

Satellite images from COSMO-SkyMed, November 2016 event
COSMO
CA2D
5.2 - CA2D hydraulic model
RP = ~200yr
Po river basin
5.3 - CA2D hydraulic model
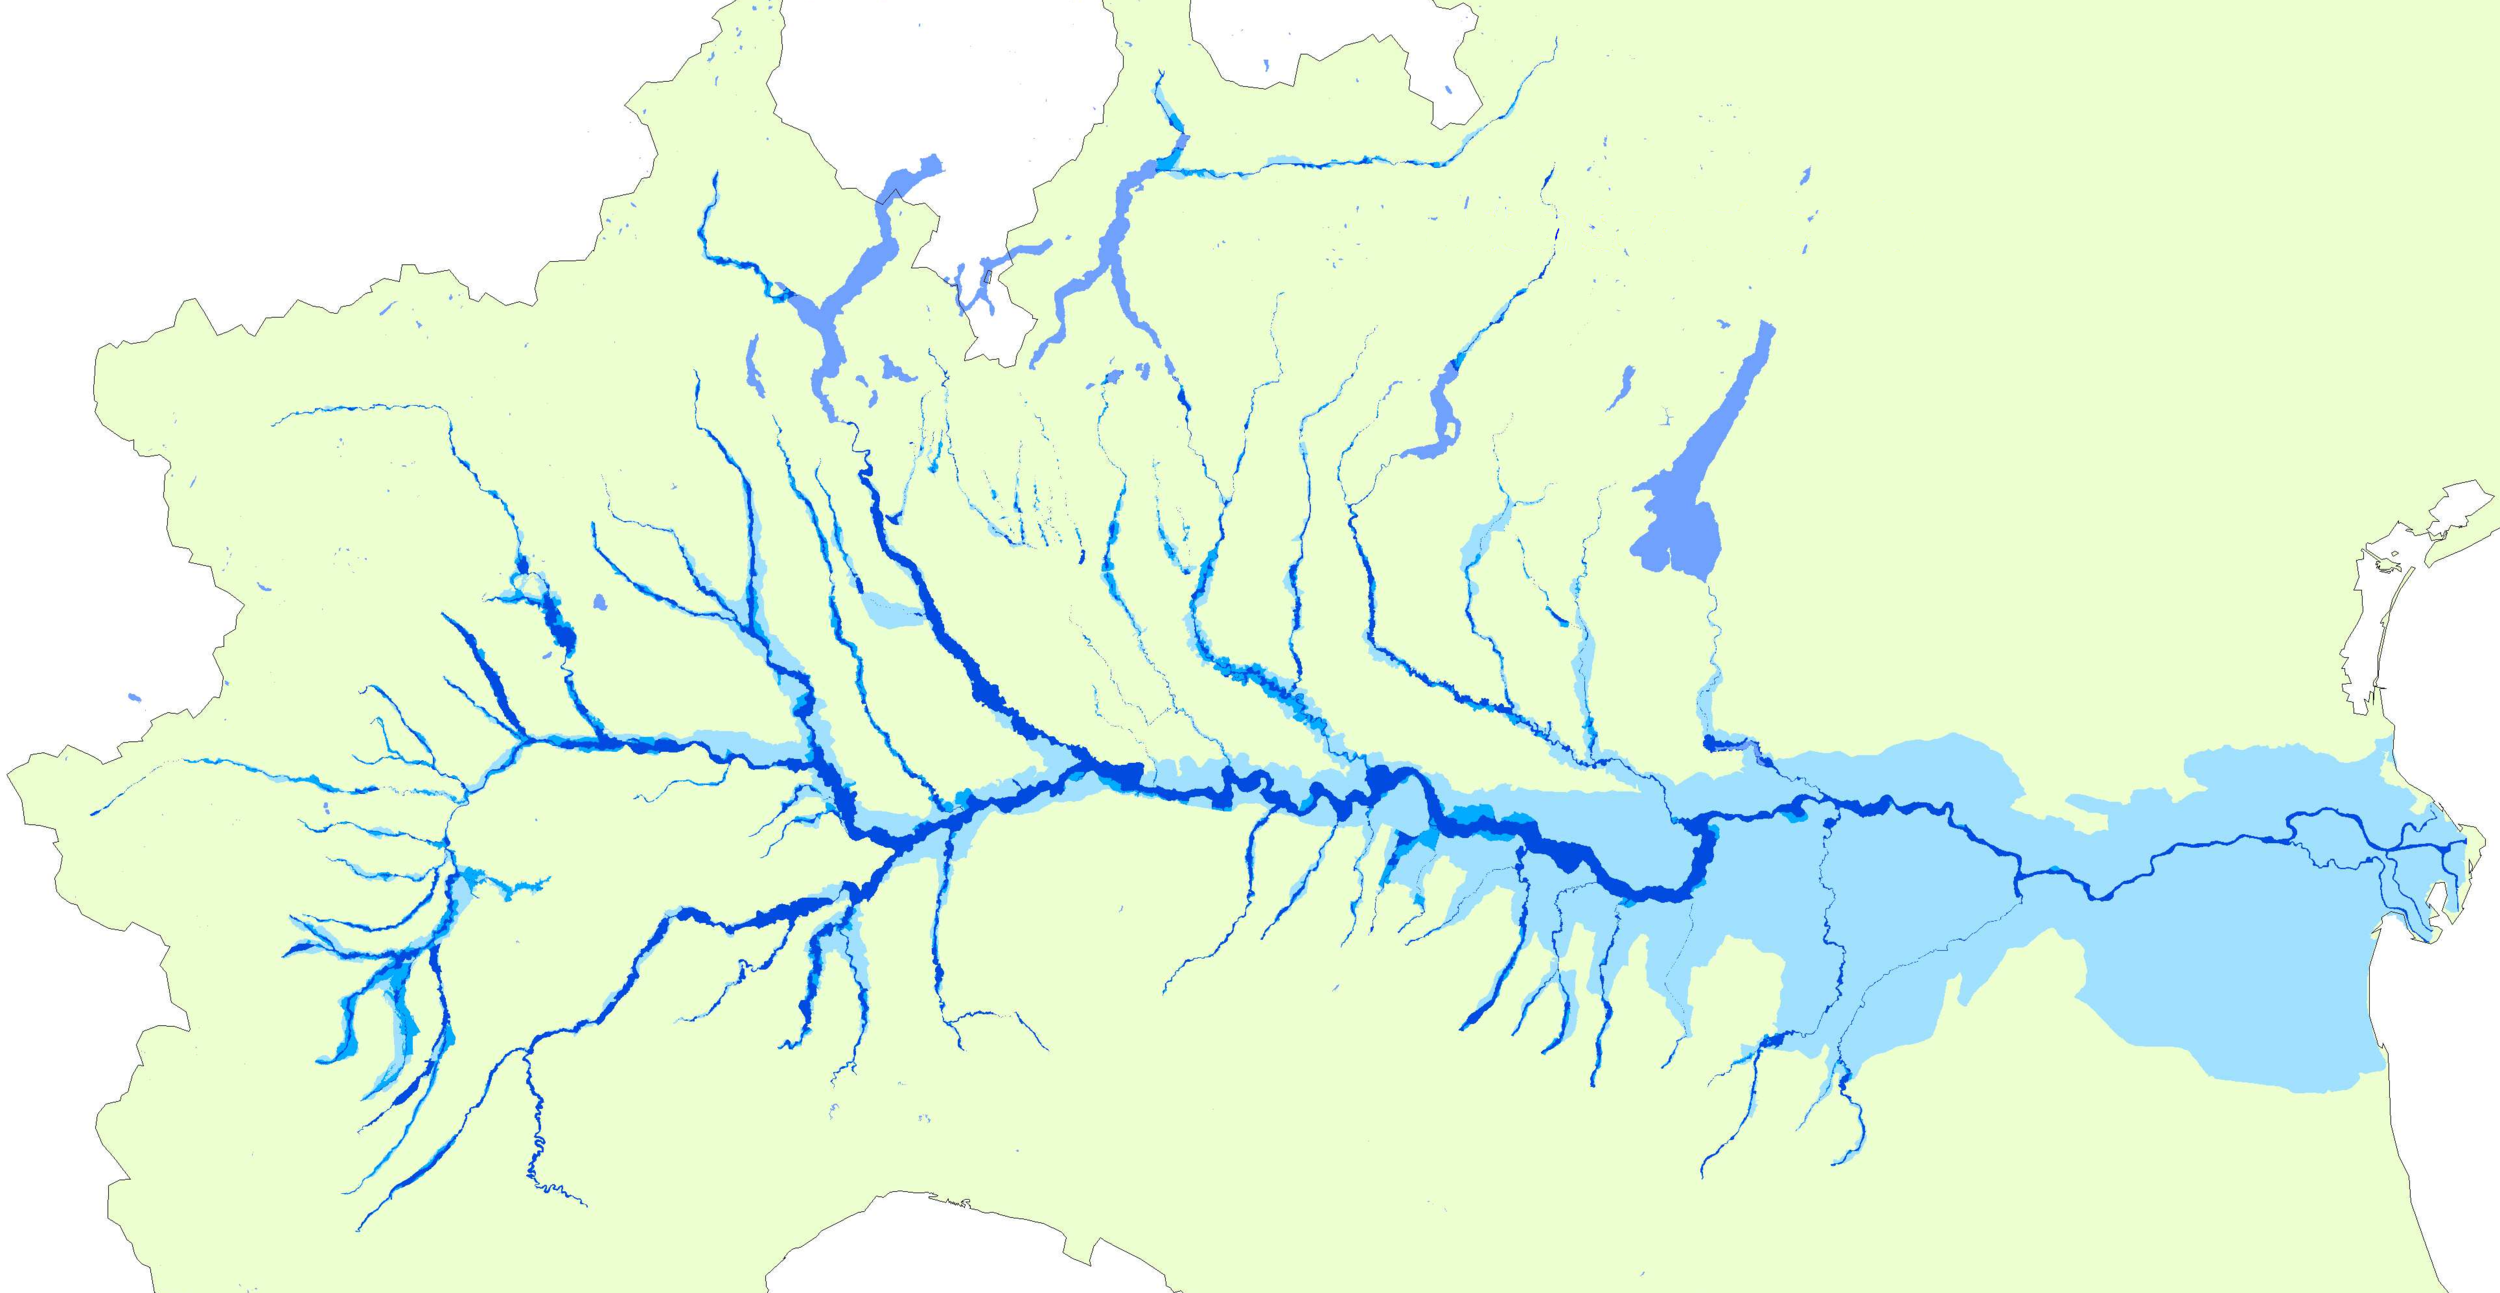
AdBPo
GRIPHO/ CHYM / CA2D
ISPRA
5.4 - CA2D hydraulic model
Nogherotto R., Fantini A., Raffaele F., Coppola E. and Giorgi F.:
´An integrated hydrological and hydraulic modelling approach for the flood risk assessment over Po river basin: a case study for the ALLIANZ Insurance Company´ (in preparation)
CA2D Conclusions
- Encouraging initial results
- Good results in the case study
- General agreement with ISPRA maps
Issues:
- Ignoring coastal flooding, dams and water management
- Lack of data available for validation
- Future flood hazard not yet computed
5.x - CA2D hydraulic model
5.x - CA2D hydraulic model
"Virtual stations"
6.0 - Summary
New data:
- New state of the art GRIPHO precipitation dataset
- Two new RCM EURO-CORDEX simulations
- Three new high resolution CHyM hydrological simulations
Ongoing work and future improvements:
- Complete and analyse all the CA2D simulations, projections
- Perform ensemble analysis to assess uncertainty
Flood hazard:
- We can produce flood hazard maps via a model chain
- Much higher resolution than previous studies
- Scientific, reproducible result
- The methodology can be applied anywhere
- Continent-scale studies are possible
- Strong projected increase in extreme pr and flood proxies
6.1 - Research... answers
1. Can a model chain of climate, hydrological and hydraulic models reproduce flood hazard?
Yes, it can!
2. How does climate change impact flood hazard over Italy?
Increase in all flood proxies, sometimes > 150%
3. What is the link between changes in precipitation extremes and changes in flood hazard?
The two are often linked, but not always!
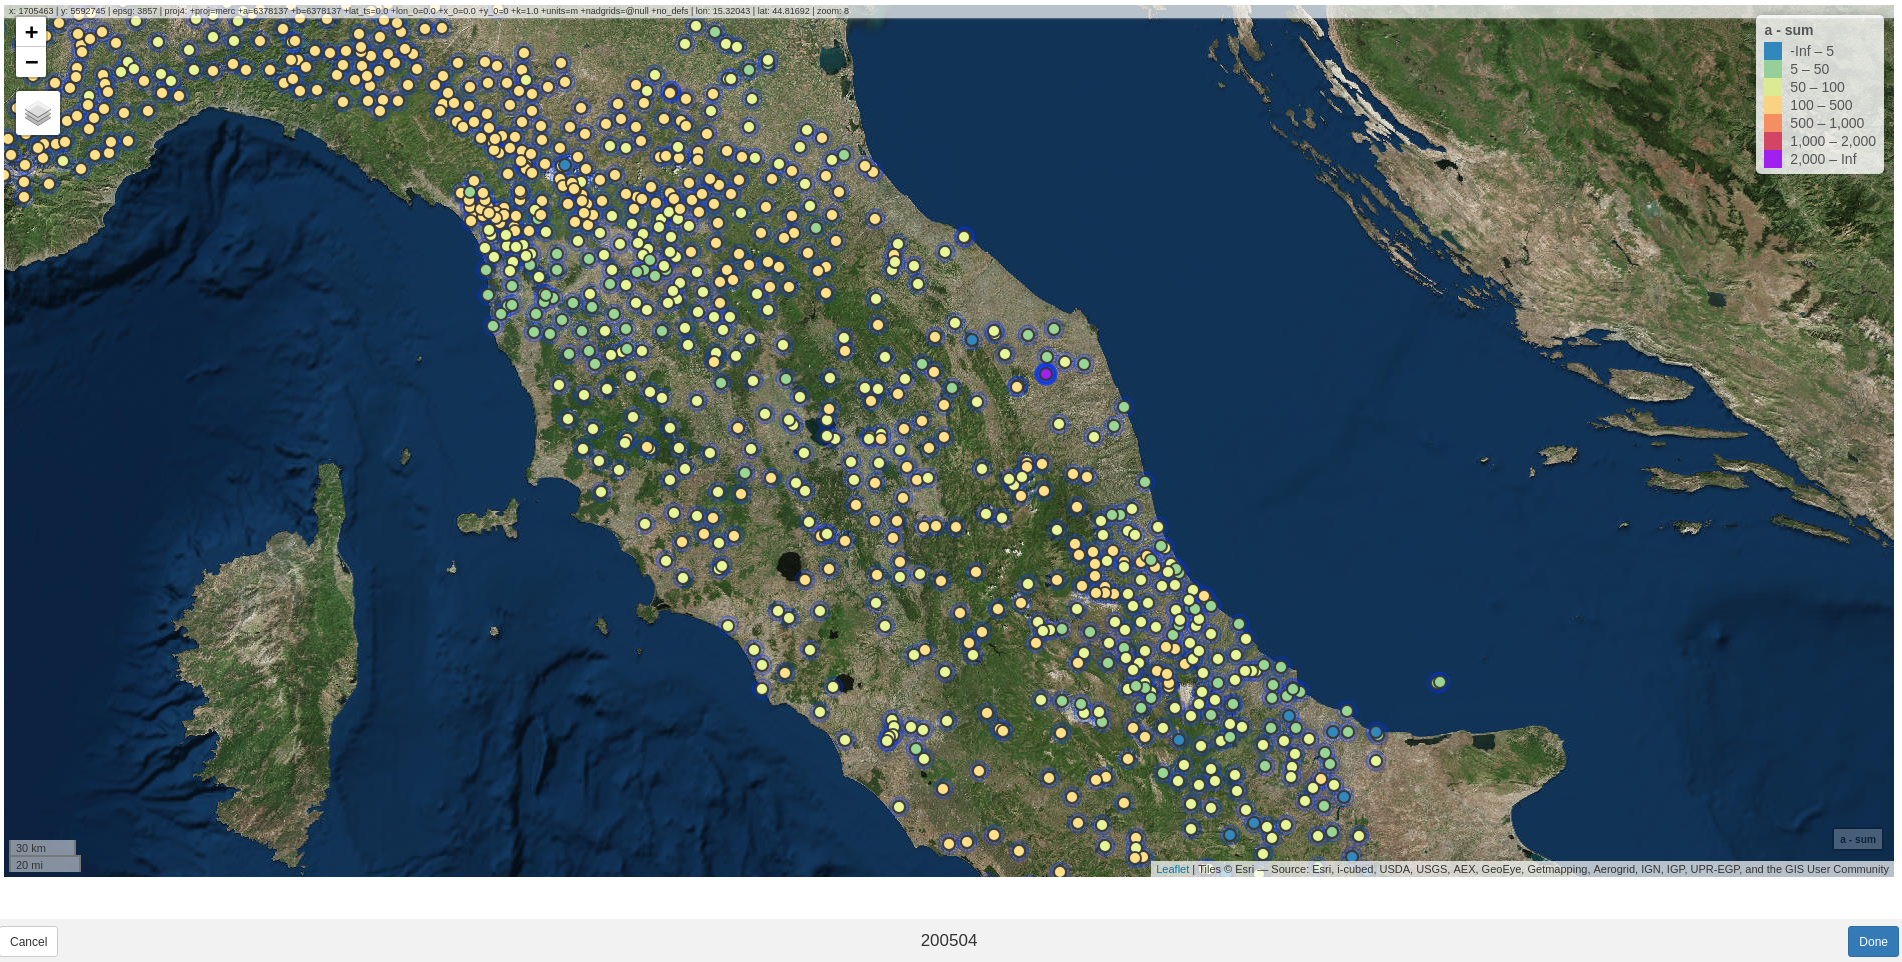
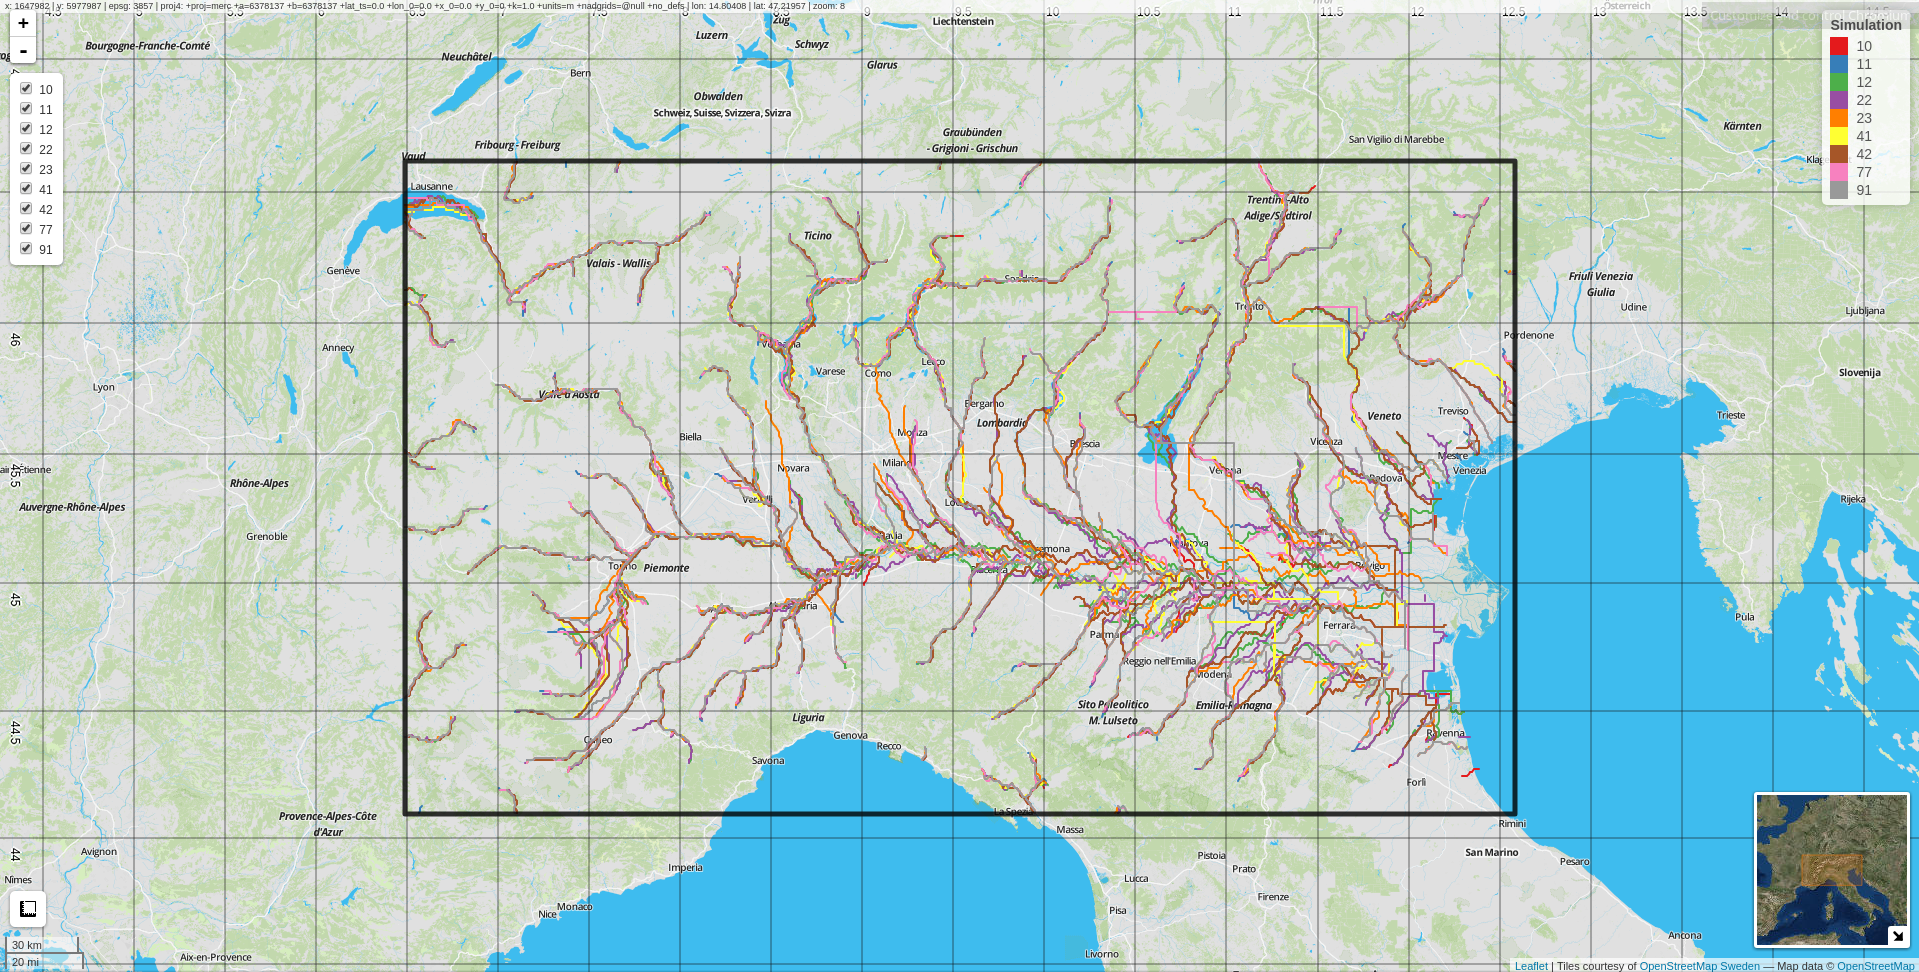
6.x - Visualization
An R/Leaflet tool for flood, river, DEM, basin and station visualization
6.x - Visualization
Click_edit: an R/Shiny tool for WYSISYG editing of NetCDF files

Thanks for your attention!
afantini@ictp.it
Precipitation:
- Observations
- RCM output
Gridded netCDF:
- River network
- Discharges
hydrological model
For each RP, cell:
- Gumbel distr.
- Hydrographs
- Extreme Q
Statistical analysis
For each RP, cell:
- Flood extent
- Flood depth
(multiple simulations)
- RCM output
- Discharges
- Floods
Validation and change for
CA2D hydraulic model
Based on Maione et al., 2003
(over nine domains)