Styling
or an overview of map styles, the tools and the methods

Thanks to:
for the Space

for the pizza!


And to:
Scenes
- Maps on the web
- Need for different representation
- What are webmaps?
- Tools for styling maps
- Tool of the day: Mapbox Studio
- CartoCSS, styling in code
- Styling with OpenStreetMap
- Map of the day: Boyle Heights!
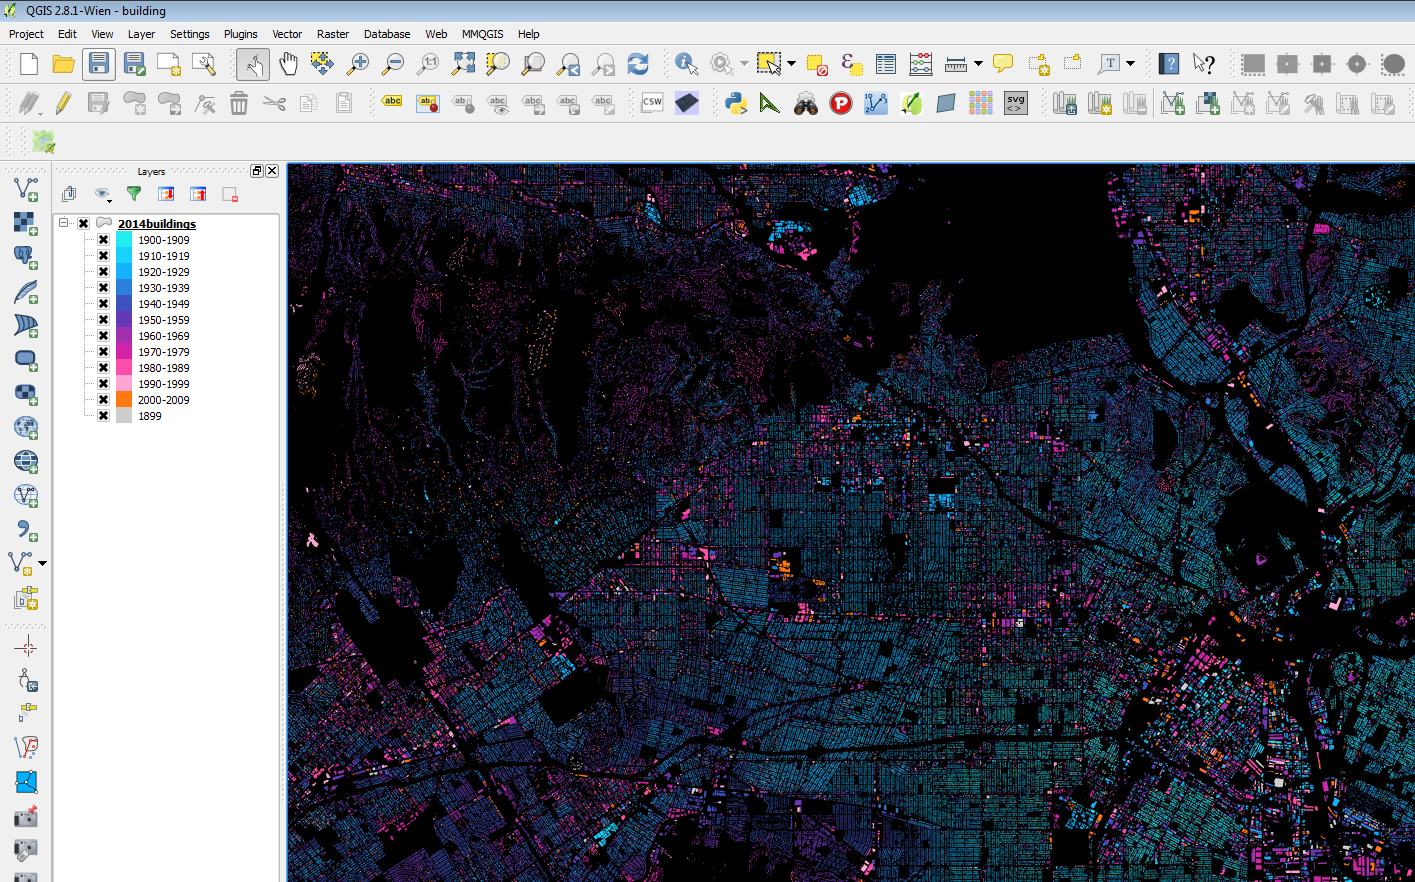
- Styling your own data
- Publishing to Mapbox
- A simple map
Maps on the Web
Google Map of Recycling Centers
Let's take a look at the kinds of maps out there on the internet, both
- interactive (maps I can click around and move)
- static (maps that are just large images or pdfs)
Note the Composition
Maps on the Web
Note the labels
and colors
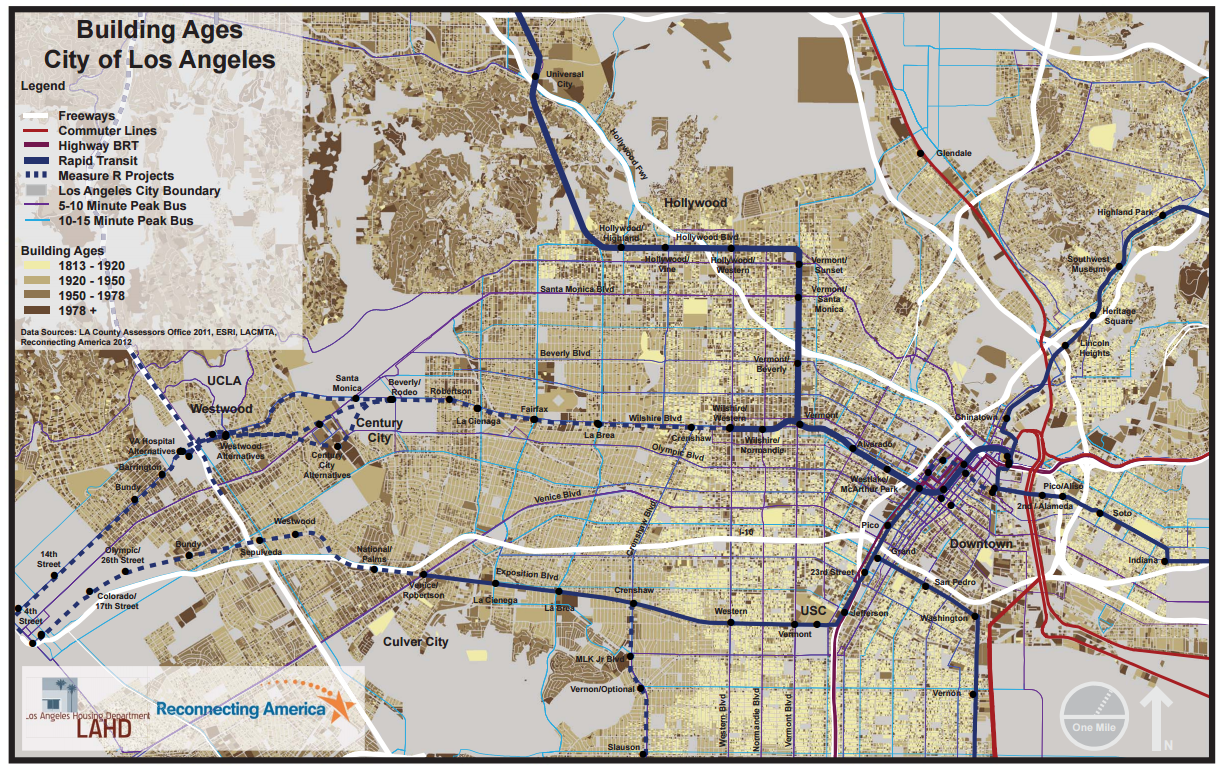
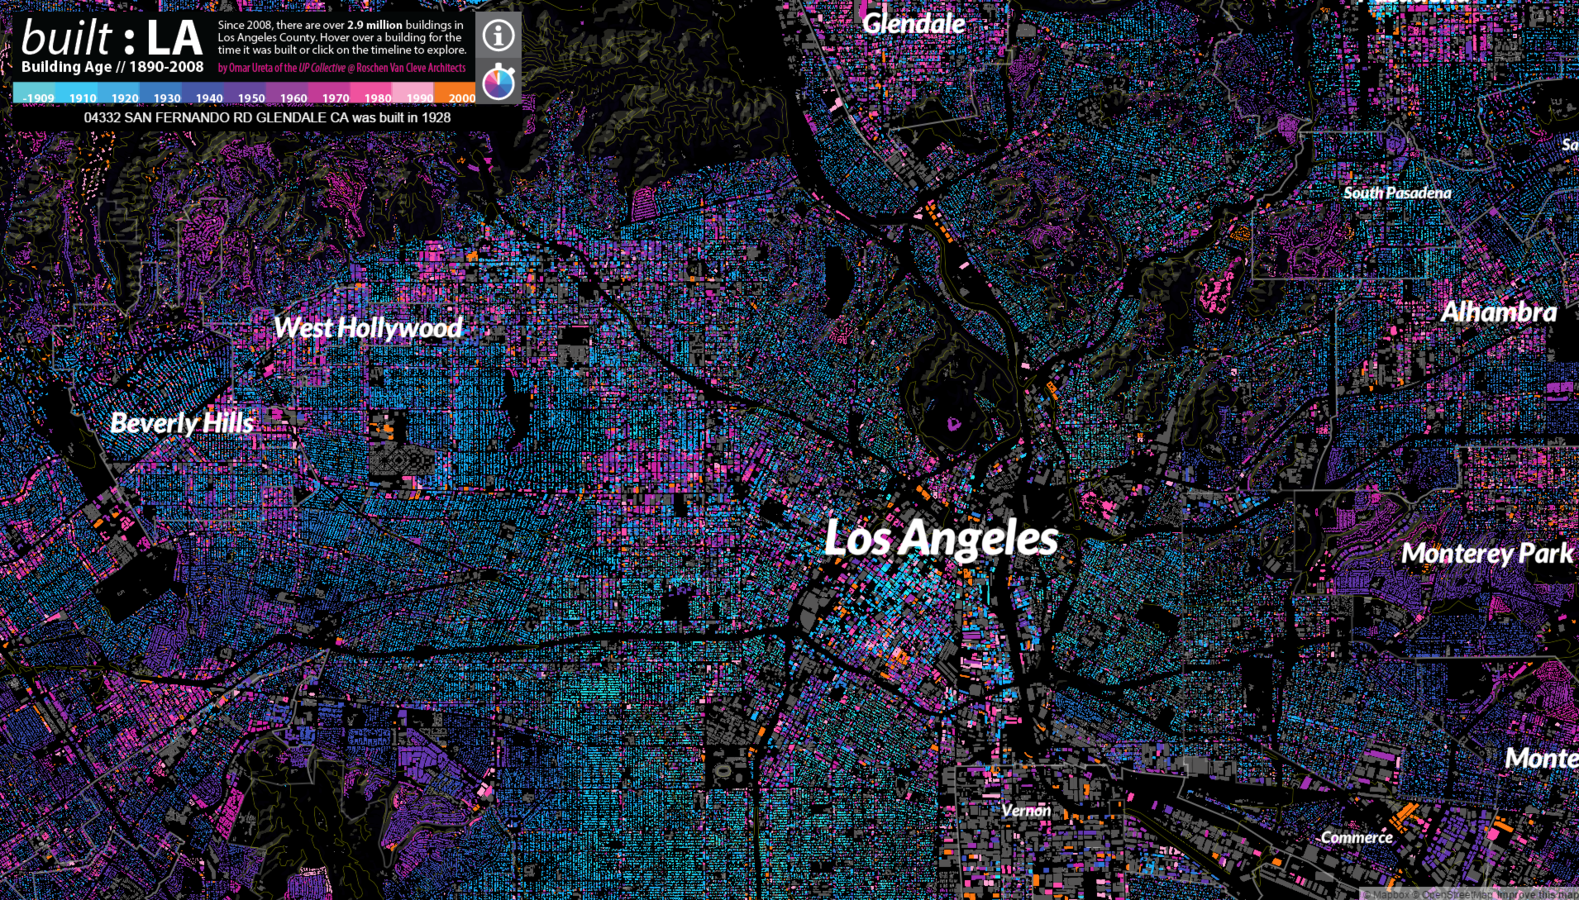
Building Ages, City of Los Angeles (LAHD and Reconnecting America)
http://www.reconnectingamerica.org/assets/Uploads/LAHD-Building-Age-Final.pdf
Maps on the Web
Note the visual hierarchy
NPR Map of the US Census 2010
A need for representation
Now note the composition
Racial Dot Map
A need for representation
Now see the use of labels
Envisioning Development Toolkit, Center for Urban Pedegogy
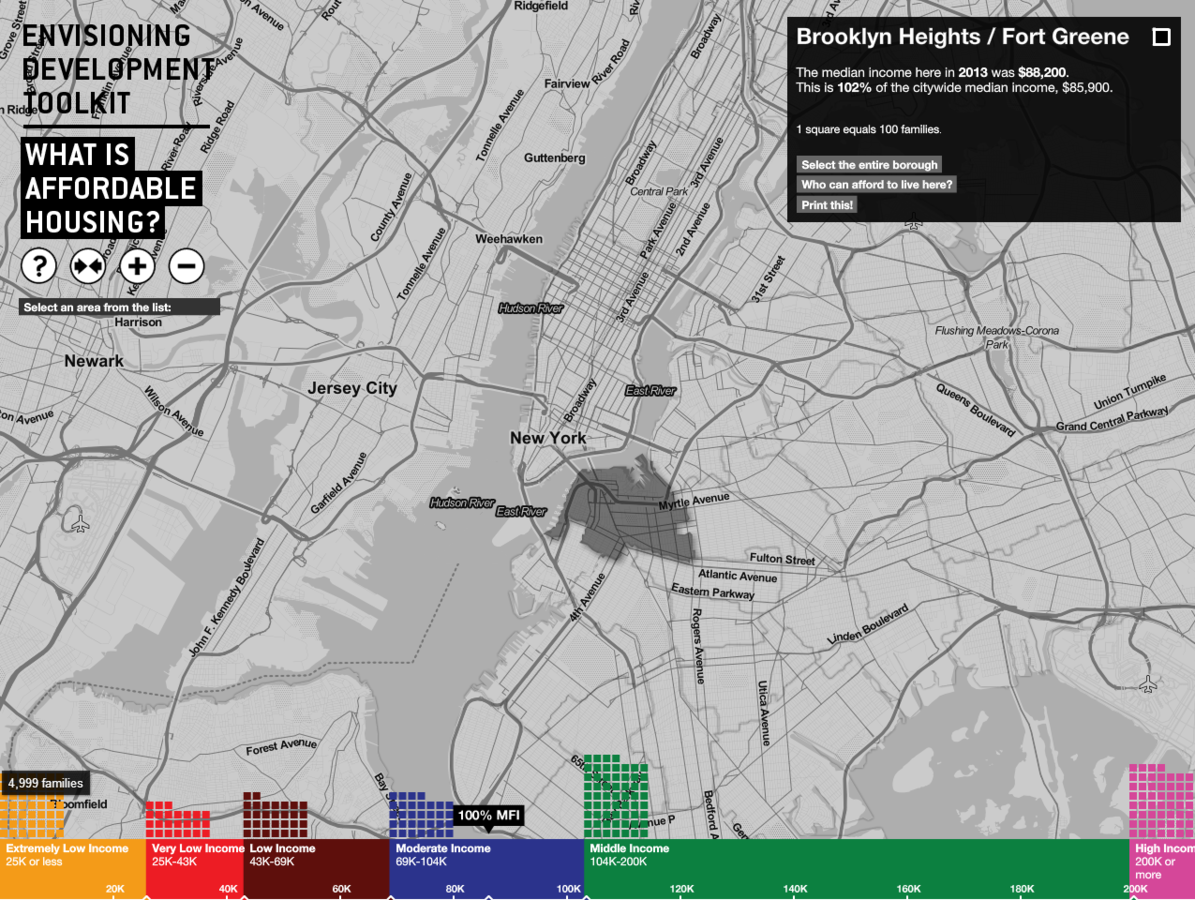
A need for representation
And the use of colors
Rivers colored by the direction they flow
http://www.fastcodesign.com/3039535/gorgeous-visualization-shows-americas-rivers-in-a-new-light
And the use of the data at hand
Where are LA County's Homeless?, LA TIMES, Doug Smith and Jon Schleuss
A need for representation
All these maps more or less follow some sort of cartographic design
map screenshot
Cartographic Design
is about:
- Color
- Characteristics
- Color Schemes
- Labels
- Font
- Character Spacing
- Leading
- Placement
- Map Composition
- Title
- Legend
- Scale bar
- Balance
- Visual Hierarchy
Thanks to Alexa Todd of MaptimePDX
Cartographic Design
can also be about:
- Experimenting
- Make us ask more questions
- Maps shouldn't be a final product and should be a process of inquiry

But maps must be able to tell your story
A need for representation
What are webmaps?

What are webmaps?


they are made up of Tiles


Raster
Vector
What are webmaps?
they can be displayed by these amazing mapping tools like leaflet, mapbox, esri's arcgis, and even D3
Tools for Styling Maps
There are different ways to style your maps, online and offline

Google Earth
Tools for Styling Maps
There are different ways to style your maps, online and offline
Google Maps- My Maps

Tools for Styling Maps
There are different ways to style your maps, online and offline
CartoDB

Tools for Styling Maps
There are different ways to style your maps, online and offline
QGIS and ESRI's ArcGIS
There be baselayers here
Mapbox Studio Basemaps
http://maptimela.github.io/mapbox_studio101/samplemaps/basemaps.html
Down here too
Tools for Styling Maps
There are different ways to style your maps, online and offline
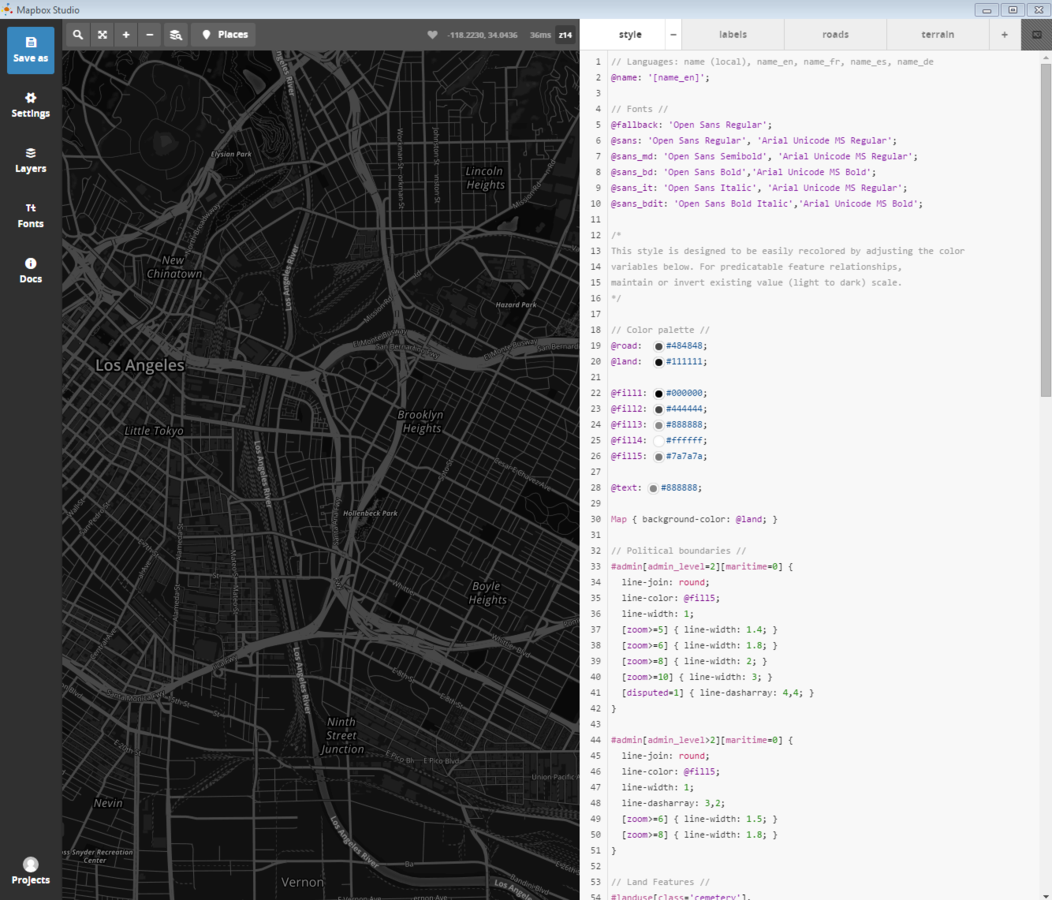
Mapbox Studio

CartoCSS, Styling in Code
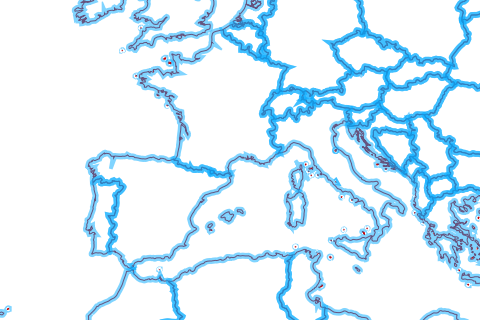
CartoCSS renders
- Line (for lines & polygons)
- Polygon (for polygons)
- Point (for points)
- Text (for points, lines, and polygons)
- Shield (for points & lines)
- Line Pattern (for lines & polygons)
- Polygon Pattern (for polygons)
- Raster (for rasters)
- Markers (for points, lines, & polygons)
- Buildings
#layer {
   line-color: #C00;
   line-width: 1;
}

#layer::glow {
   line-color: #0AF;
   line-opacity: 0.5;
   line-width: 4;
}
.border::highlight {
line-color: #FF0;
line-opacity: 0.5;
}
.border::highlight {
line-color: #3F6;
}
Styling with OpenStreetMap

OSM
Styling OSM
LET'S START STYLING!
Guides
- Style Quickstart
- Style Manual
- Common Questions
Map of the Day!
Boyle Heights

A simple map
A simple map
Publishing your map to Github
- Sign-up for Github
- Download your Github Desktop
- Fork the mapbox101 repo
- When github asks select your where you want the folder to save
- Edit your index.html file with your Mapbox Style with a Text editor like Sublime, Brackets, Atom.
- Save file
- In your Github Desktop, notice the changes you made, make a commit, and push your files to Github!
- In your github page, make a branch labeled "gh-pages"
- To open your map now online
- username.github.io/mapbox_studio101/index.html

Thanks Everyone!