Profiling with Xhprof
&
it's usage with Drupal

Hierarchical Profiler for PHP Applications that reports CPU Utilisation, memory consumption, Function level call counts, time consumed ...
What it does ?
- Reports function level counts and inclusive and exclusive metrics such as Wall time, CPU time & Memory usage.
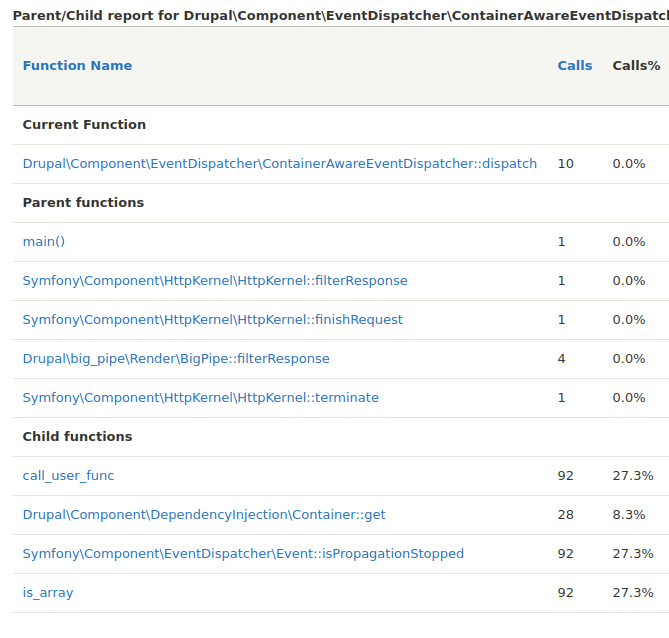
- Function Profiles Can be broken down by Callers and Callees.
- Simple HTML based User interface to show reports.
- Provides Call graph view of the report.
Can be useful for...
- Understanding structure of the code being executed in the form of callers and callees.
- Provides hierarchical nature of the reports that can be used to determine the backtrace of the code.
- Finding out the difference in the reports by providing the ability to compare.
- Can be used on production (with some things to keep in mind).
- Call Graph : Displays executed code in a visual diagram where each node corresponds to a function or method and their relations show Code Flow.
- Exclusive Time : How long does it take to execute a function without time spent on other functions/methods.
- Inclusive Time : Total time spent executing a function/method including any external call.
Some Basic Terminologies to understand xhprof reports better...
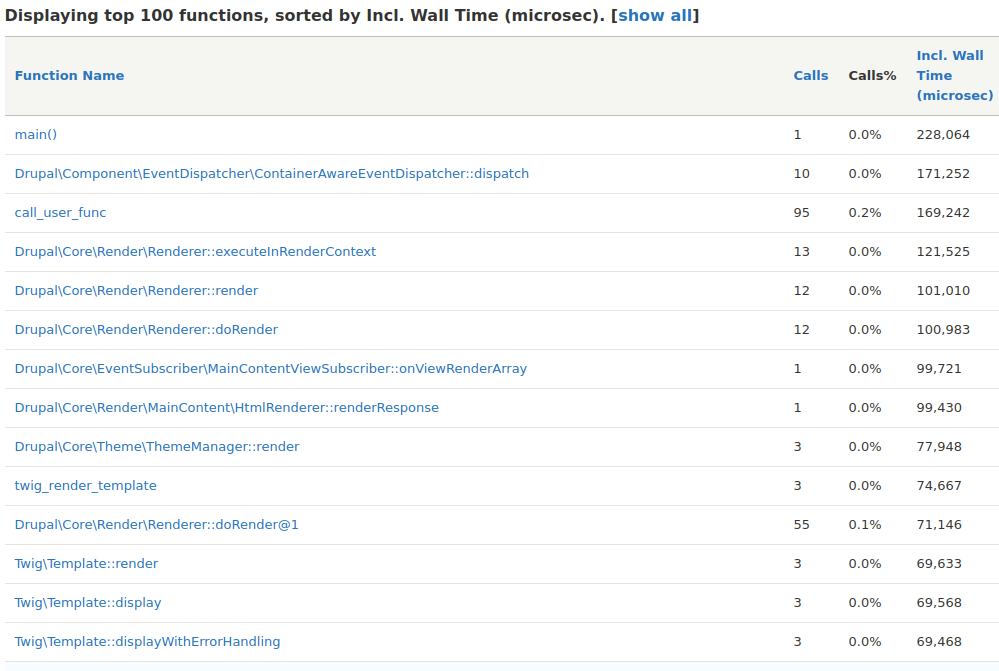
Flat Profile
Provides function-level summary information such as number of calls, inclusive/exclusive wall time, memory usage, and CPU time.
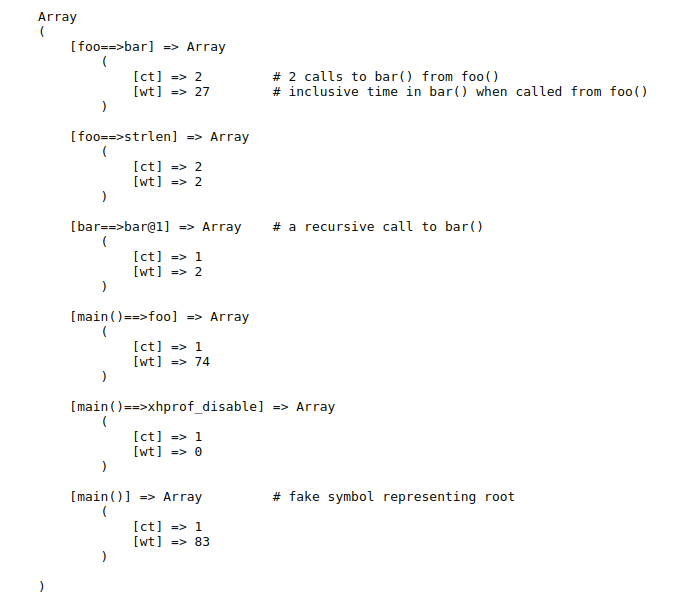
Hierarchical Profile
For each function, it provides a breakdown of calls and times per parent (caller) & child (callee)
Profiling with XHprof
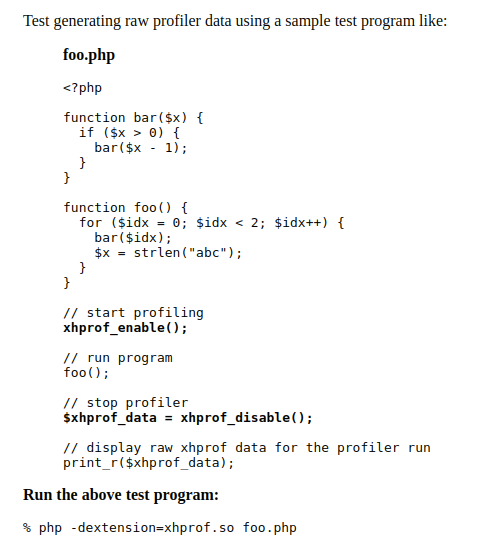
Output