React 圖表實作工具
Recharts & Chart.xkcd-react

React
D3.js
Recharts
What is Recharts ?
- Simply deploy with React components.
-
Native SVG support, lightweight depending only on some D3 submodules.
- Declarative components, components of charts are purely presentational.
The main purpose of this library is to help you to write charts in React applications without any pain.
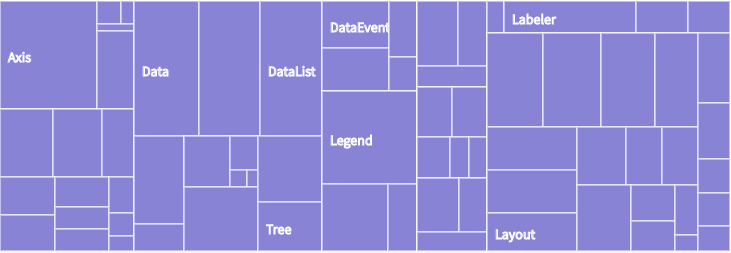
Support
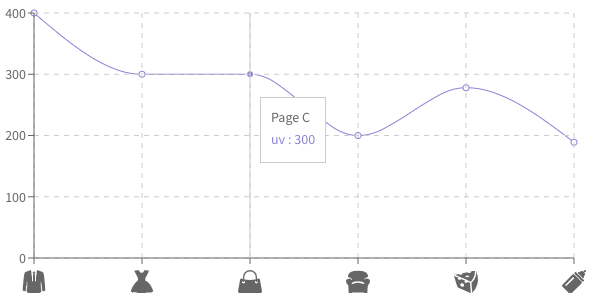
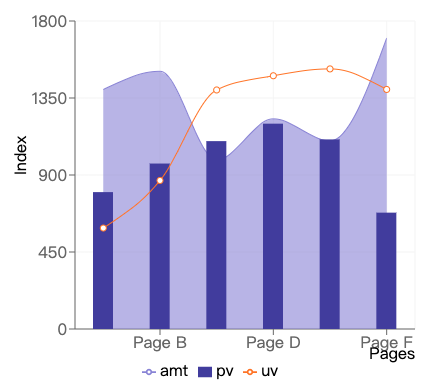
Simple Example:
import { LineChart, Line, CartesianGrid, XAxis, YAxis, Tooltip } from 'recharts';
const data = [{name: 'Page A', uv: 400, pv: 2400, amt: 2400}, ...];

const renderCustomAxisTick = ({ x, y, payload }) => {
  let path = '';

  switch (payload.value) {
    case 'Page A':
      path = 'M899.072 99.328q9.216 13.312 17.92 48.128t16.384 81.92 13.824 100.352 11.264 102.912 9.216 90.112 6.144 60.928q4.096 30.72 7.168 70.656t5.632 79.872 4.096 75.264 2.56 56.832q-13.312 16.384-30.208 25.6t-34.304 11.264-34.304-2.56-30.208-16.896q-1.024-10.24-3.584-33.28t-6.144-53.76-8.192-66.56-8.704-71.68q-11.264-83.968-23.552-184.32-7.168 37.888-11.264 74.752-4.096 31.744-6.656 66.56t-0.512 62.464q1.024 18.432 3.072 29.184t4.608 19.968 5.12 21.504 5.12 34.304 5.12 56.832 4.608 90.112q-11.264 24.576-50.688 42.496t-88.576 29.696-97.28 16.896-74.752 5.12q-18.432 0-46.08-2.56t-60.416-7.168-66.048-12.288-61.952-17.92-49.664-24.064-28.16-30.208q2.048-55.296 5.12-90.112t5.632-56.832 5.12-34.304 5.12-21.504 4.096-19.968 3.584-29.184q2.048-27.648-0.512-62.464t-6.656-66.56q-4.096-36.864-11.264-74.752-13.312 100.352-24.576 184.32-5.12 35.84-9.216 71.68t-8.192 66.56-6.656 53.76-2.56 33.28q-13.312 12.288-30.208 16.896t-34.304 2.56-33.792-11.264-29.696-25.6q0-21.504 2.048-56.832t4.096-75.264 5.632-79.872 6.656-70.656q2.048-20.48 6.144-60.928t9.728-90.112 11.776-102.912 13.824-100.352 16.384-81.92 17.92-48.128q20.48-12.288 56.32-25.6t73.216-26.624 71.168-25.088 50.176-22.016q10.24 13.312 16.896 61.44t13.312 115.712 15.36 146.432 23.04 153.6l38.912-334.848-29.696-25.6 43.008-54.272 15.36 2.048 15.36-2.048 43.008 54.272-29.696 25.6 38.912 334.848q14.336-74.752 23.04-153.6t15.36-146.432 13.312-115.712 16.896-61.44q16.384 10.24 50.176 22.016t71.168 25.088 73.216 26.624 56.32 25.6';
      break;
    case 'Page B':
      path = 'M662.528 451.584q10.24 5.12 30.208 16.384t46.08 31.744 57.856 52.736 65.024 80.896 67.072 115.2 64.512 154.624q-15.36 9.216-31.232 21.504t-31.232 22.016-31.744 15.36-32.768 2.56q-44.032-9.216-78.336-8.192t-62.976 7.68-53.248 16.896-47.616 19.968-46.08 16.384-49.664 6.656q-57.344-1.024-110.592-16.896t-101.376-32.256-89.6-25.088-75.264 4.608q-20.48 8.192-41.984 1.024t-38.912-18.432q-20.48-13.312-39.936-33.792 37.888-116.736 86.016-199.68t92.672-136.704 78.848-81.408 43.52-33.792q9.216-5.12 10.24-25.088t-1.024-40.448q-3.072-24.576-9.216-54.272l-150.528-302.08 180.224-29.696q27.648 52.224 53.76 79.36t50.176 36.864 45.568 5.12 39.936-17.92q43.008-30.72 80.896-103.424l181.248 29.696q-20.48 48.128-45.056 99.328-20.48 44.032-47.616 97.28t-57.856 105.472q-12.288 34.816-13.824 57.344t1.536 36.864q4.096 16.384 12.288 25.6z';
      break;
      ...
    default:
      path = '';
  }

  return (
    <svg x={x - 12} y={y + 4} width={24} height={24} viewBox="0 0 1024 1024" fill="#666">
      <path d={path} />
    </svg>
  );
};
const renderLineChart = (
  <LineChart width={600} height={300} data={data} margin={{ top: 5, right: 20, bottom: 5, left: 0 }}>
    <Line type="monotone" dataKey="uv" stroke="#8884d8" />
    <CartesianGrid stroke="#ccc" strokeDasharray="5 5" />
    <XAxis dataKey="name" tick={renderCustomAxisTick} />
    <YAxis />
    <Tooltip />
  </LineChart>
);
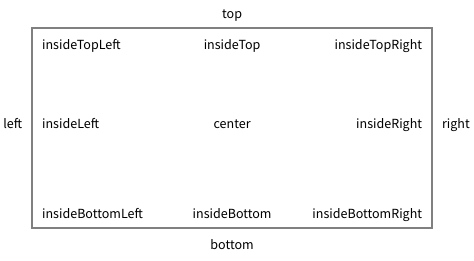
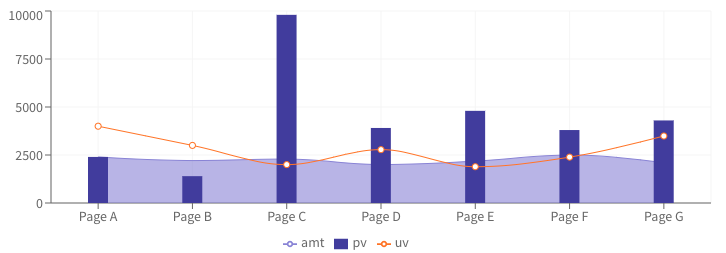
Label & LabelList
The "position" in view box of Cartesian Coordinates
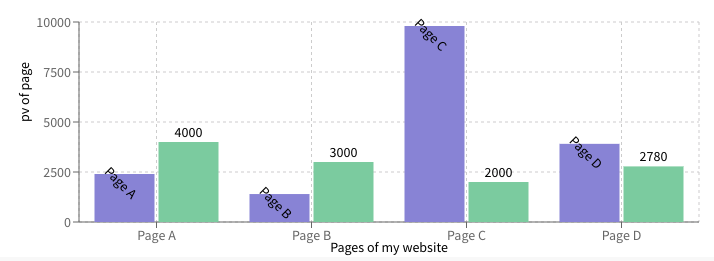
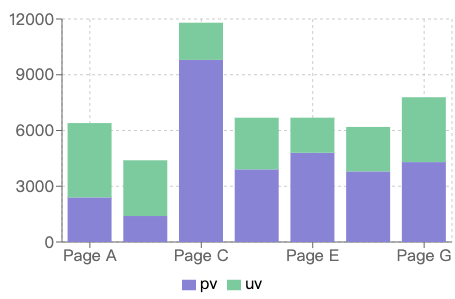
<BarChart
  width={730}
  height={250}
  data={data}
  margin={{ top: 15, right: 30, left: 20, bottom: 5 }}
>
  <CartesianGrid strokeDasharray="3 3" />
  <XAxis dataKey="name">
    <Label value="Pages of my website" offset={0} position="insideBottom" />
  </XAxis>
  <YAxis label={{ value: 'pv of page', angle: -90, position: 'insideLeft', textAnchor: 'middle' }} />
  <Bar dataKey="pv" fill="#8884d8">
    <LabelList dataKey="name" position="insideTop" angle="45"  />
  </Bar>
  <Bar dataKey="uv" fill="#82ca9d">
    <LabelList dataKey="uv" position="top" />
  </Bar>
</BarChart>
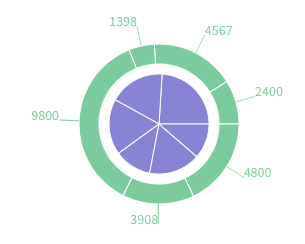
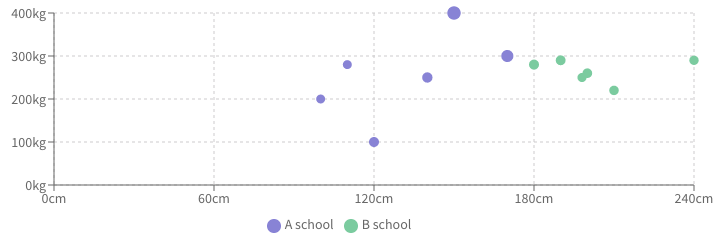
Cell
Cell can be wrapped by Pie, Bar, or RadialBar to specify attributes of each child.
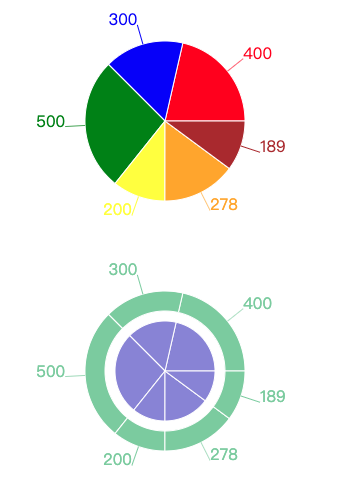
<PieChart width={730} height={250}>
  <Pie data={data} cx="35%" cy="50%" outerRadius={80} label>
  	{data.map((entry, index) => (
      	<Cell key={`cell-${index}`} fill={colors[index]} />
     ))}
  </Pie>
</PieChart>
<PieChart width={730} height={250}>
<Pie
data={data}
dataKey="value"
nameKey="name"
cx="35%"
cy="50%"
outerRadius={50}
fill="#8884d8"
/>
<Pie
data={data}
dataKey="value"
nameKey="name"
cx="35%"
cy="50%"
innerRadius={60}
outerRadius={80}
fill="#82ca9d"
label
/>
</PieChart>More Example :
外卡:
用chart.xkcd-react實作手寫漫畫風圖表
直接來看範例吧!