Case:
Marketing analyst at
Summary
1.-
Reporting of the most interesting insights
2.-
TOP 3 metrics recommendation
3.-
Next steps
1. Decreasing trend on overall installs
2. Huge increase in cancellations
3. iOs accounts for up to 80% of new installs
4. iOS accounts for +80% of daily active users
5. The US is our biggest market
6. We are loosing paying users daily
7. The number of renewed subscriptions is falling
8. Organic traffic accounts for almost all of our new installs
1. Installs
2. Daily active users
3. Churn rate
1. Figure out the reason for the cancellations
2. Rethink our marketing strategy
3. Drop marginal operating systems
4. Follow consistent data architecture criteria

Reporting of the most interesting insights
1. Decreasing trend on installs
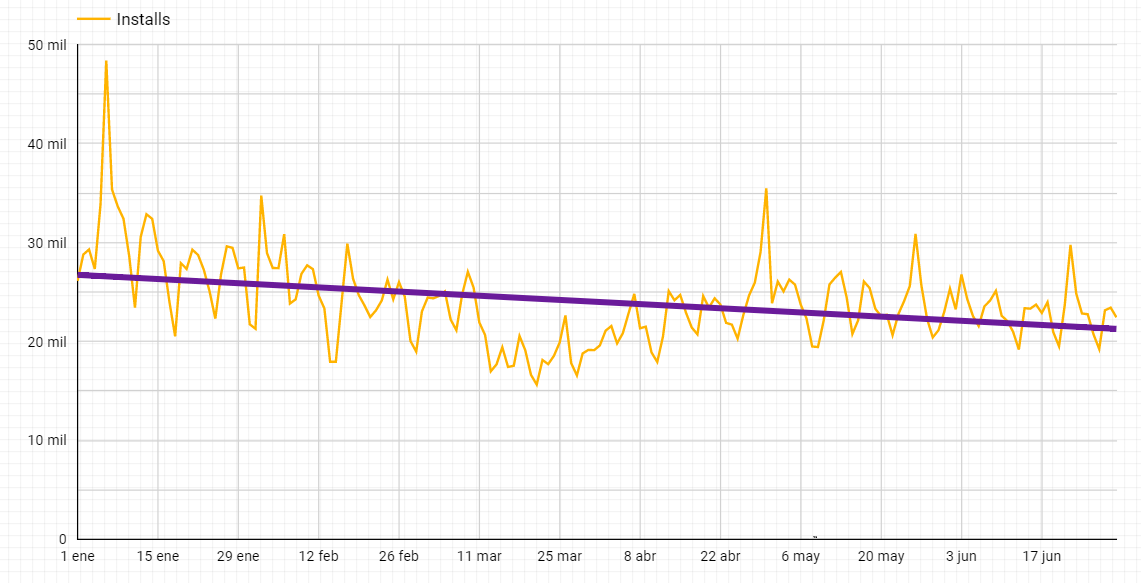
Although the biggest fall happened between January and March and have since recovered slightly, installs show an overall decreasing trend.
Reporting of the most interesting insights
2. There has been a huge increase in cancellations
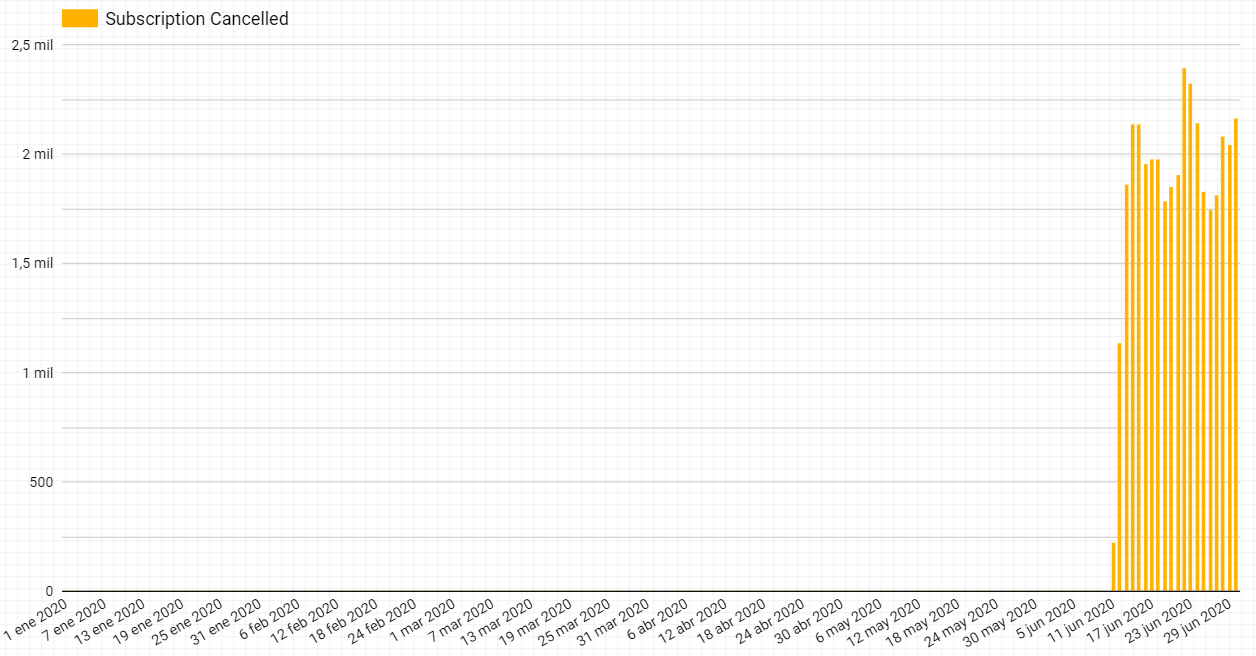
Not a single person that subscribed to our Premium program had cancelled until June 10th, 2020. Since then, 37.509 people have unsubscribed.
Reporting of the most interesting insights
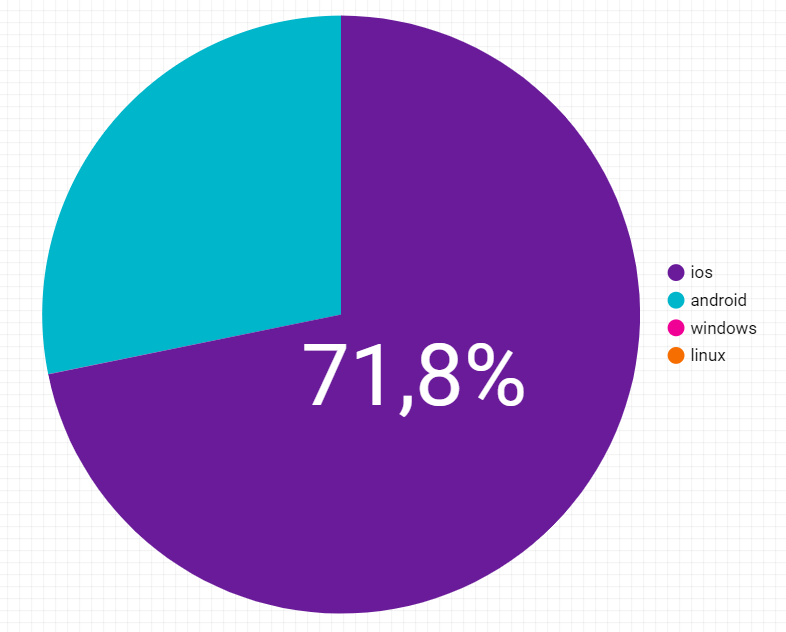
3. iOS accounts for more than 70% of new installs
Although it presents some variation, Apple's operating system accounts for more than 70% of all new installs, with Android taking the remaining 28,2%.
Reporting of the most interesting insights
4. iOS accounts for +80% of daily active users
Similar to the new installs, iOS takes more than 80% of our daily active users, with Android taking almost all of what is left.

Reporting of the most interesting insights
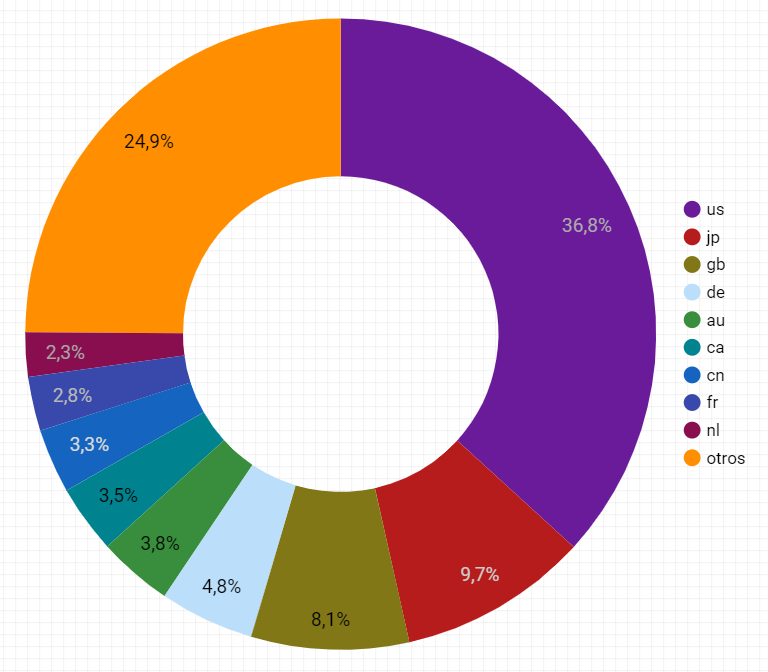
5. Most paying users are in the US
Most of the paying users are in the US, followed by Japan and Great Britain.
Reporting of the most interesting insights
6. During June, we are losing paying users daily
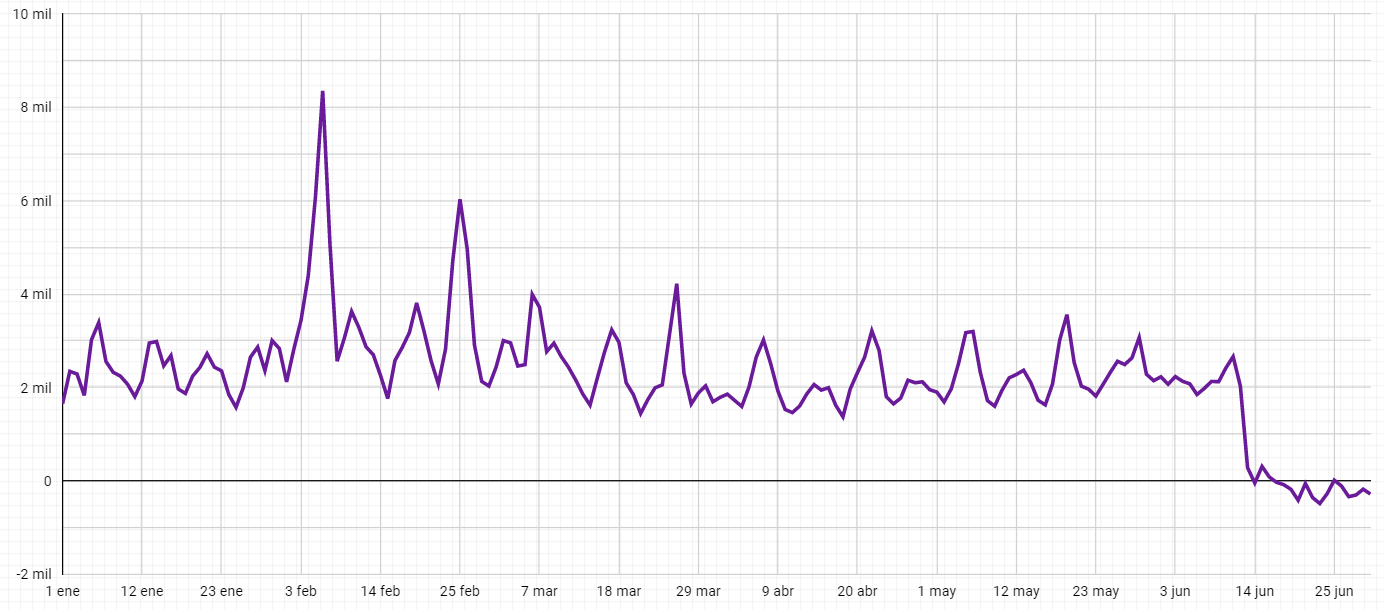
As the graph shows, we are currently loosing paying users. This comes from adding new and renewed subscriptions and substracting the cancelled ones.
Reporting of the most interesting insights
7. The number of renewed subscriptions is falling
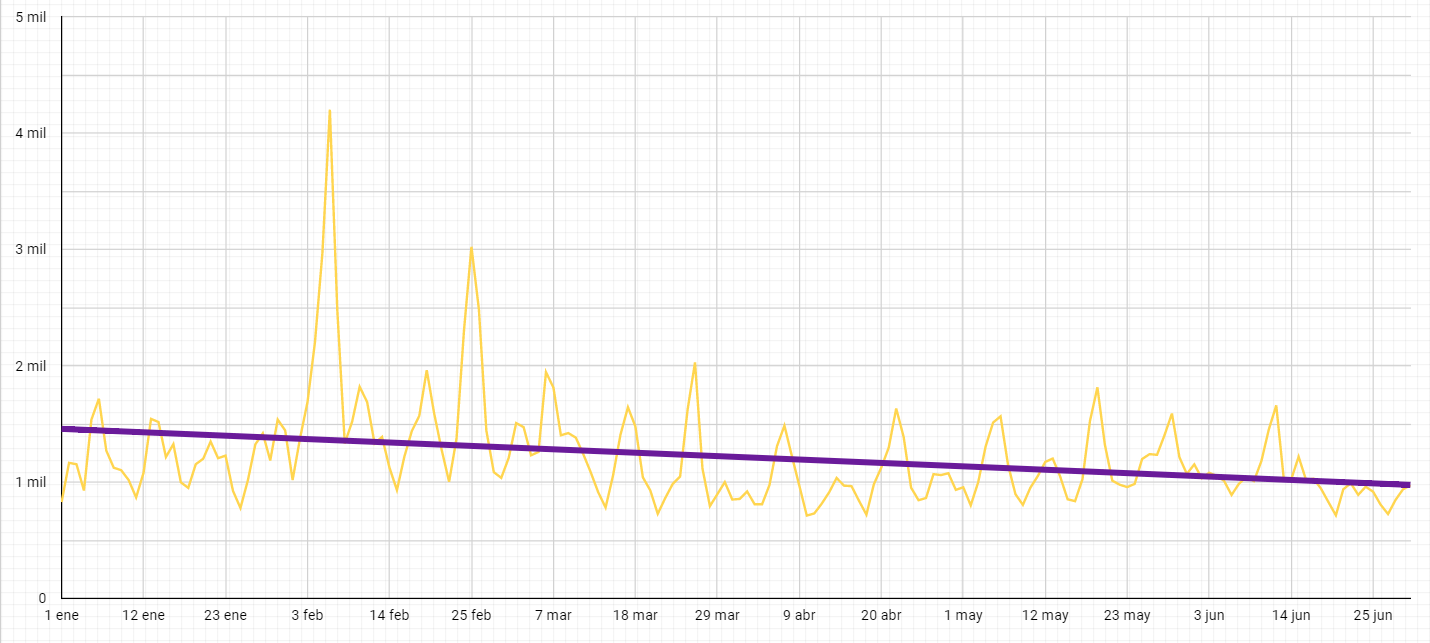
The purple line of the graph shows us a worrying tendency in terms of user loyalty, as renewed subscriptions shows a clear decreasing trend.
Reporting of the most interesting insights
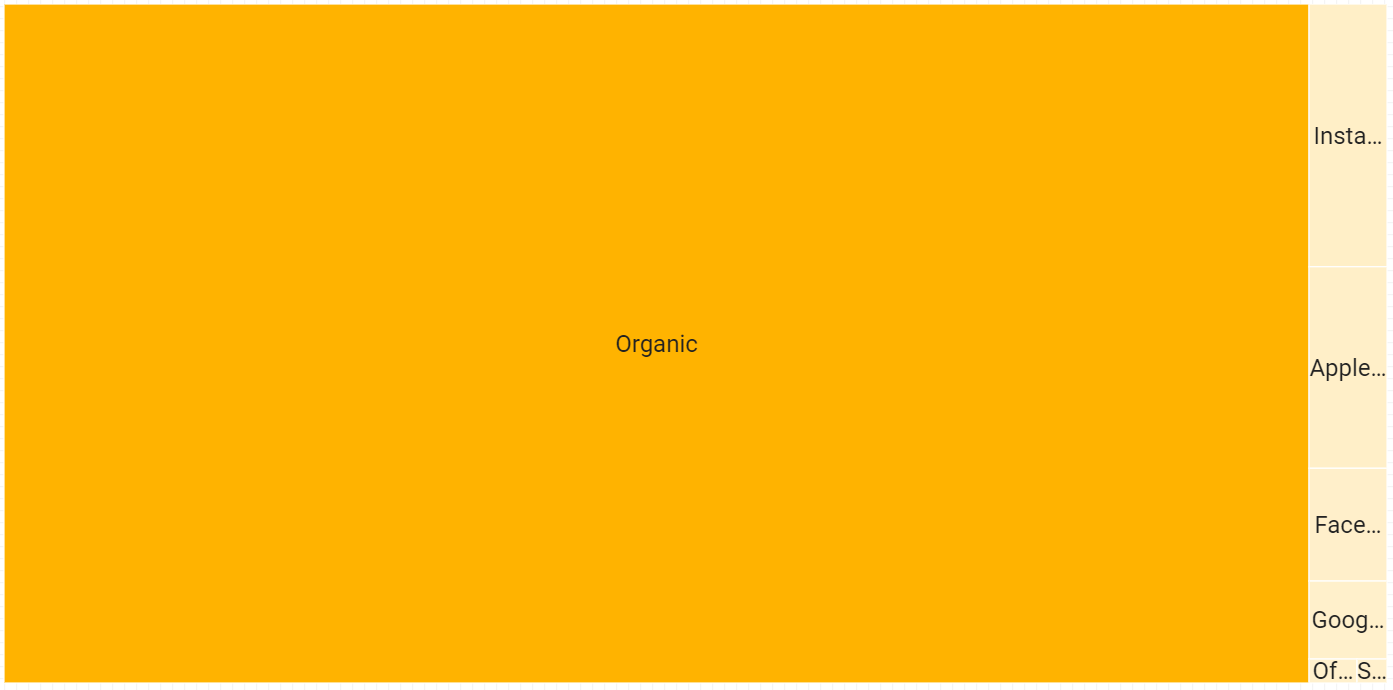
8. Almost all our installs are due to organic traffic
As we see in the graph, almost all of our installs come through organic channels, followed by Instagram Installs and Apple Search Ads.
TOP 3 metrics to evaluate performance
1. Installs
This needs to be the first metric to check, as we cannot earn the loyalty of users who do not install our app and, therefore, no profit can be made from it. That is why it has to be our North Star.
TOP 3 metrics to evaluate performance
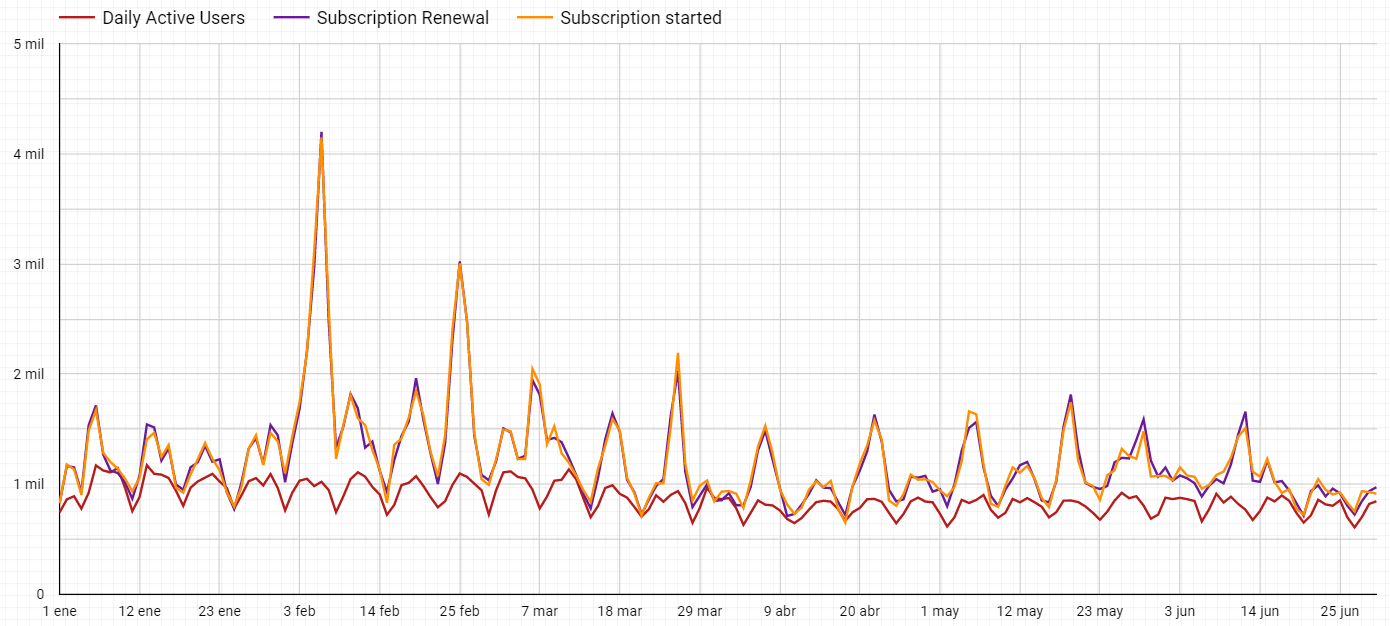
2. Daily active users
Focusing on this metric will allow us to be focused on how loyal our users are and, since it is highly correlated with trials and subscriptions started and subscription renewal, will give us a hint on our financial KPIs.
* With this graph we see the correlation between all three KPIs
TOP 3 metrics to evaluate performance
3. Churn rate
I add this metric because of the potential impact it can have in a company. Although we had a 0% churn rate throughout most of the time covered by our data, there has been a sudden increase that can lead to serious trouble if it goes unnoticed.
* With this graph we see the huge increase in churn
Next steps...
1. Figure out the reason for the cancellations
Cancellations can be due to many reasons, but the fact that there was not a single cancellation for almost six months and a sudden increase during the last 20 days makes me think that it can be due to an unhandled app error that is driving users away. Dealing with it should be our TOP priority.
Next steps...
2. Rethink our marketing strategy
Our marketing and advertising strategy is proving to be unneffective, since organic traffic accounts for almost all our new installs. Therefore, we should analyze two things:
In which channels our target audience is and focus our efforts towards the most important ones.
-
The strengths and weaknesses of our ASO and SEO strategies to keep developing them.
-
Next steps...
3. Drop marginal operating systems
As our data shows, iOS and Android bring almost every user we have. We should therefore drop the other operating systems because they take time and resources to develop and bring almost no reward.
4. Follow consistent data architecture criteria
The inconsistency in, for example, the way our data is named, generates confusion that leads to higher processing time, delaying decision making.