
Pedro Vila-Cerqueira • Mário Ramirez Lab
Impossible task of today:
Create an interactive stand-alone and dependency-free report


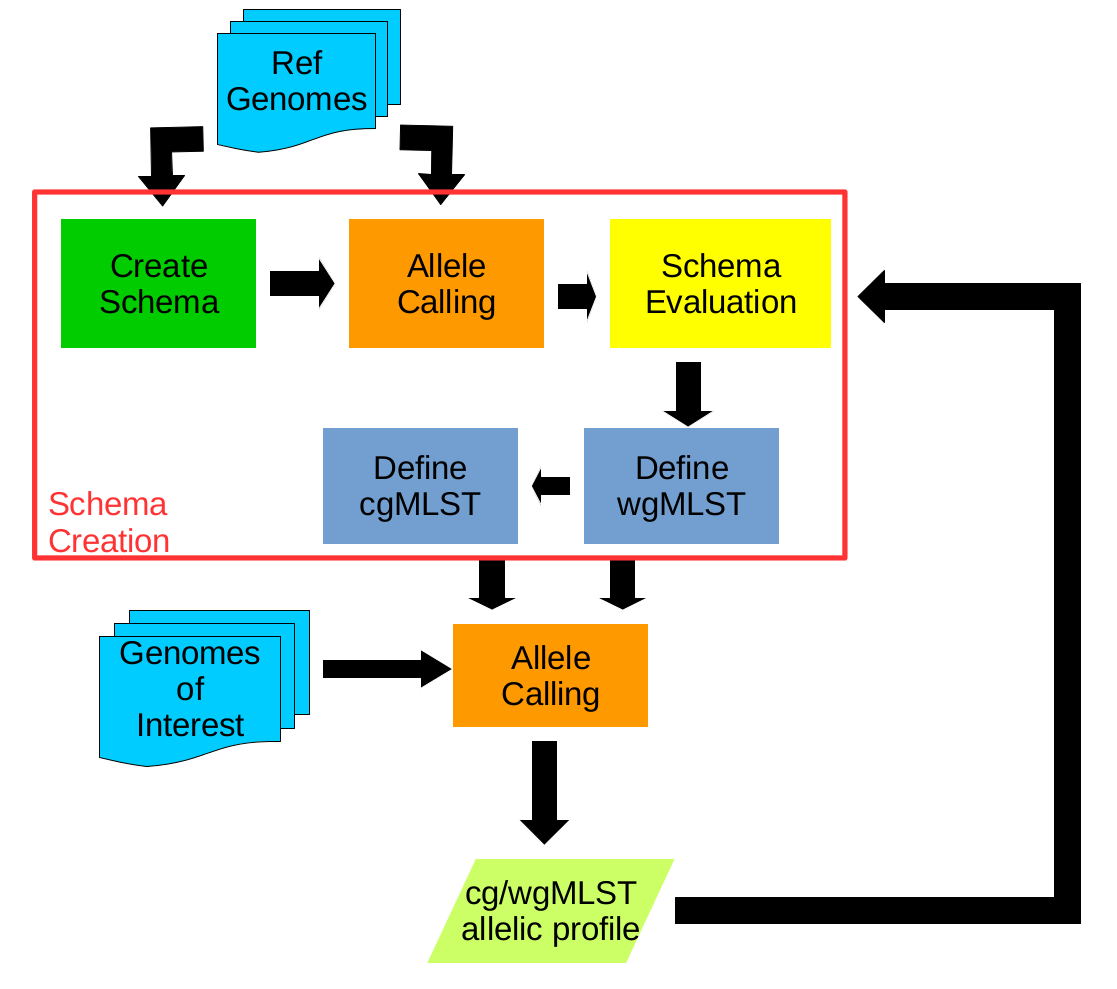
- BLAST Score Ratio (BSR) Based Allele Calling Algorithm.
- Open source solution for the creation of whole genome and core genome MultiLocus Sequence Typing (wg/cgMLST) schemas.
- Performs allele calls on complete or draft genomes resulting from de novo assemblers and determines allelic profiles.
chewBBACA
https://github.com/B-UMMI/chewBBACA
Interactive report for chewBBACA
- The diversity (number of alleles) at each locus;
- The variation of allele sizes per locus;
- The relationship between alleles;
- The presence of alleles that are not complete coding sequences (CDS);
Users are able to share the report.
Dash by Plotly
- Dash is an open source framework for building data visualization interfaces.
- Build analytical web applications without requiring advanced web development knowledge.
- Python, R and Julia.

Web server
Charts
User Interface

Dash by Plotly
import dash
import dash_core_components as dcc
import dash_html_components as html
import plotly.express as px
import pandas as pd

external_stylesheets = ['https://codepen.io/chriddyp/pen/bWLwgP.css']

app = dash.Dash(__name__, external_stylesheets=external_stylesheets)

df = pd.DataFrame({
    "Fruit": ["Apples", "Oranges", "Bananas", "Apples", "Oranges", "Bananas"],
    "Amount": [4, 1, 2, 2, 4, 5],
    "City": ["SF", "SF", "SF", "Montreal", "Montreal", "Montreal"]
})

markdown_text = '''
### Dash and Markdown

Dash apps can be written in Markdown.
Dash uses the [CommonMark](http://commonmark.org/)
specification of Markdown.
Check out their [60 Second Markdown Tutorial](http://commonmark.org/help/)
if this is your first introduction to Markdown!
'''

fig = px.bar(df, x="Fruit", y="Amount", color="City", barmode="group")

app.layout = html.Div(children=[
    html.H1(children='Hello Dash'),

    html.Div(children='''
        Dash: A web application framework for Python.
    '''),

    dcc.Graph(
        id='example-graph',
        figure=fig
    )
])

if __name__ == '__main__':
    app.run_server(debug=True)
Python example
Dash by Plotly
Python example
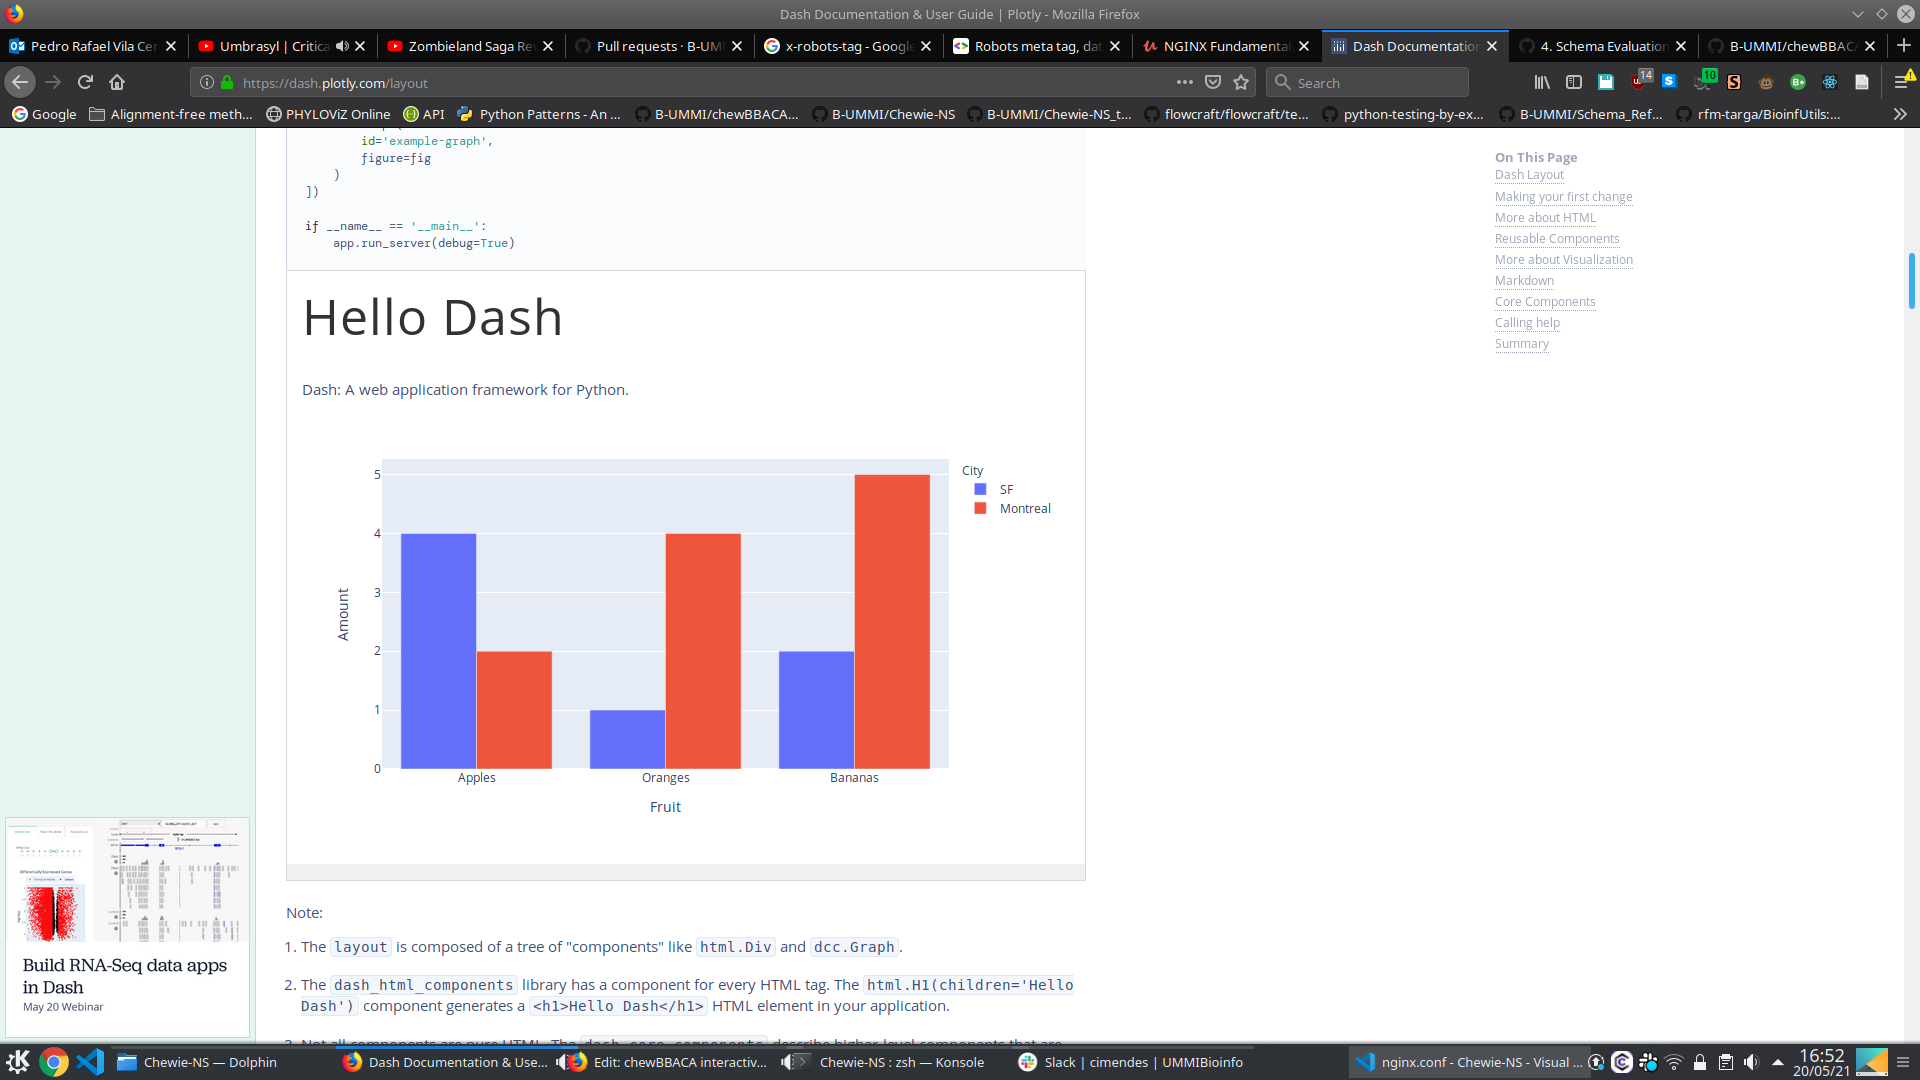
Dash by Plotly
Dash by Plotly
- Dash is an open source framework for building data visualization interfaces.
- Build analytical web applications without requiring advanced web development knowledge.
- Python, R and Julia.
Web server
Charts
User Interface
Can it be shared?
Streamlit
- Streamlit is an open-source Python library for creating web applications for machine learning and data science
- Explore datasets, demonstrate ML models and create data visualizations
- Python


User Interface
Web Server
Streamlit
import streamlit as st
import streamlit.components.v1 as components
import networkx as nx
import matplotlib.pyplot as plt
from pyvis.network import Network
import got

st.title('Hello Pyvis')

st.sidebar.title('Choose your favorite Graph')
option=st.sidebar.selectbox('select graph',('Simple','Karate', 'GOT'))
physics=st.sidebar.checkbox('add physics interactivity?')
got.simple_func(physics)

if option=='Simple':
  HtmlFile = open("test.html", 'r', encoding='utf-8')
  source_code = HtmlFile.read()
  components.html(source_code, height = 900,width=900)


got.got_func(physics)

if option=='GOT':
  HtmlFile = open("gameofthrones.html", 'r', encoding='utf-8')
  source_code = HtmlFile.read()
  components.html(source_code, height = 1200,width=1000)


got.karate_func(physics)

if option=='Karate':
  HtmlFile = open("karate.html", 'r', encoding='utf-8')
  source_code = HtmlFile.read()
  components.html(source_code, height = 1200,width=1000)
Example
Streamlit
Streamlit
Streamlit
- Streamlit is an open-source Python library for creating web applications for machine learning and data science
- Explore datasets, demonstrate ML models and create data visualizations
- Python
User Interface
Web Server
Can it be shared?
React
- React is an open-source front-end JavaScript library for building user interfaces or UI components.
- Javascript and CSS

React
Example
ReactDOM.render(
  <h1>Hello, world!</h1>,
  document.getElementById('root')
);
class Sequences extends Component {
state = {
seq: "",
};
onSubmitHandler = (event) => {
event.preventDefault();
this.props.onFetchSequence(this.state.seq);
};
onClickClear = () => {
this.setState({
seq: "",
});
};
render() {
const { classes } = this.props;
let sequenceTable = <MUIDataTable />;
let errorMessage = null;
if (this.props.error) {
errorMessage = <p>{this.props.error.message}</p>;
}
if (!this.props.loading) {
let seqData = this.props.sequence_data;
sequenceTable = (
<MuiThemeProvider theme={this.getMuiTheme()}>
<MUIDataTable
title={"Results"}
data={seqData}
columns={SEQUENCES_COLUMNS}
options={SEQUENCES_OPTIONS}
/>
</MuiThemeProvider>
);
}
return (
<div id="homeDiv">
<div id="titleDiv">
<h1 style={{ textAlign: "center" }}>Allele Search</h1>
</div>
<div id="TextAreaDiv">
<Container component="main" maxWidth="xs">
<CssBaseline />
<div className={classes.paper}>
<form
className={classes.root}
onSubmit={(e) => this.onSubmitHandler(e)}
noValidate
autoComplete="off"
>
<div>
<TextField
id="outlined-textarea"
label="Alelle Sequence or Hash"
placeholder="DNA Sequence or Hash"
rows={4}
multiline
variant="outlined"
onInput={(e) => this.setState({ seq: e.target.value })}
/>
<Button
type="submit"
fullWidth
variant="contained"
className={classes.submit}
classes={{
root: classes.buttonRoot,
}}
>
SEARCH
</Button>
</div>
</form>
</div>
</Container>
</div>
<div>{errorMessage}</div>
<div>{sequenceTable}</div>
<Copyright />
</div>
);
}
}
React
React
React
- React is an open-source front-end JavaScript library for building user interfaces or UI components.
Can it be shared?
YES!
- A HTML file with the main findings;
- Several HTML files for each locus.
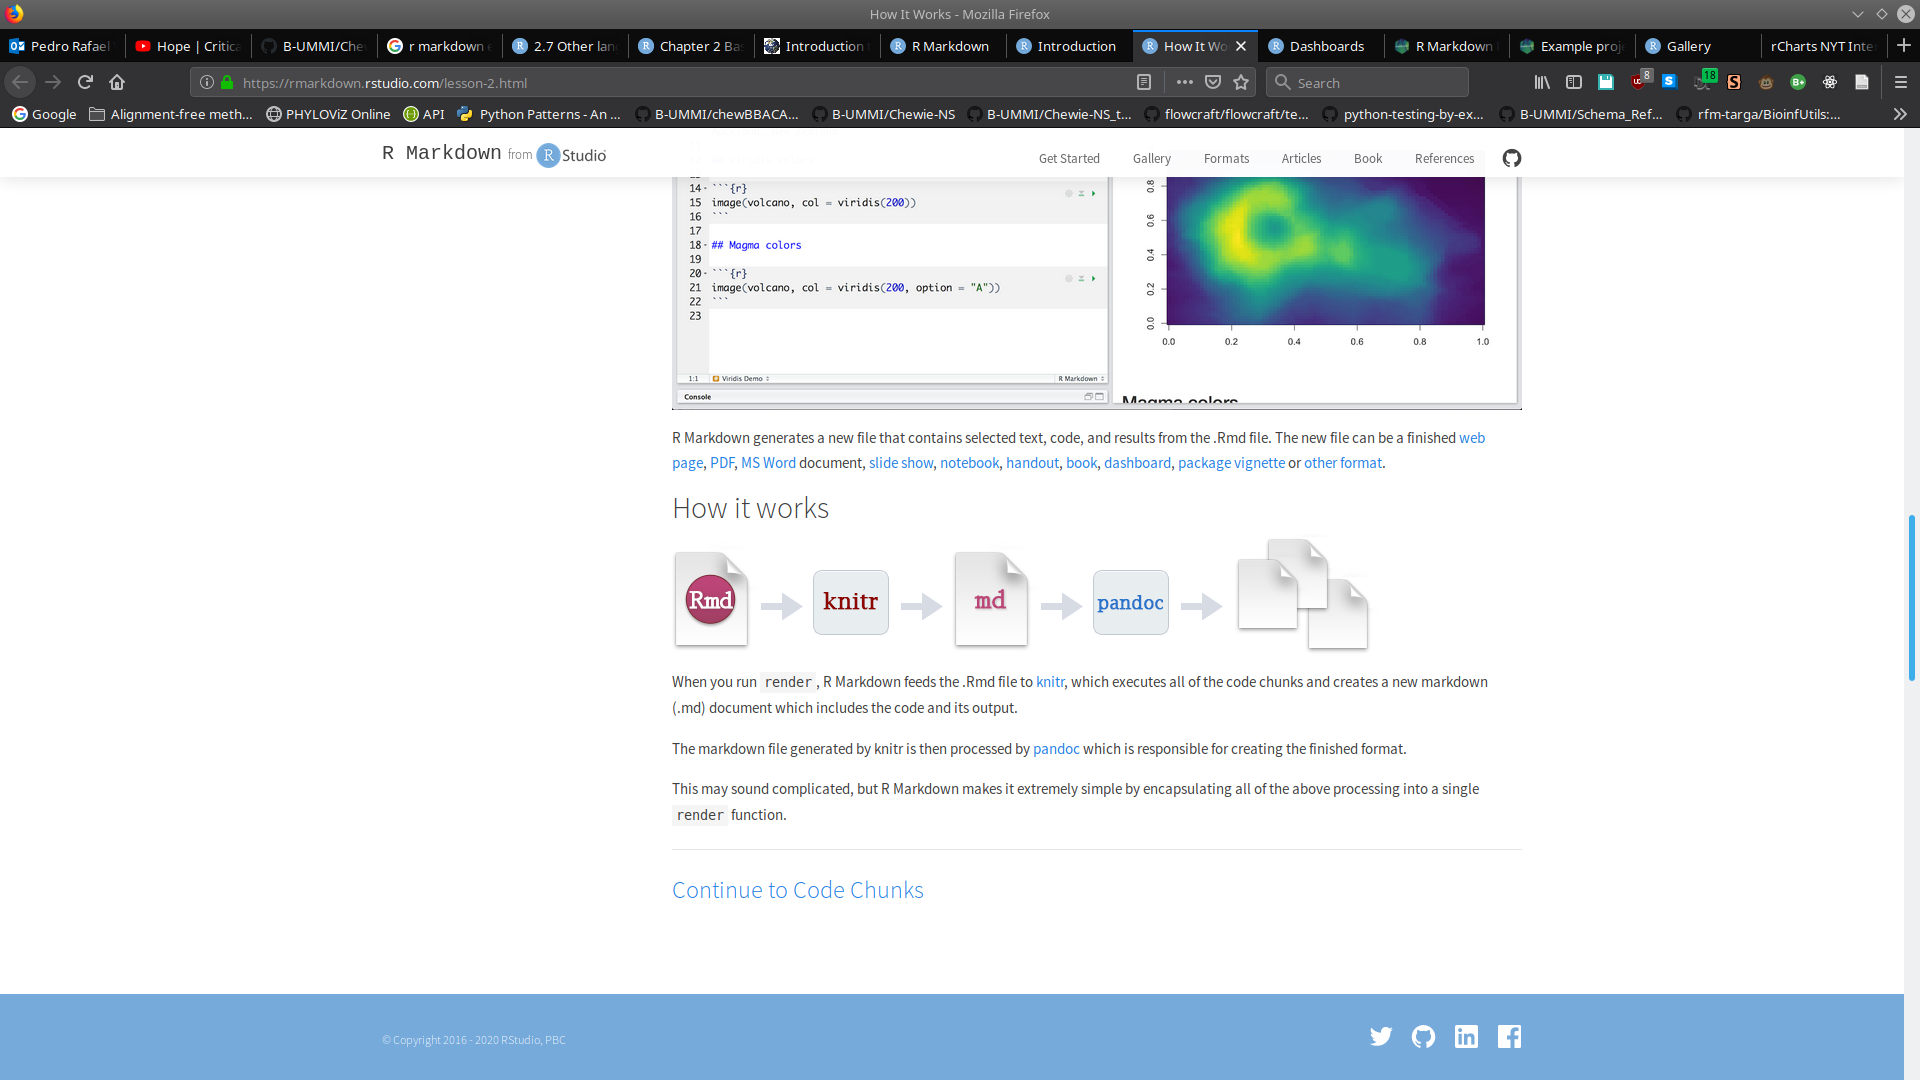
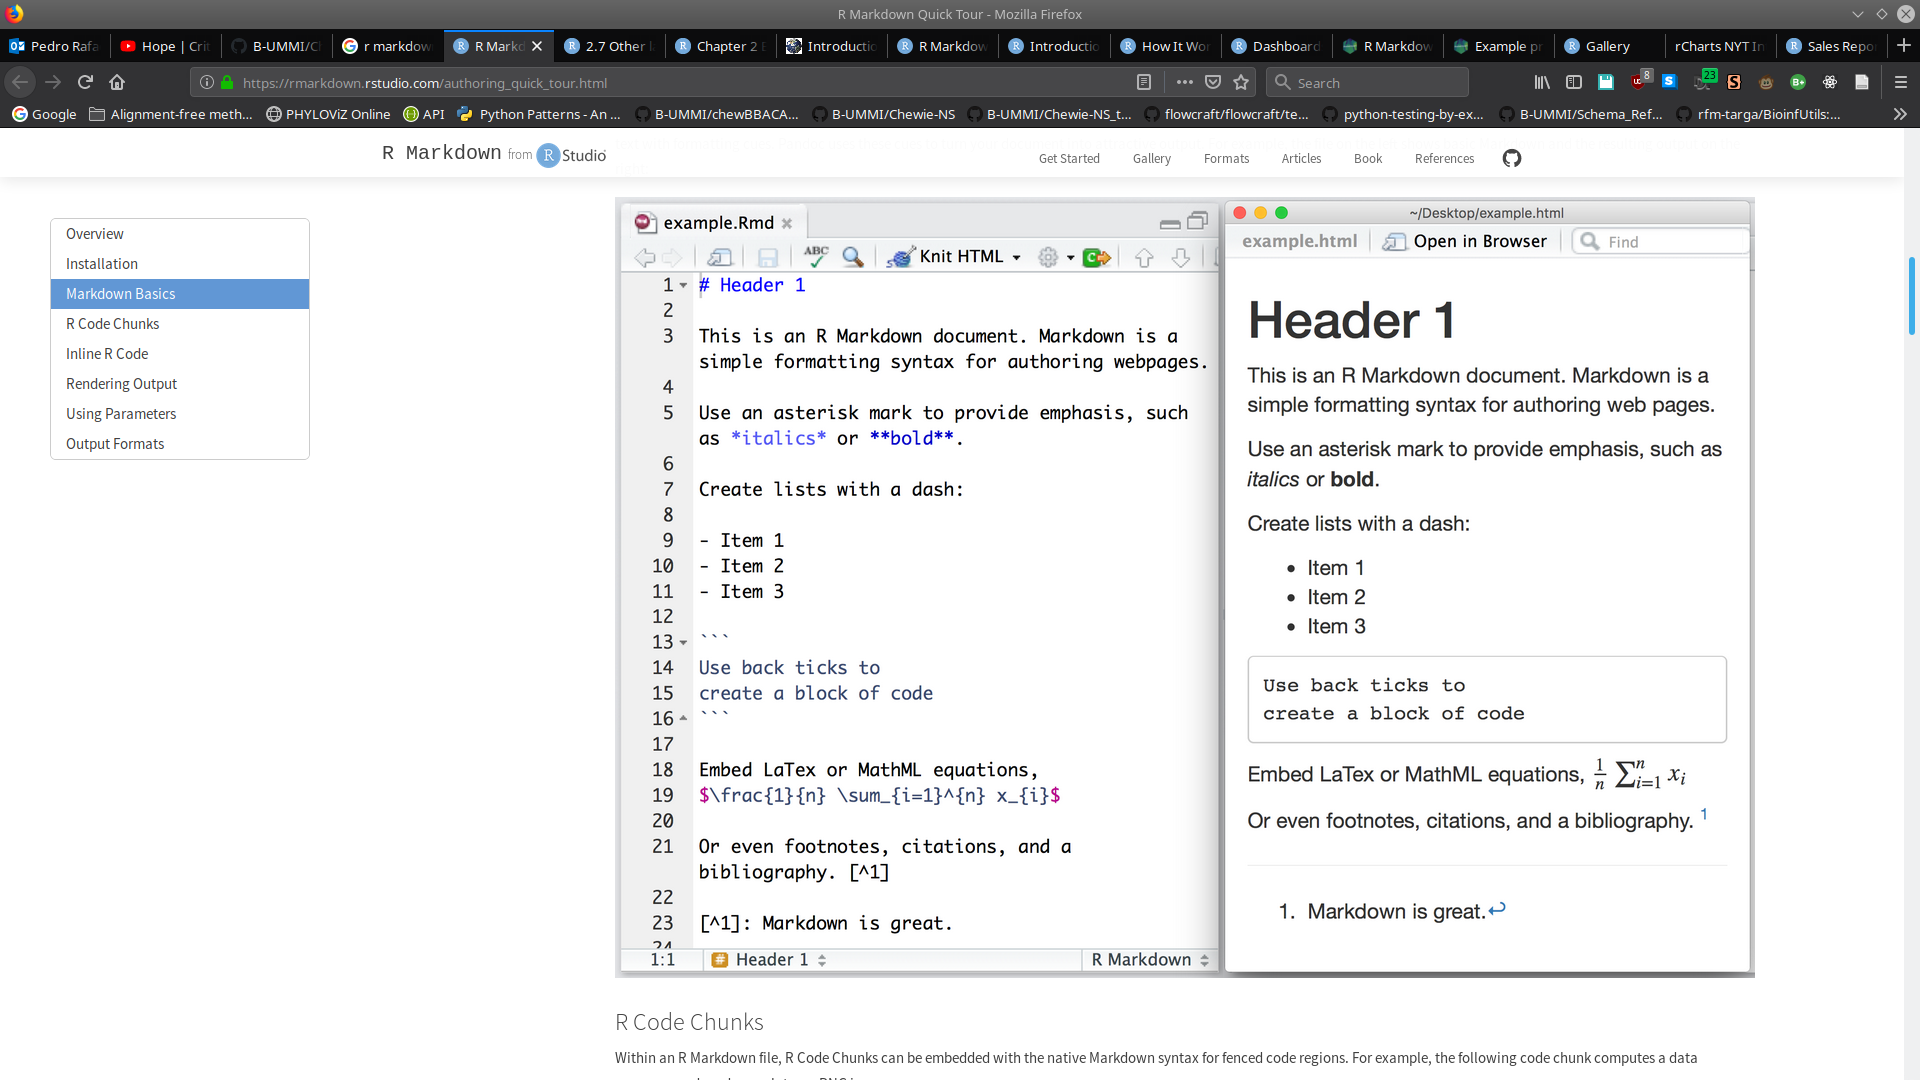
R Markdown
- R Markdown provides an authoring framework for data science.
- Easier reproducibility.
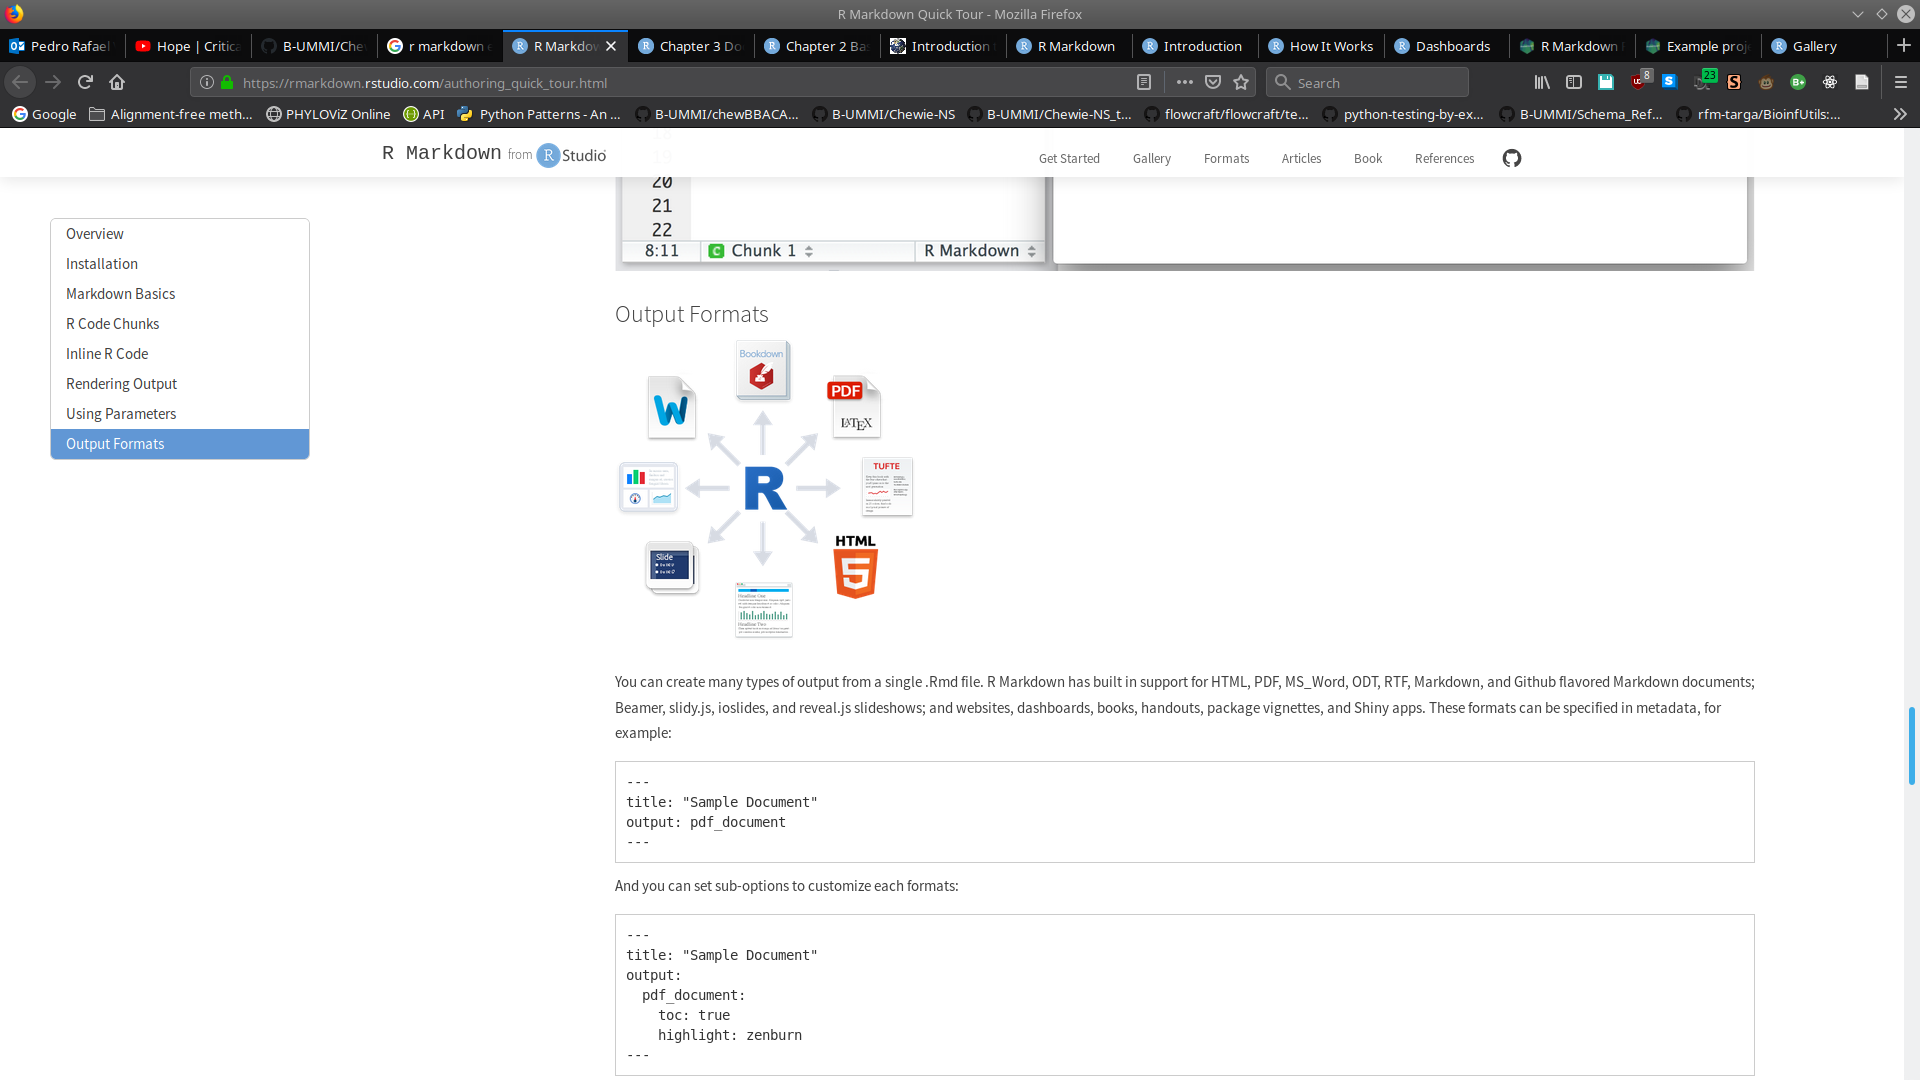
- Various output formats.

R Markdown
R Markdown
## A Python chunk

This works fine and as expected.

```{python}
x = 42 * 2
print(x)
```

## Modify a Python variable

```{python}
x = x + 18
print(x)
```

Retrieve the value of `x` from the Python session again:

```{r}
py$x
```

Assign to a variable in the Python session from R:

```{r}
py$y = 1:5
```

## Python graphics

You can draw plots using the **matplotlib** package in Python.

```{python}
import matplotlib.pyplot as plt
plt.plot([0, 2, 1, 4])
plt.show()
```
R Markdown
R Markdown
- R Markdown provides an authoring framework for data science.
- Easier reproducibility.
- Various output formats.
Can it be shared?
YES!
Summary
- Dash and Streamlit are good options for fast reports, but the local server prevents them from being shared.
- React provides several components create a user-friendly UI, however, updates to the layout may prove to be complex.
- R Markdown has the versatility and flexibility to easily create and maintain a report with data from several sources.
https://github.com/B-UMMI/Chewie-NS

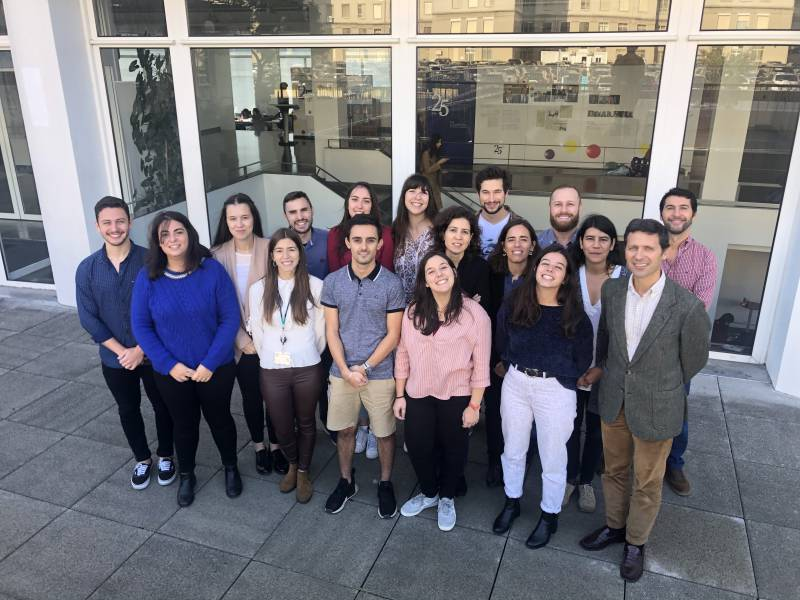
Special thanks to Rafael Mamede, Inês Mendes, Mickael Silva, João André Carriço and Mário Ramirez.
https://github.com/B-UMMI/chewBBACA
Thank you for your attention!
https://github.com/B-UMMI/Chewie-NS_tutorial