Blaze (not) in-depth
numpy + pandas for datasets larger than memory
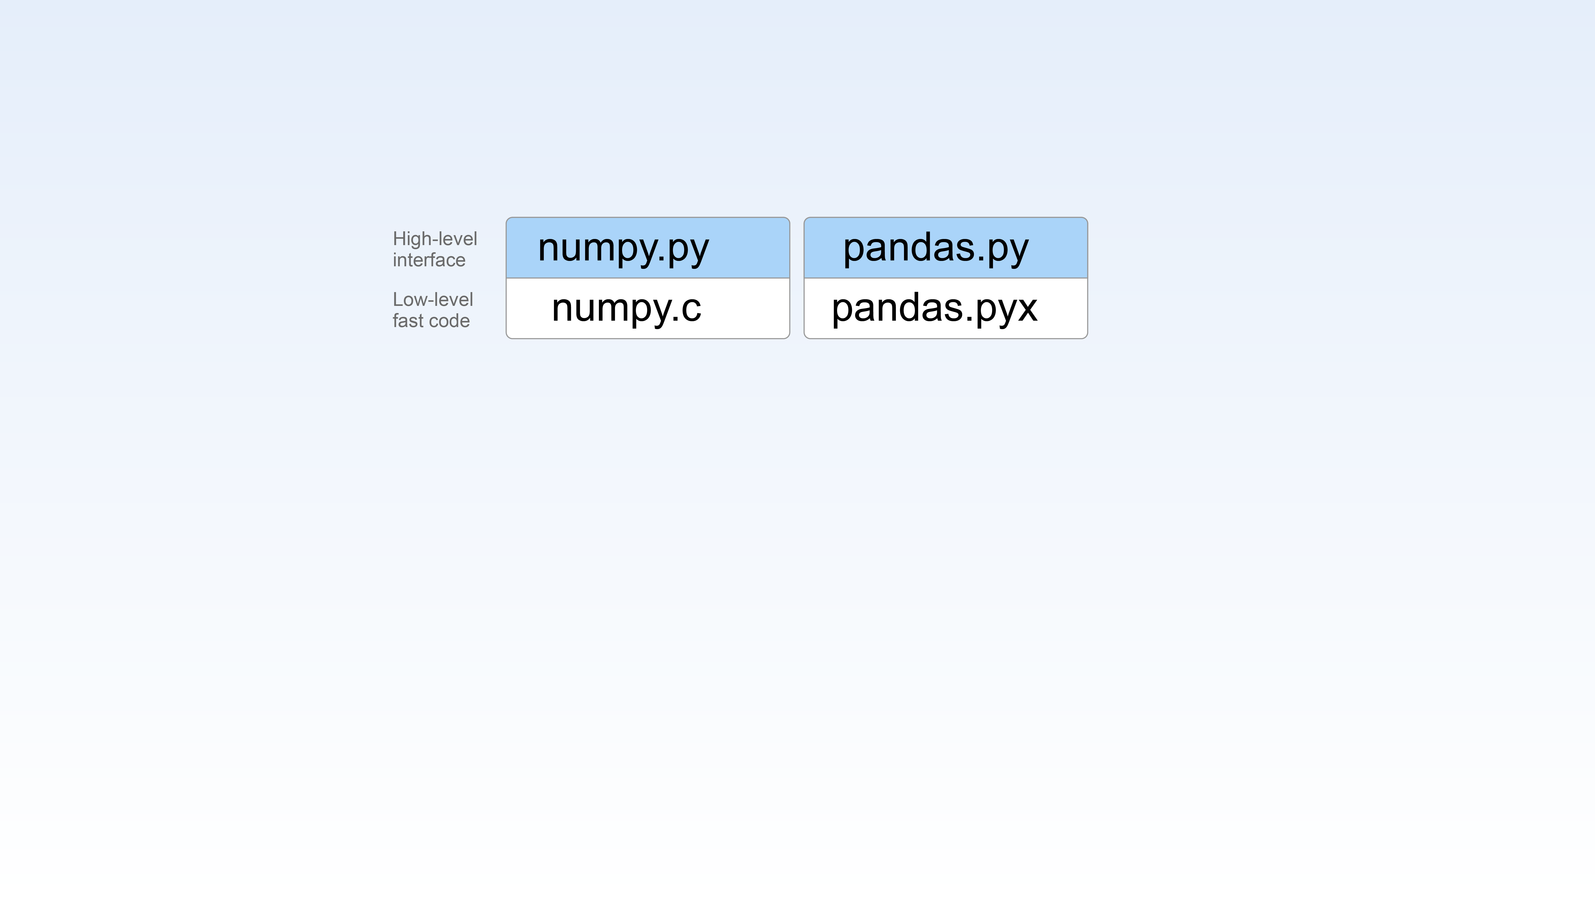
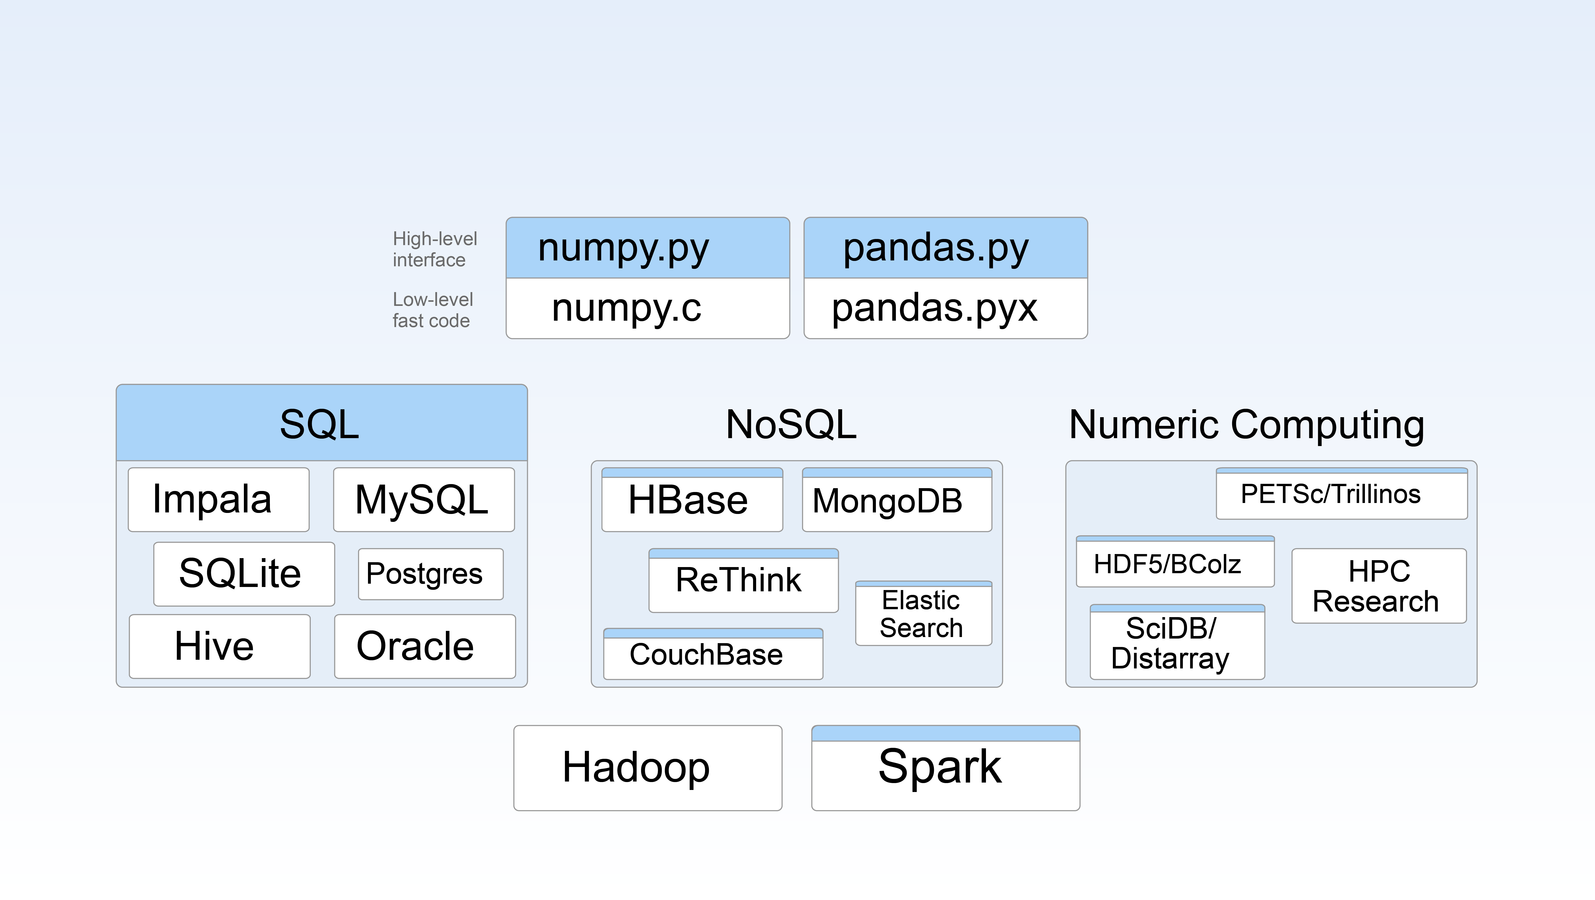
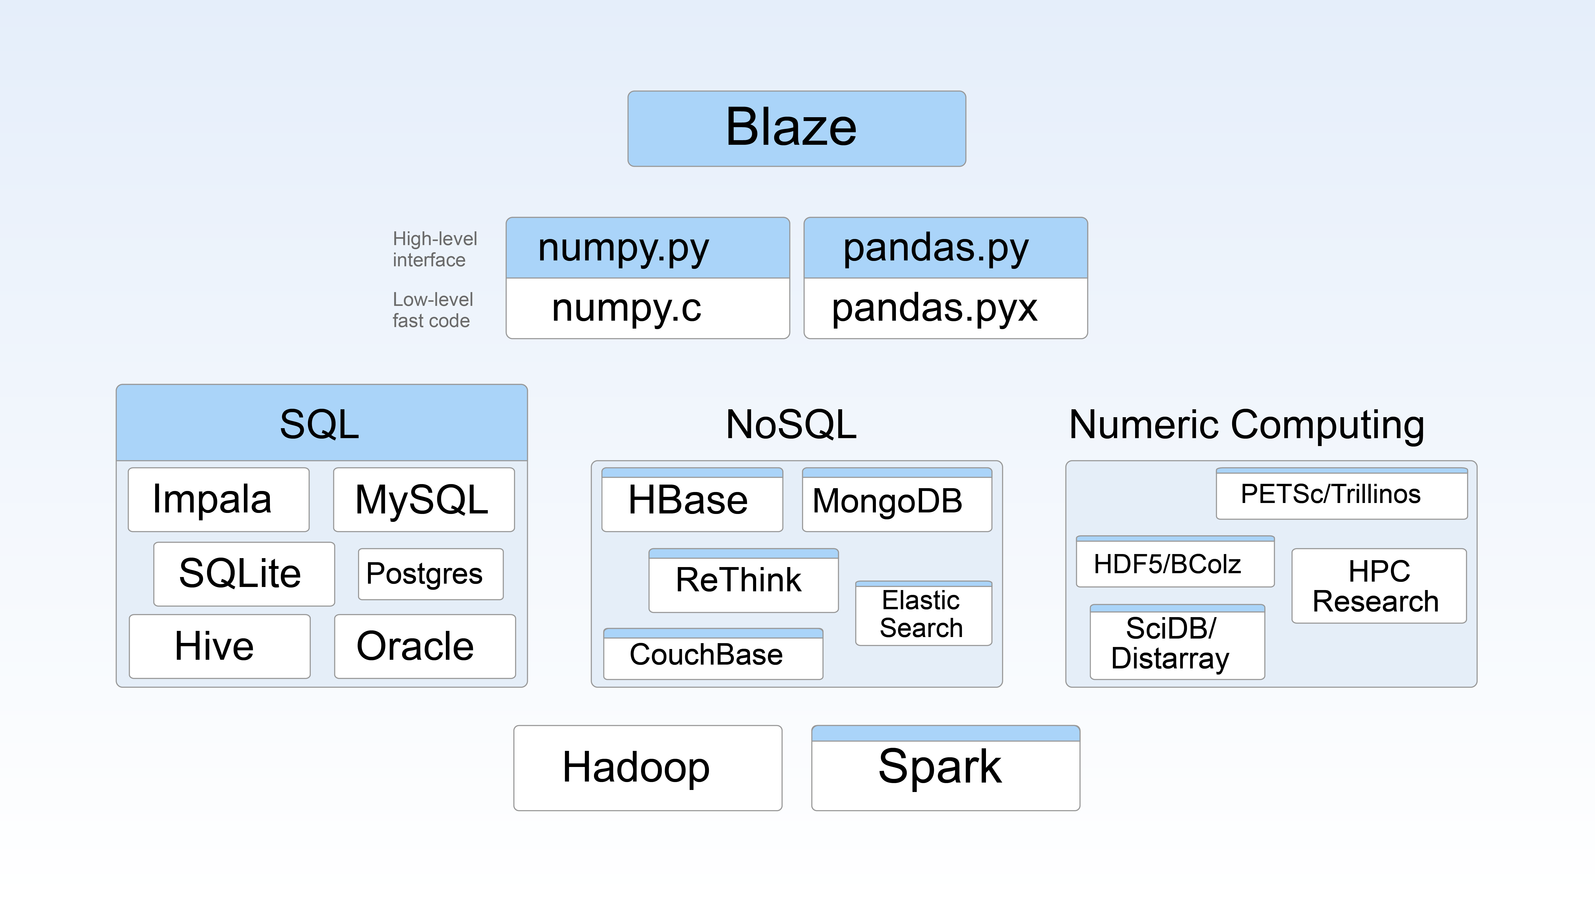
Blaze in Pictures
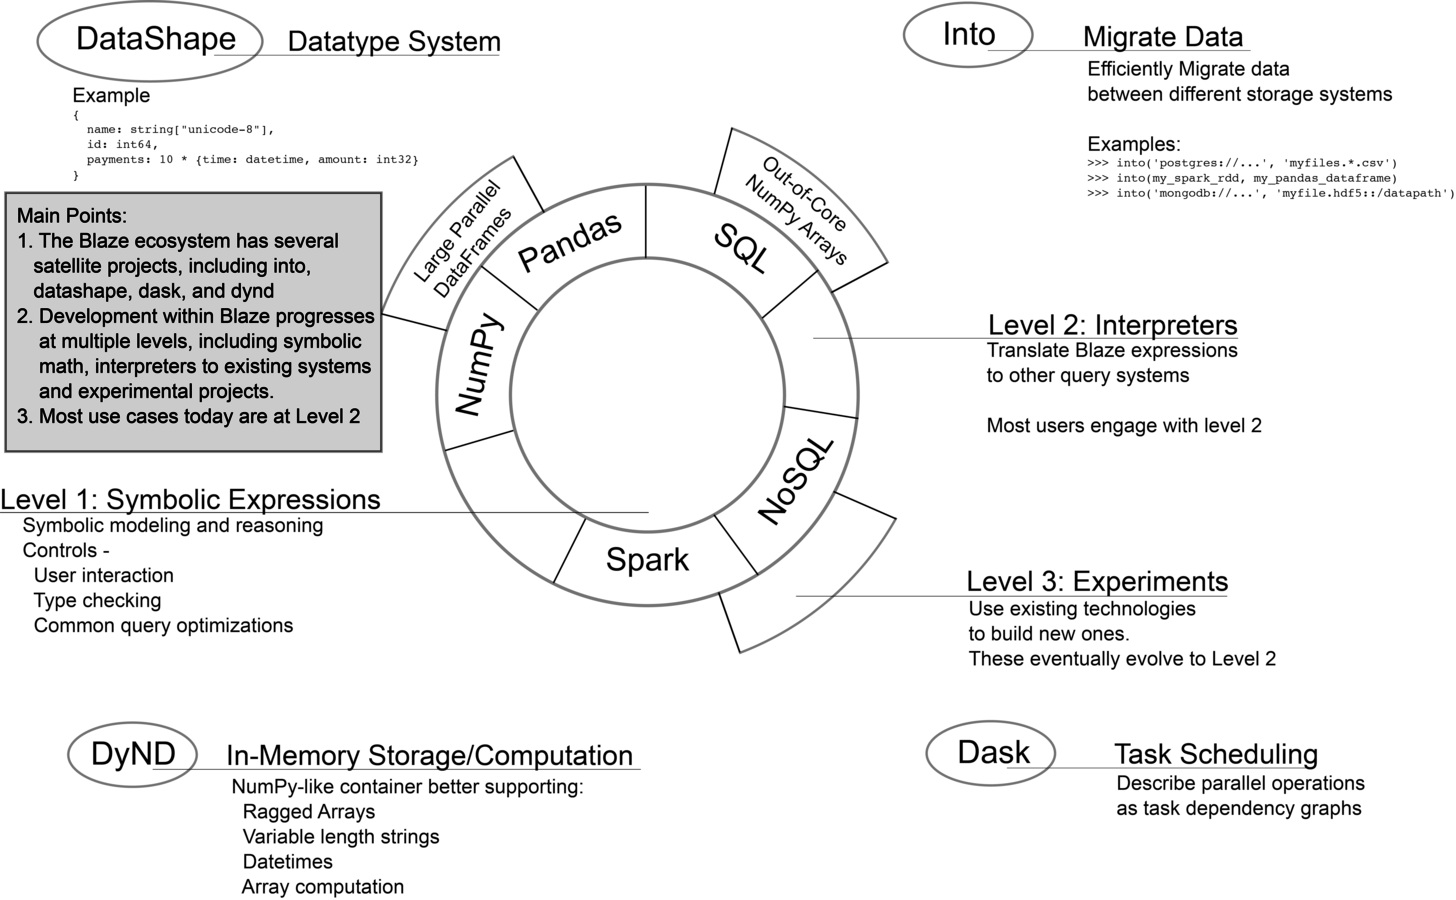
IDEAL: pandas-like workflow, BUT not in pandas
- Spark
- Impala
- Other potentially-large-data systems ...
Pandas
select avg(account) from df group by namedf.groupby('name').account.mean()SQL
SPARK
Different systems express things differently
df.groupBy(df.name).agg({'mean': 'amount'})LET blaze drive it for you
To the notebook!
into the rabbit hole!
Expressions
Ask questions about your data
Expressions
Blaze expressions describe our data. They consist of symbols and operations on those symbols
>>> from blaze import symbol
>>> t = symbol('t', '1000000 * {name: string, amount: float64}')
datashape = shape + type info
symbol name
"t is a one million row table with a string column called 'name' and a float64 column called 'amount'"
MOar ExpressioNS!
>>> by(t.name, avg=t.amount.mean(), sum=t.amount.sum())Split-apply-combine
Join
>>> join(s, t, on_left='name', on_right='alias')Many more...
- Arithmetic (can use numba here)
- Reductions (nunique, count, etc.)
- We take requests!
Data
Bits and Bytes
resources
-
resource
- Regex dispatcher
- resource('*.csv') -> CSV object
- resource('postgresql://...') -> sqlalchemy table
- resource('foo.bcolz') -> ctable or carray
- Lets you get to your data quickly
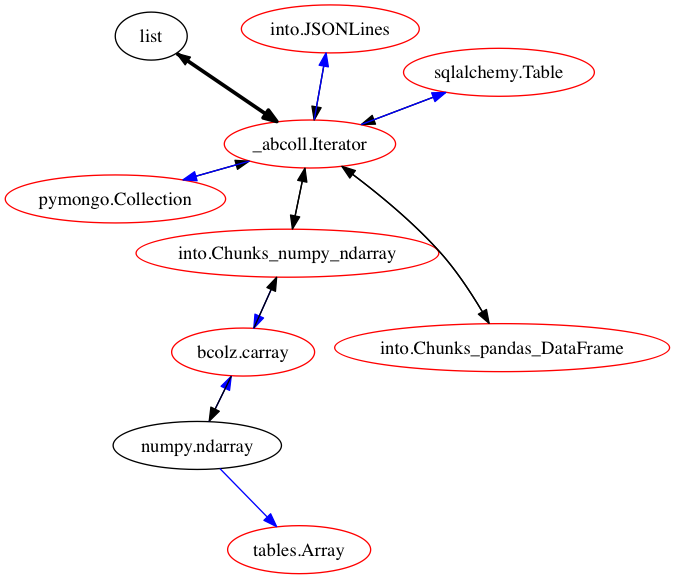
we also need to be able to go between different systems
Migrations with odo
- go from a thing of type B -> thing of type A
- e.g., numpy array to sqlalchemy table
- get the least cost conversion path from B -> A
- uses networkx
- alleviates us having to write every single conversion from A <-> B
- Difficult to test all conversions

numpy arrays

Dataframes

Generic iterators
Performance?
Yes, please
Currently, we can express simple parallelism by chunking
how does this work?
Chunking
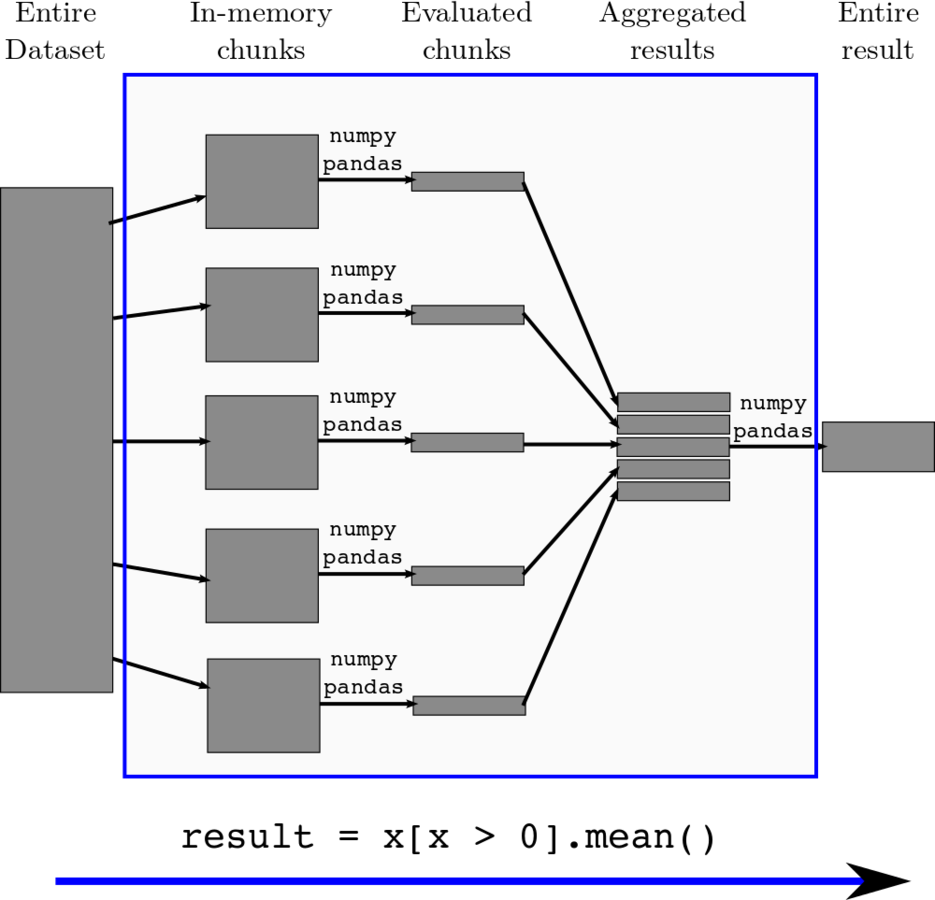
SUPPOSE WE HAVE A LARGE ARRAY OF INTEGERS
x = np.array([5, 3, 1, ... <one trillion numbers>, ... 12, 5, 10])A trillion numbers
How do we compute the sum?
x.sum()Define the problem in Blaze
>>> from blaze import symbol
>>> x = symbol('x', '1000000000 * int')
>>> x.sum()
sum by chunking
size = 1000000
chunk = x[size * i:size * (i + 1)]
aggregate[i] = chunk.sum()aggregate.sum()>>> from blaze.expr.split import split
>>> split(x, x.sum())
((chunk, sum(chunk)),
(aggregate, sum(aggregate)))Sum of aggregated results
Sum of each chunk
Count by chunking
size = 1000000
chunk = x[size * i:size * (i + 1)]
aggregate[i] = chunk.count()aggregate.sum()>>> from blaze.expr.split import split
>>> split(x, x.count())
((chunk, count(chunk)),
(aggregate, sum(aggregate)))Sum of aggregated results
Count of each chunk
mean by chunking
size = 1000000
chunk = x[size * i:size * (i + 1)]
aggregate.total[i] = chunk.sum()
aggregate.n[i] = chunk.count()aggregate.total.sum() / aggregate.n.sum()>>> from blaze.expr.split import split
>>> split(x, x.mean())
((chunk, summary(count=count(chunk), total=sum(chunk))),
(aggregate, sum(aggregate.total)) / sum(aggregate.count))Sum the total and count then divide
Sum and count of each chunk
number of occurrences by chunking
size = 1000000
chunk = x[size * i:size * (i + 1)]
by(chunk, freq=chunk.count())by(aggregate, freq=aggregate.freq.sum())>>> from blaze.expr.split import split
>>> split(x, by(x, freq=x.count())
((chunk, by(chunk, freq=count(chunk))),
(aggregate, by(aggregate.chunk, freq=sum(aggregate.freq))))Split-apply-combine on concatenation of results
Split-apply-combine on each chunk
n-dimensional reductions
>>> points = symbol('points', '10000 * 10000 * 10000 * {x: int, y: int}')>>> expr = (points.x + points.y).var(axis=0)
>>> split(points, expr, chunk=chunk)
((chunk,
summary(n = count( chunk.x + chunk.y ),
x = sum( chunk.x + chunk.y ),
x2 = sum((chunk.x + chunk.y) ** 2))),
(aggregate,
(sum(aggregate.x2) / (sum(aggregate.n)))
- ((sum(aggregate.x) / (sum(aggregate.n))) ** 2)))Variance of x + y
Chunk: a cube of a billion elements
Data: a 10000 by 10000 by 10000 array of (x,y) coordinates
>>> chunk = symbol('chunk', '1000 * 1000 * 1000 * {x: int, y: int}')This works on many things people want to with pandas
...except sort and joins
nyc taxi dataset notebook
Thanks!
- ContinuumIO: http://continuum.io
- Blaze team: http://blaze.pydata.org
- Alex Rubinsteyn, hammerlab and Mount Sinai for hosting
Questions?
Interpreter structure
compute core:
-
before execution
- optimize
- expression optimizations
- pre_compute
- beginning of the pipeline
- optimize
- execution
- compute_down
- operate on the whole expression
- pre_compute
- something has changed type
- compute_up
- Individual node in the expression
- compute_down
-
After execution
- post_compute
- most of the time this doesn't do anything
- SQL backend is notable
- post_compute
compute core:
- pre_compute all leaves
- optimize
- compute_down if the implementation exists
- bottom up traversal of the expression tree until we change data types significantly or we've reached the root node
- optimize and pre_compute
- go to 3
- post_compute
-- manipulate the data before execution
pre_compute :: Expr, Data -> Data

-- manipulate the expression before execution
optimize :: Expr, Data -> Expr

-- do something with the entire expression before calling compute_up
compute_down :: Expr, Data -> Data

-- compute a single node in our expression tree
compute_up :: Expr, Data -> Data

-- do something after we've traversed the tree
post_compute :: Expr, Data -> Data

-- run the interpreter
compute :: Expr, Data -> Data
compute core:
SOME NICE DOCS
- how compute works: http://blaze.pydata.org/docs/dev/expr-compute-dev.html
- pipeline: http://blaze.pydata.org/docs/dev/computation.html
pytables backend Example
>>> @dispatch(Selection, tb.Table)
... def compute_up(expr, data):
...     s = eval_str(expr.predicate)  # Produce string like 'amount < 0'
...     return data.read_where(s)     # Use PyTables read_where method

>>> @dispatch(Head, tb.Table)
... def compute_up(expr, data):
...     return data[:expr.n]          # PyTables supports standard indexing

>>> @dispatch(Field, tb.Table)
... def compute_up(expr, data):
...     return data.col(expr._name)  # Use the PyTables .col method