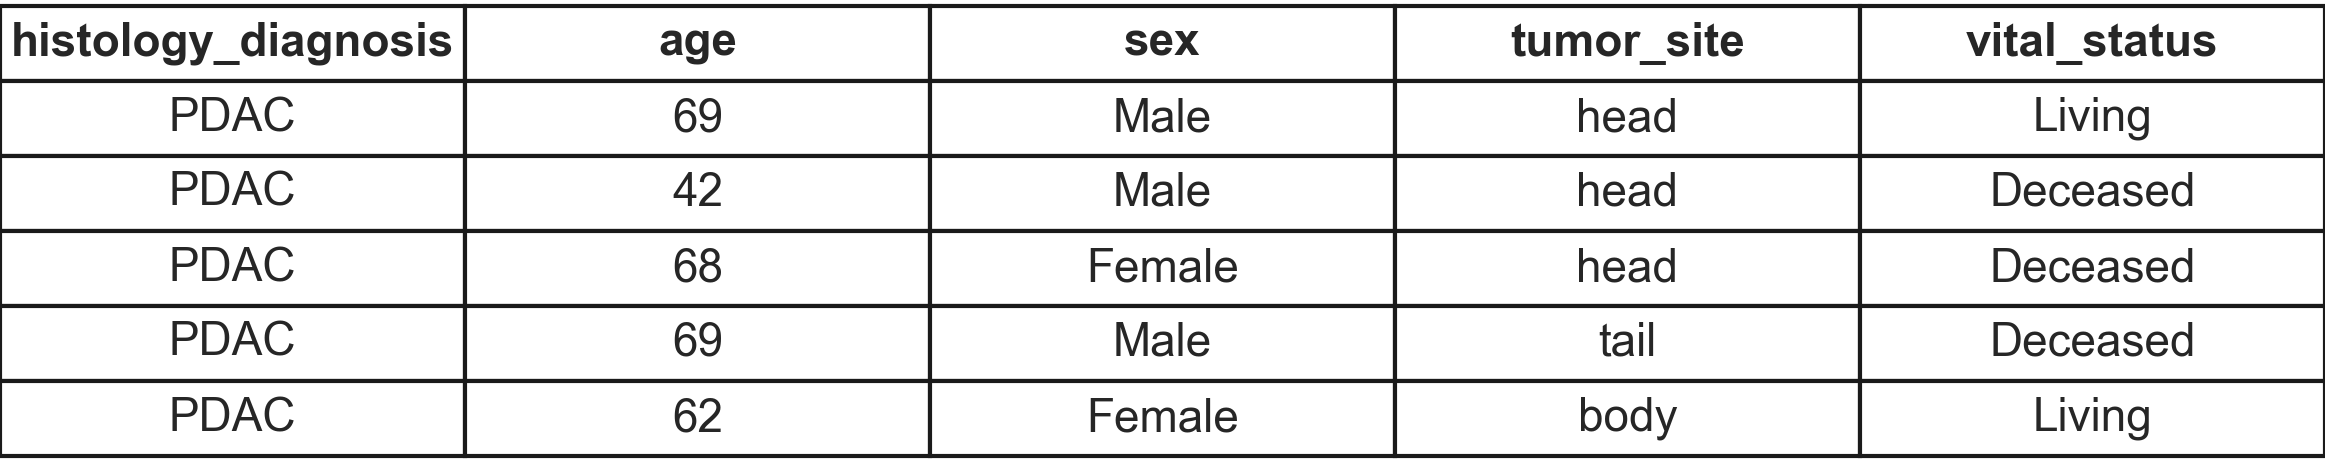
Clinical data
PDAC and ASC
Data imputation
Data imputation
Data imputation
Single imputation
Data imputation
Single imputation
Robust, simple to implement and effective when outliers are present
Data imputation
Single imputation
Robust, simple to implement and effective when outliers are present
- mean
- median
- mode
- constant
- hot-deck
Data imputation
Single imputation
Multiple imputation
Robust, simple to implement and effective when outliers are present
- mean
- median
- mode
- constant
- hot-deck
Data imputation
Single imputation
Multiple imputation
Robust, simple to implement and effective when outliers are present
- mean
- median
- mode
- constant
- hot-deck
Captures imputation variability, suitable for complex datasets
Data imputation
Single imputation
Multiple imputation
Robust, simple to implement and effective when outliers are present
- mean
- median
- mode
- constant
- hot-deck
Captures imputation variability, suitable for complex datasets
- MICE
- Bayesian
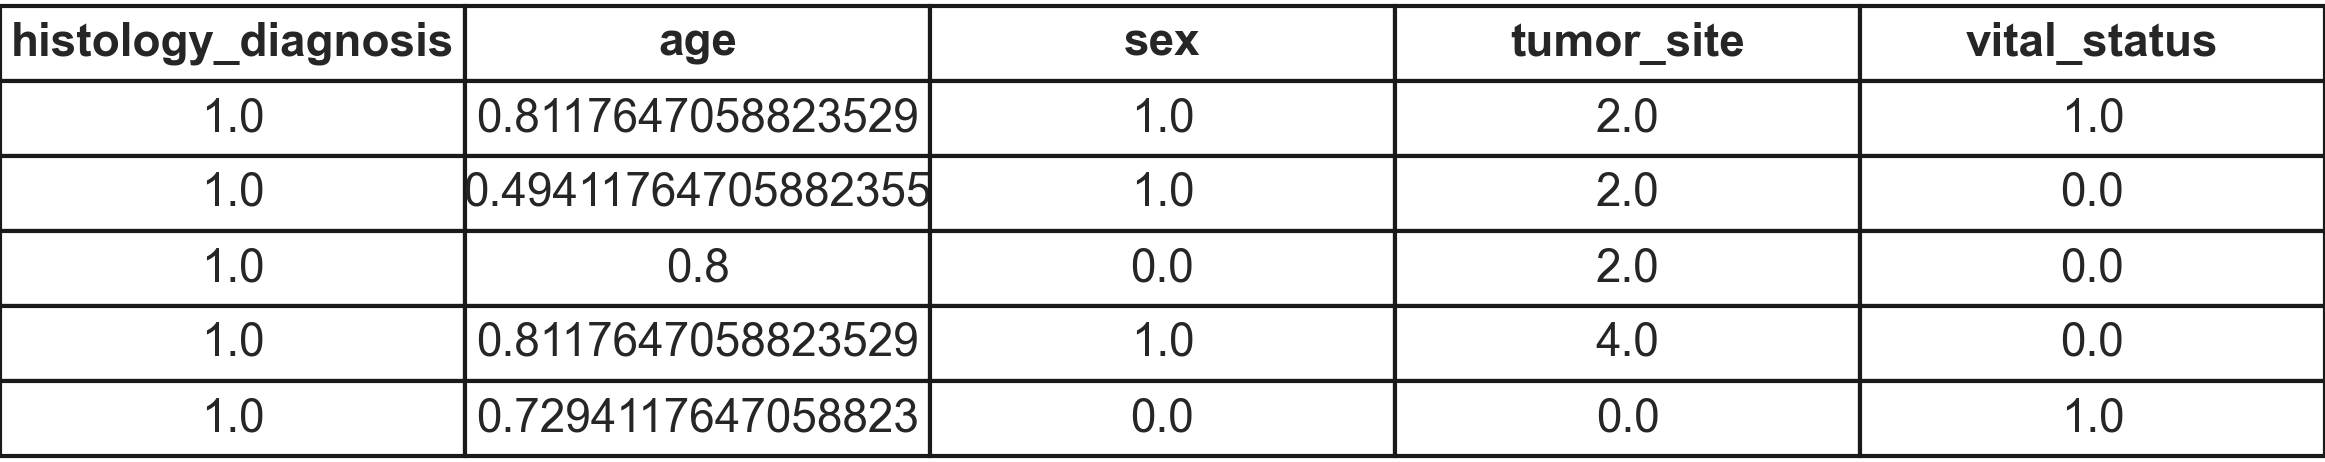
Data normalization
Data normalization
Scaling
Encoding
Continuous var.
Categorical var.
Data normalization
Scaling
Encoding
Continuous var.
Categorical var.
- StandardScaler
- MinMaxScaler
- MaxAbsScaler
- Normalizer
- OneHotEncoder
- LabelEncoder
- OrdinalEncoder
Dataset
Dataset
Dataset
Clustering
Clustering
Our goals:
- Identify natural groupings within the dataset;
- Compare the performance of Spectral Clustering and KMeans technique.
Clustering
Silhouette Score
The Silhoutte Score mesaures how similar a point is to its own cluster compare to other clusthers.
This method helps to identify the perfect value of k.
Clustering
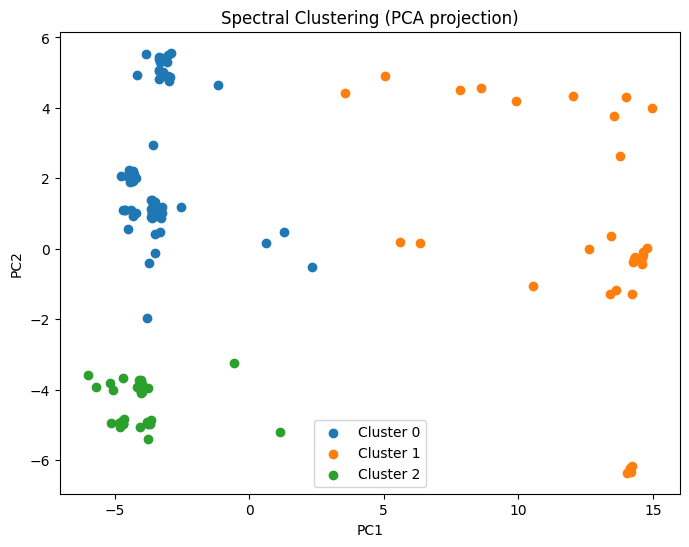
Spectral Clustering
Spectral Clustering builds a similarity graph between the points dividing them in clusters using the eigenvectors of the Laplacian.
Clustering
Spectral Clustering
Pros
- Works well when data has complex structure;
- Can detect non-linear and non-convex cluster shapes.
Cons
- Computationally expensive and not ideal for large dataset;
- Requires careful tuning of parameters.
Clustering
Spectral Clustering: PCA visualization
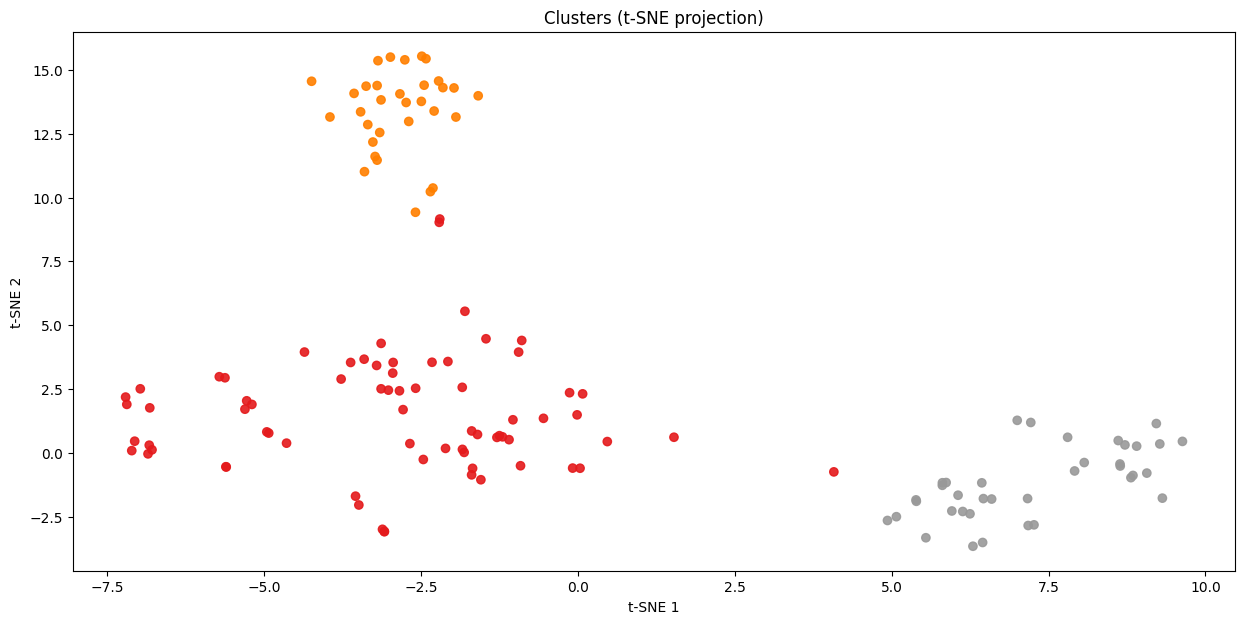
Clustering
Spectral Clustering: tSNE visualization
Clustering
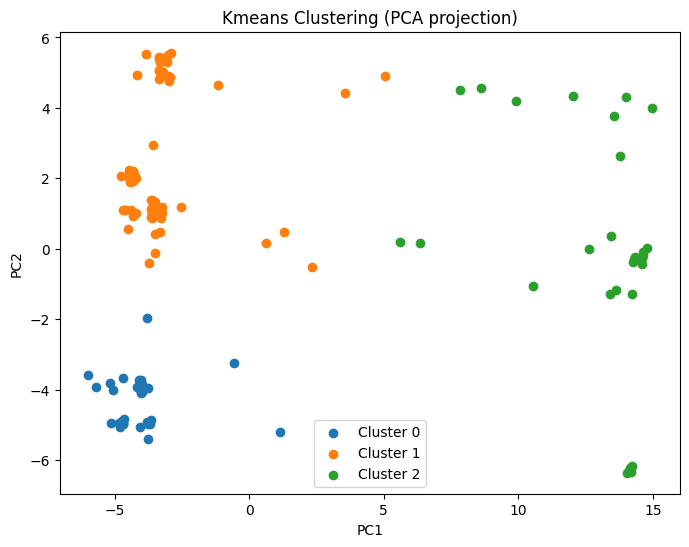
KMeans partitions data into k groups by minimizing the distance between points and their cluster's centroid.
KMeans
Clustering
KMeans
Pros
- Fast, efficient and works well with large datasets;
- Very simple to implement and easy to interpet.
Cons
- Assumes spherical and equally sized cluster, limiting flexibility;
- More sensitive to outliers and to the initial placement of centroids.
Clustering
KMeans: PCA visualization
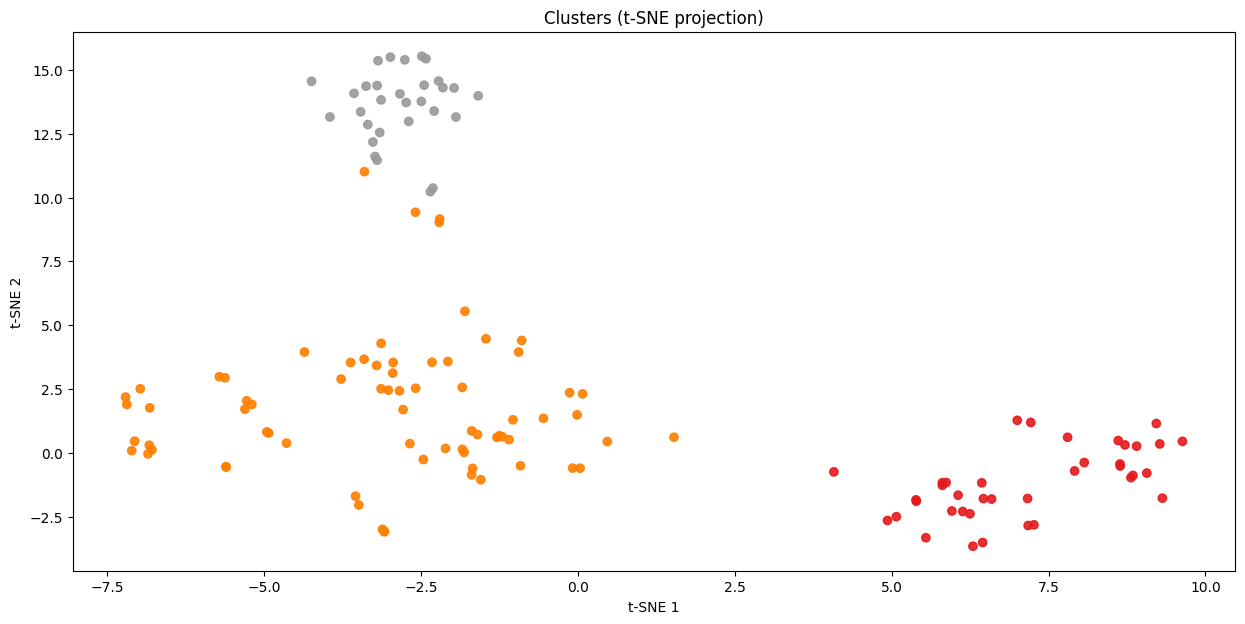
Clustering
KMeans: tSNE visualization
Clustering
Final thoughts
In summary, both methods identify very similar cluster, showing a consistent structure in the dataset.
However, the Spectral Clustering method provides a more accurate representation of the groupings in the data.
Feature prediction
Feature prediction
vital_status
Feature prediction
vital_status
Feature prediction
vital_status
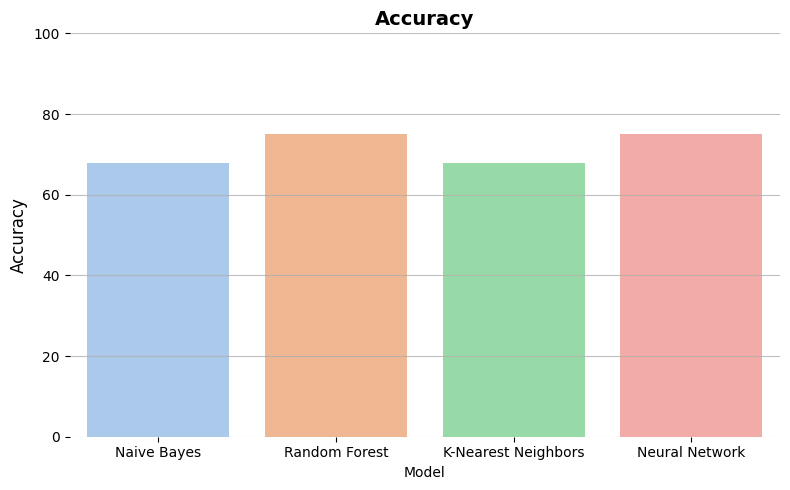
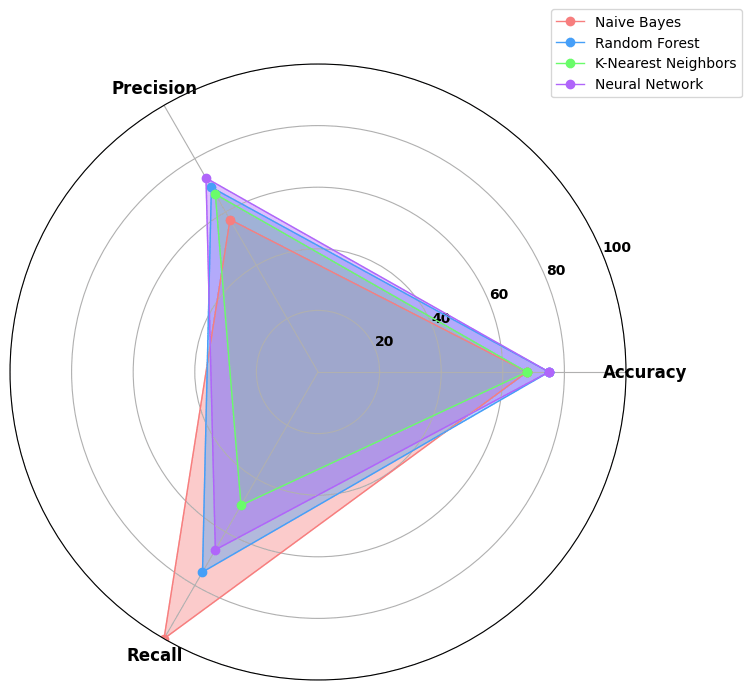
4 classifiers:
- Naive Bayes: the simplest one, but not accurate
- Random Forest: most used and resistent to noise
- K-Nearest Neighbors: versatile, but computationally espensive
- Neural Network: able to find complex relations, but
needs a large amount of data
Feature prediction
vital_status
4 classifiers:
- Naive Bayes
- Random Forest
- K-Nearest Neighbors
- Neural Network
Accuracy
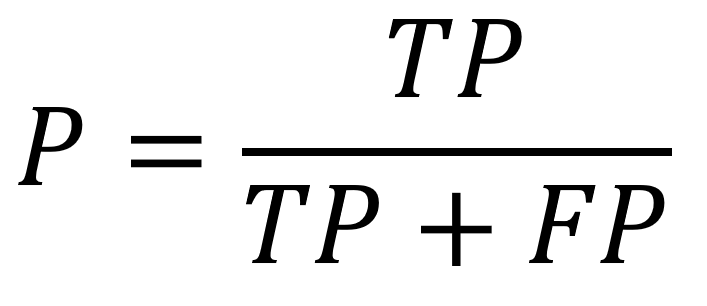
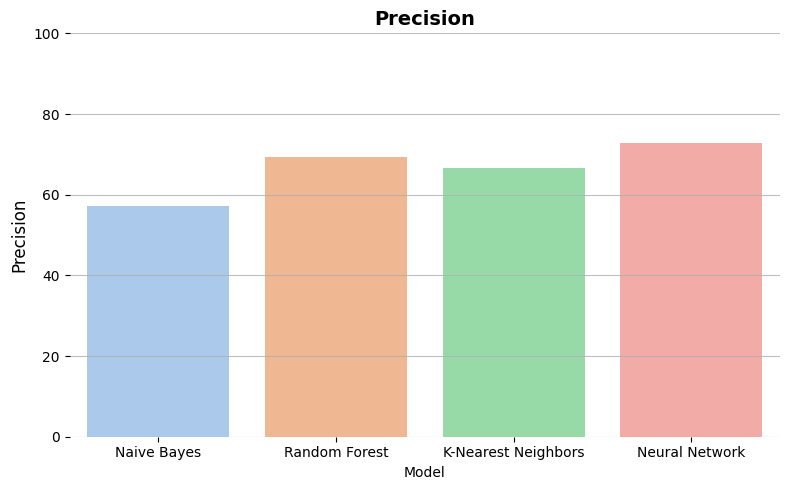
Precision
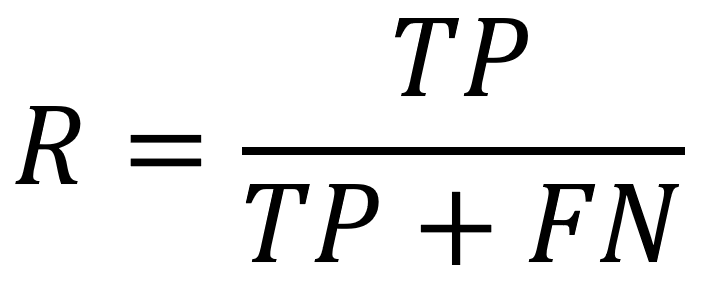
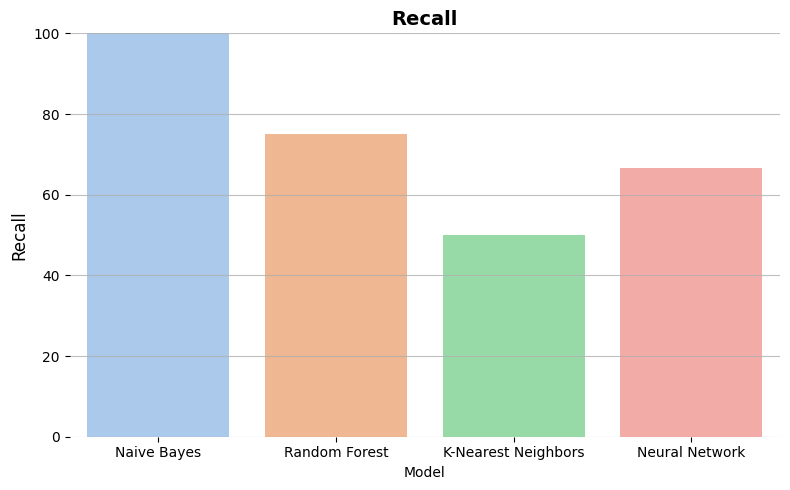
Recall
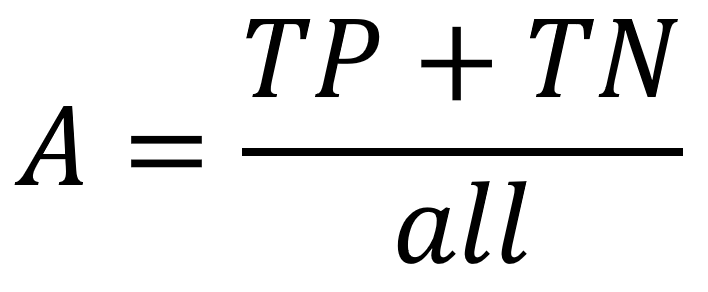
percentage of correct predictions over all the predictions
percentage of correct positive predictions over all the positive predictions
percentage of correct positive predictions over all the real positive predictions
Credits
Pietro Mondini
Nicolò Moroni - 84576A
Alessandro Crippa - 84583A