Strategies to identify strongly lensed type Ia supernovae in Rubin LSST
Prajakta Mane
BS-MS, IISER Mohali, India
Rubin Community Workshop 2024
Anupreeta More, Surhud More
IUCAA, India
23-07-2024
Time delay cosmography:
accurate time delays, surface mass distribution and redshift of lens
Hubble constant with strong lensing time delays
well-constrained Hubble Constant
Why are SNe Ia a better source for TDC?
-
well-studied light curves -> more accurate time delay measurements
-
transient source -> improved constraints on the lens galaxy model
-
standard candle nature -> help overcome degeneracies
How to find lensed SNe Ia?
DIA: run LSST Stack's difference imaging pipeline to identify multiply imaged SNe
CMA: study outliers in the colour-magnitude space for SNe to identify lensed SNe Ia
- Raw exposures from Subaru Hyper-Suprime Cam (HSC) -> Public Data Release 1
- UltraDeep Survey's COSMOS region, Tract number 9813 (~1.7 deg wide)
- 149 visits in grizy from 10 nights in 2014 and 2015: 16,688 CCD images
- LSST Science Pipeline w_2022_12
- Strong lensing positions, magnifications, and time delays simulated using a code adapted from More & More, 2022
- SNe light curves: SALT2 (Guy et al., 2007, 2010) template built in SNCosmo (Barbary et al., 2017) manually incorporating strong lensing observables
SNe light curve simulations
Sky data for DIA
Difference imaging analysis

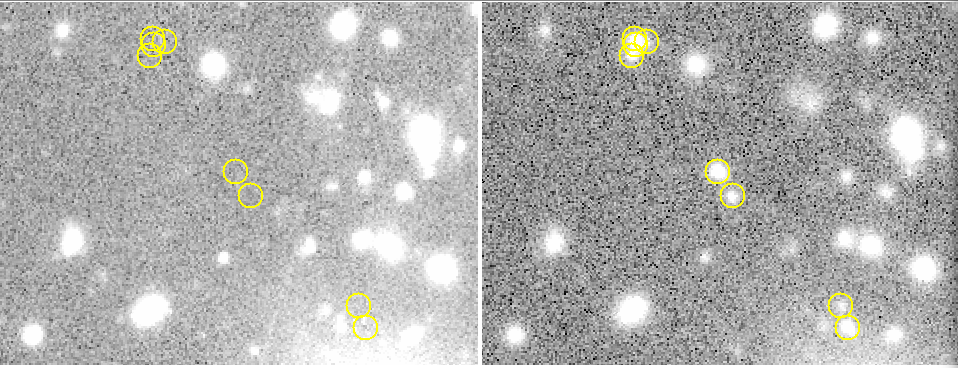
Template Image
Science Image
Difference Image
Yellow circles of radius 1": injected lensed SNe
Red circles of radius 2": diaSources
Difference imaging analysis
- Total recovery fraction ~70%
- Slightly higher for quads
- Decreases significantly for the y-band
| Injected | Detected | % recovery | |
|---|---|---|---|
| Total | 74k | 51.5k | 70 |
| Doubles | 70k | 48.3k | 70 |
| Quads | 4.1k | 3.2k | 78 |
| g | 310 | 260 | 83 |
| r | 5.4k | 4.7k | 86 |
| i | 14k | 11k | 80 |
| z | 21k | 16k | 76 |
| y | 34k | 20k | 58 |
Difference imaging analysis
Preliminary results
Unresolved detections: ~49k
Resolved detections: 1285
Color-magnitude analysis
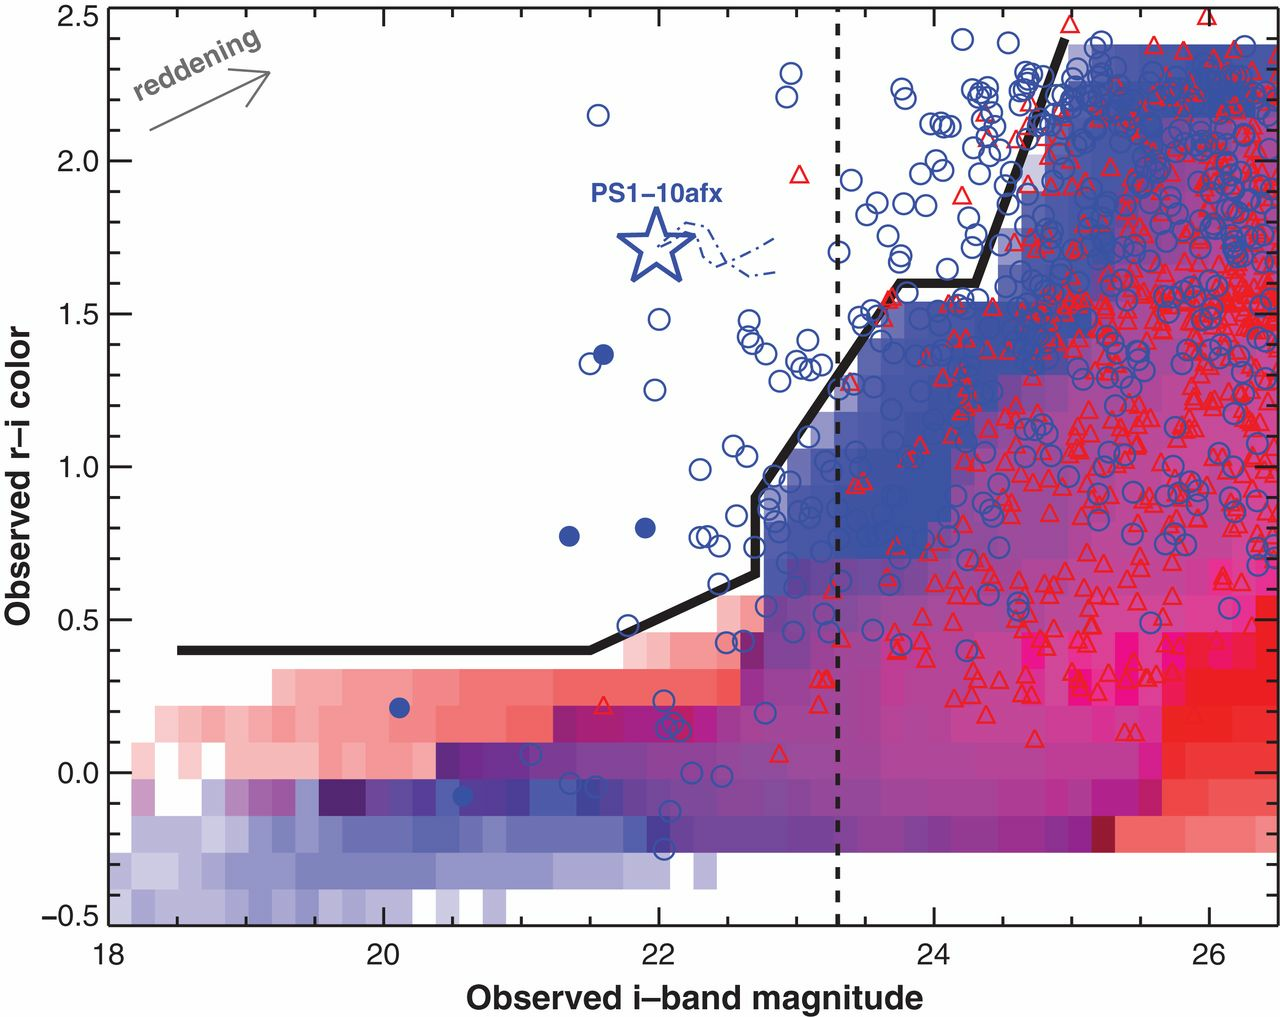
Quimby et al. 2014
: Unlensed SNIa
: Unlensed core collapse
: Lensed SNIa
: Lensed core collapse
The redder supernovae for given i-band magnitude are more likely to be lensed SNeIa when studied for unresolved photometry on rising phase of light curve.
The black bold curve separates the lensed SNeIa from unlensed both on the rising and the falling edge of light curve for z < 3

Simulated SNe Ia
Contamination from unlensed CC SNe is neglegible.
Contamination from CC SNe

Contamination from unlensed CC SNe is neglegible.
Primary contaminants are lensed SNe Ib and Ic.

Contamination from CC SNe
Summary so far...
- In the first run, the DI pipeline recovers ~70% of the injected lensed SNe Ia data. The recovery fraction decreases for fainter injected systems. It is slightly higher for quads and decreases significantly for HSC y-band.
- We observe a low resolved fraction, which is seen to be weakly correlated with the angular separation of the system for doubles.
- Colour-magnitude-based demarcation effectively selects lensed SNe Ia for simulated and observed (un-)lensed SNe Ia till redshift 3, both on rising and falling edge. Contamination from unlensed CC SNe is low. Primary contaminants are found to be lensed CC SNe Ib and Ic.
Ongoing work
- Study if extendedness can be used as a marker for a lensed system.
- Next DI run: Incorporate LSST cadence.
- Run it on DC2 data.
Thank You!
Holds well for the observed unlensed and lensed SNeIa.
Also eliminates the unlensed SLSNe sample.

Extra slide
Color-magnitude criteria employed on observed lensed SNe Ia and unlensed SNe Ia and SLSNe

vertical dashed line: median seeing

Variation of the recovery fraction with injected magnitudes and angular separation between images
Extra slide
Recovery fraction shows a 'cut-off magnitude' after which the fraction drops drastically. It also decreases significantly in the HSC-y band.
Resolved fraction is directly proportional to the angular separation of the system.
Template Image
Science Image
Difference Image
Yellow circles of radius 1": injected lensed SNe
Red circles of radius 2": diaSources


Extra slide
Difference image WITH the lens galaxy (not the best for visual representation!!)
Extra slide


Distribution of observables of the simulated lensed SNe Ia

Extra slide
Example of a simulated lensed SNe Ia light curve
Comaparison of unlensed CC SNe CMDs from low and high redshift

