PlotQA: Reasoning over Scientific Plots
Nitesh Methani*, Pritha Ganguly*, Mitesh M. Khapra, Pratyush Kumar
Department of Computer Science and Engineering,
Robert Bosch Centre for Data Science and AI
Indian Institute of Technology, Madras
* The first two authors contributed equally

Q: What is the total tuberculosis detection rate in Indonesia?
A: 101
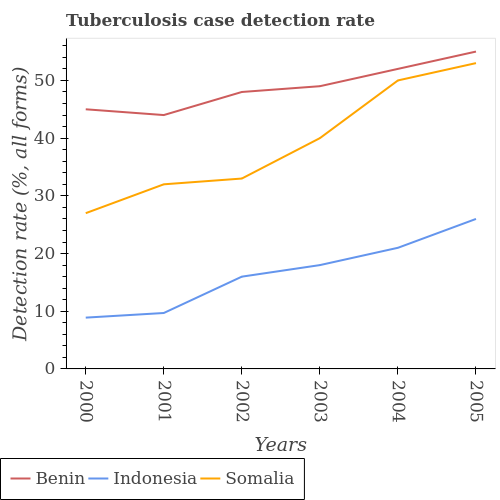
Q: In which year was the tuberculosis case detection rate of Somalia minimum?
A: 2000
Q: Across all years, what is the maximum tuberculosis case detection rate of Benin?
A: 55.46
Problem Statement
Our Contributions
- Novel PlotQA dataset comprising
- Hybrid Model comprising
224,377 scientific plots on data soured from real world
28.9 million questions based on templates sourced from manually curated crowdsourced questions
questions which have answers from an Open Vocabulary
perception and QA modules for questions that have answers from an Open Vocabulary
achieves best performance on both PlotQA and DVQA dataset
FigureQA vs DVQA vs PlotQA
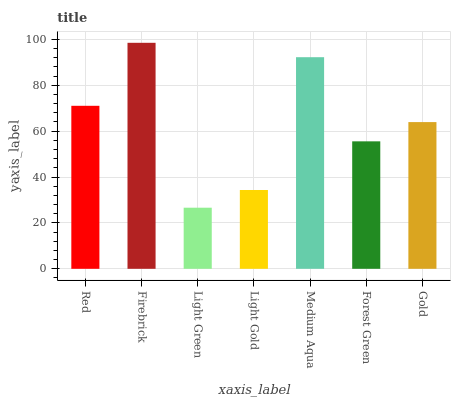
Q: Is Light Green the minimum?
A: 1.0
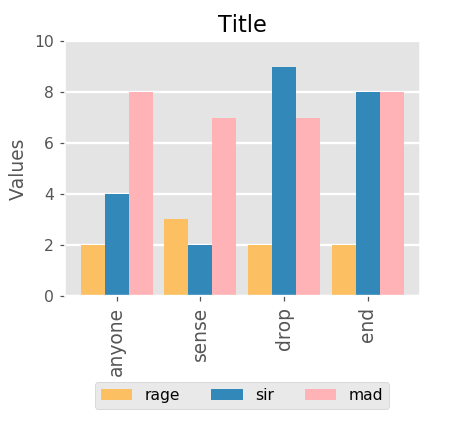
Q: What is the value of mad in drop?
A: 7
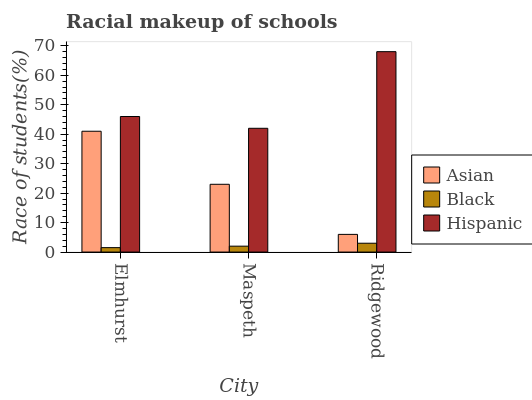
Q: What is the average number of Hispanic students in school?
A: 51.67
FigureQA
DVQA
PlotQA
FigureQA vs DVQA vs PlotQA
FigureQA
DVQA
PlotQA
Dataset Creation
Collection
& Curation
Plot
Generation
Question
Collection
Templatization & Instantiation
- Crawled data from World Bank, Open Gov. Data.
- Extracted 841 unique variables whose relations could then be plotted with 160 unique entities.
- Data comprises positive, floating-point & percentage values on a linear scale.
- Generated bar plots, line plots and dot-line plots using different combinations of indicator variables.
- Ensured variety in the plots by randomly choosing various plot elements like line/marker style, etc.
- Sampled 1,400 plots across different types and asked crowd sourced workers on AMT to create questions.
- Instructed the workers to ask complex reasoning questions which involved reference to multiple plot elements.
- Analysed the crowd sourced questions and divided into 74 templates.
- Further, divided into 3 categories, namely, Structural, Reasoning and Data Retrieval.
- Each template was then manually paraphrased with the help of in-house annotators.
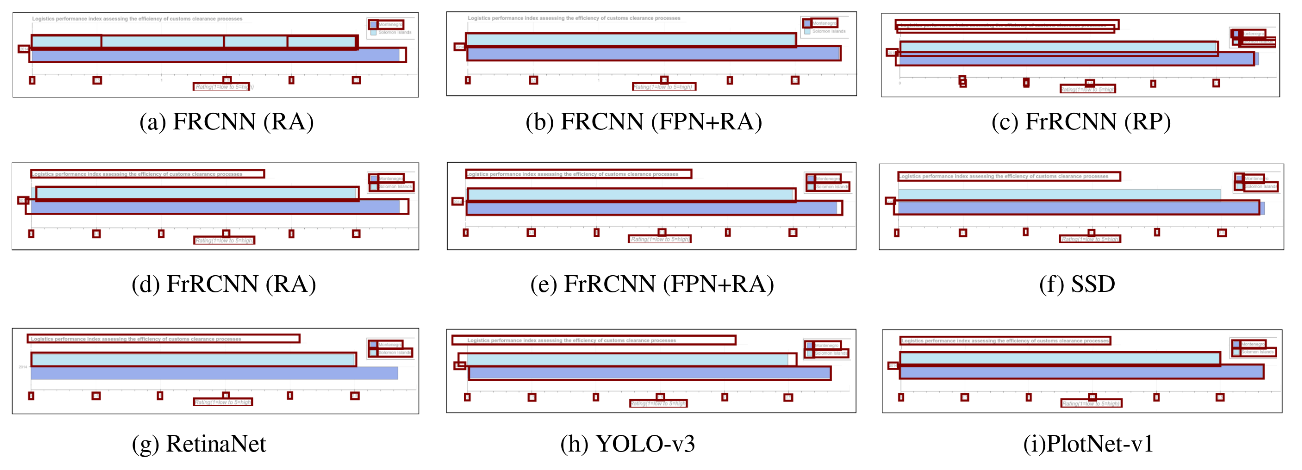
Multistage Pipeline
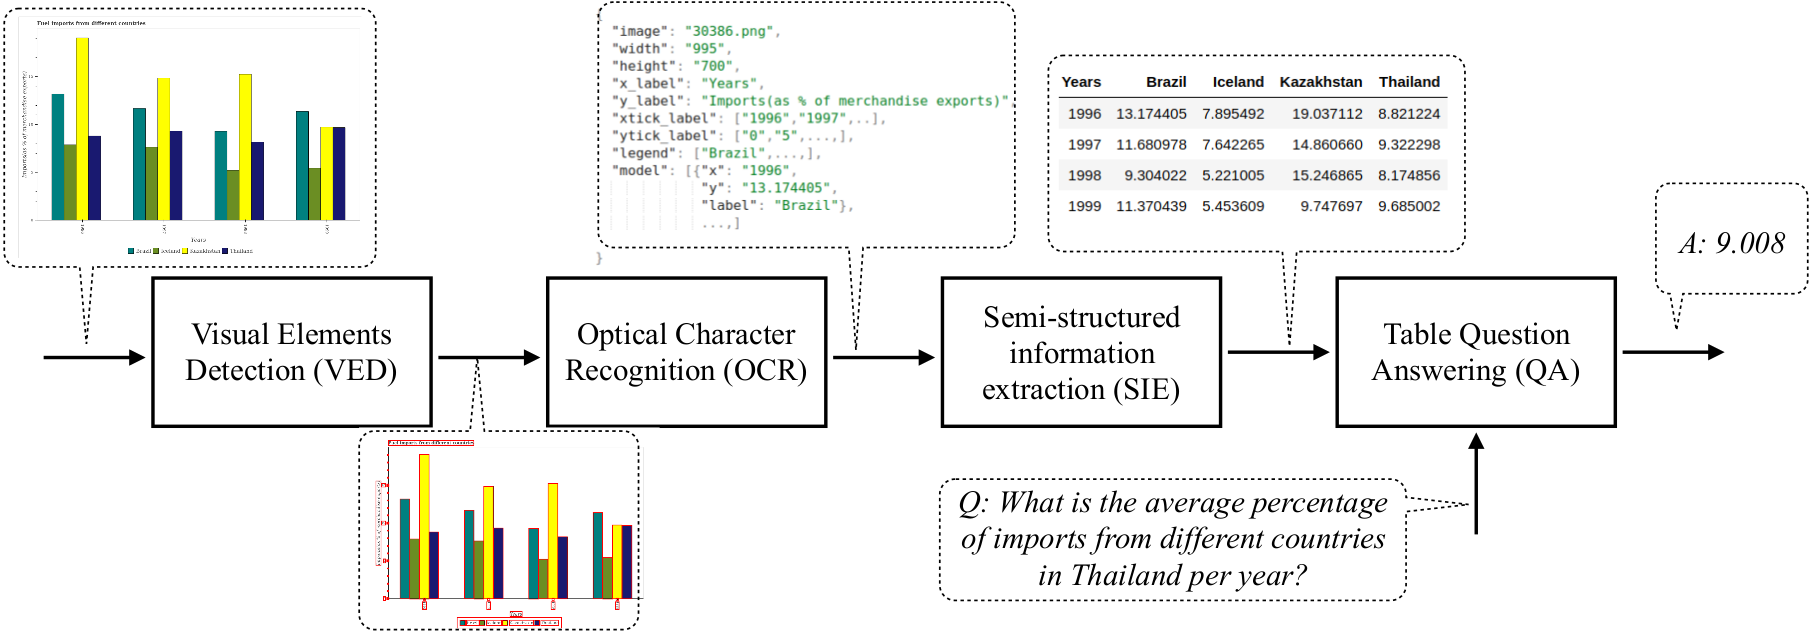
- Extracts the data-bearing elements of a plot by drawing bounding boxes around them
- Classifies them into the appropriate classes by using Faster R-CNN[4] with Feature Pyramid Network.
VED
- Uses pretrained OCR model to extract data from the boxes such as title, axes labels, etc. containing numeric and textual data.
OCR
- Extracts the data into a table using a set of handcrafted rules.
SIE
- Answer questions on the semi-structured table which supports complex reasoning questions
- Avoids the limitation of using a small answer vocabulary for multi-class classification.
QA
Proposed Model
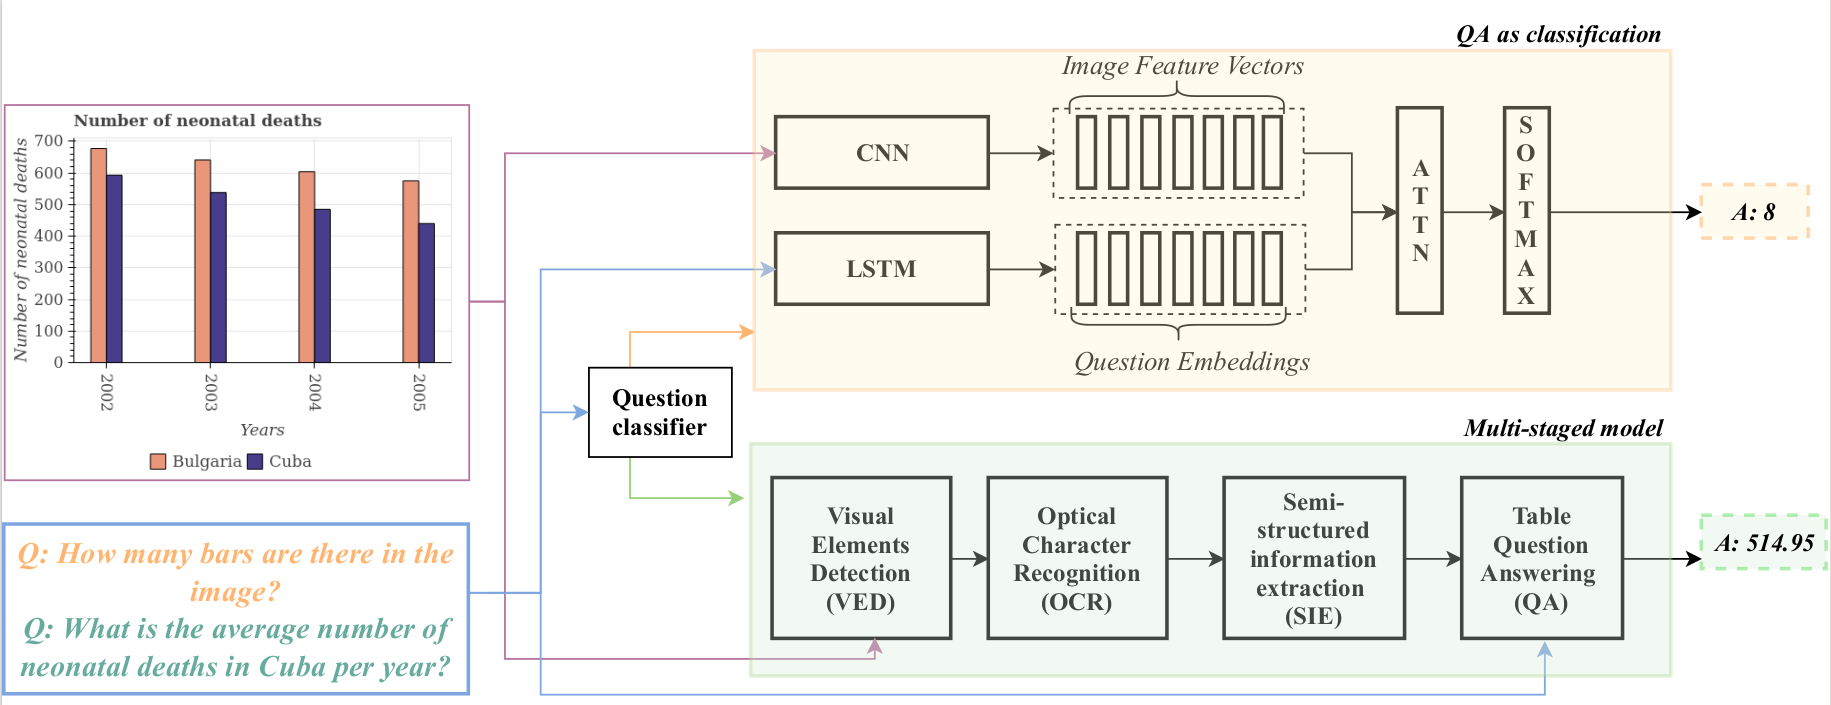
Question classifier:
deciding whether the question can be answered from a fixed vocabulary or needs more complex reasoning
QA-as-classification:
answers question from a fixed vocabulary
Multi-staged model:
a pipeline of perception and QA modules for answering complex questions.
Results & Analysis
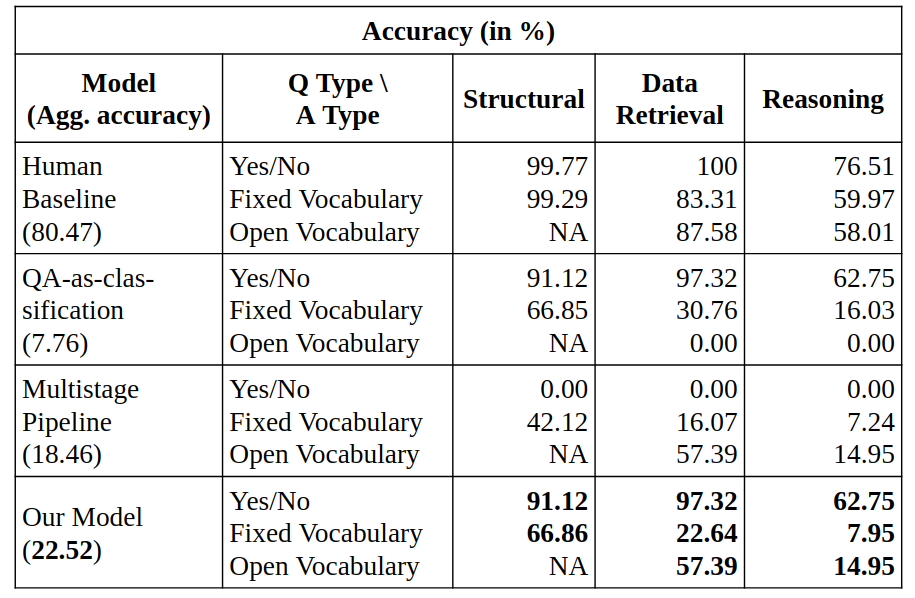
- QA-as-classification: Performs very well for Yes/No questions and moderately well on Fixed vocab. questions. It performs poorly on Open vocab. questions, failing to answer almost all the 3,507,045 questions in this category.
- QA-as-multi-stage pipeline: Fails to answer correctly any of the Yes/No questions, performs moderately well on Fixed vocab. questions, and answers correctly some of the hard Open vocab. questions.
- Our model: Combines the complementary strengths of QA-as-classification and QA-as-multistage pipeline achieving the highest accuracy of 22.52% on the PlotQA dataset and 26.7% relative improvement over SANDY-OCR[1] on the DVQA dataset.
- Our model accuracy: Significantly lower than human performance establishing that PlotQA is challenging and raises open questions on models for visual reasoning.
References
[1] K. Kafle, S. Cohen, B. L. Price, and C. Kanan. DVQA: understanding data visualizations via question answering. CoRR, abs/1801.08163, 2018.
[2] P. Pasupat and P. Liang. Compositional semantic parsing on semi-structured tables. In ACL, 2015
[3] S. E. Kahou, A. Atkinson, V. Michalski, ́A. K ́ad ́ar, A. Trischler, and Y. Bengio. Figureqa: An annotated figure dataset for visual reasoning. CoRR, abs/1710.07300, 2017.
[4] S. Ren, K. He, R. B. Girshick, and J. Sun. Faster R-CNN: towards real-time object detection with region proposal networks. In Advances in Neural Information Processing Systems 28: Annual Conference on Neural Information Processing Systems 2015, December 7-12, 2015, Montreal, Quebec, Canada, pages 91–99, 2015