From 120 to 800 MB of RAM usage in 5 minutes
(totally not a click bait)
Performance - INDUSTRY STAnDARDS (?)
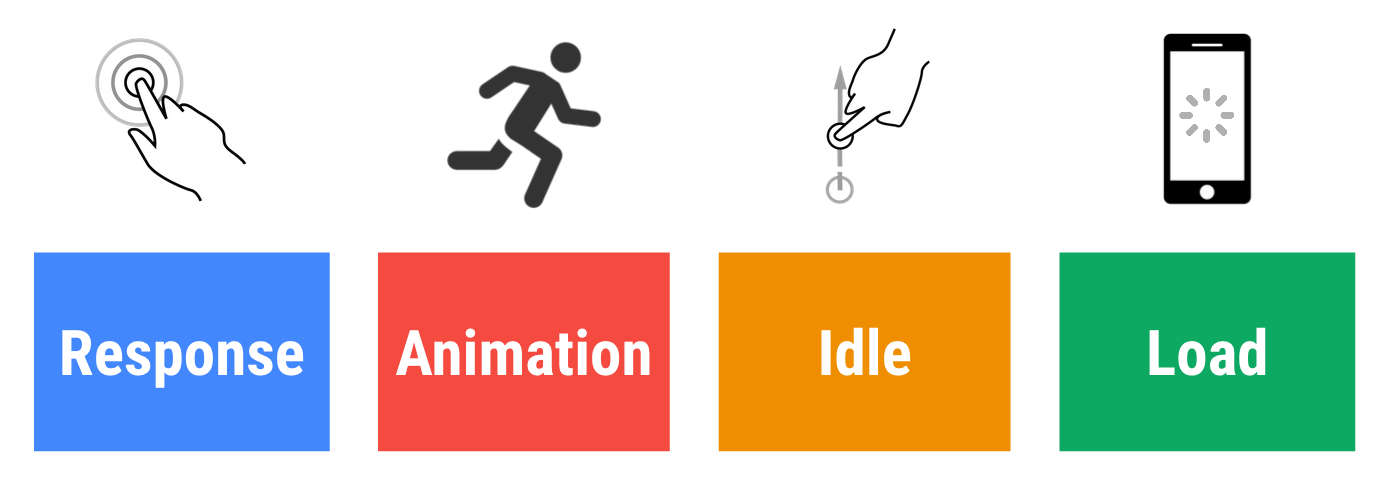
image src & read more at:
https://developers.google.com/web/fundamentals/performance/rail
what if your users spend hours, days, or even weeks without page reload?
WHAT If your app does that

WHAT If your app does that
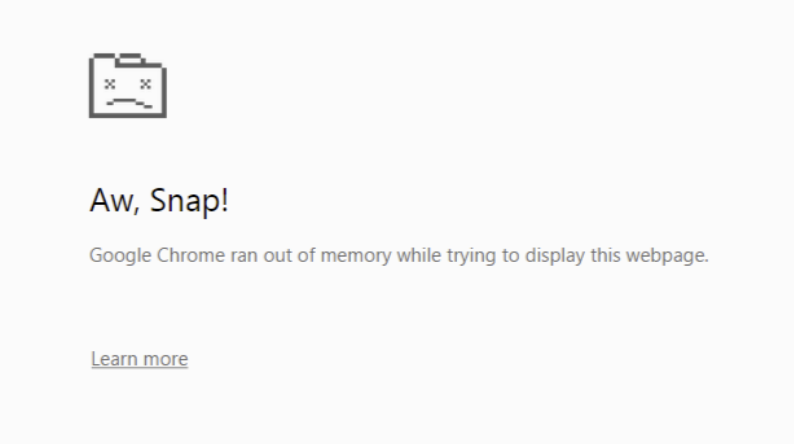
memory leak- WHY?
- not removed event listeners, RxJS subscriptions, endless state updates, timers ...
- references kept in closure
- circular references*
- detached and not destroyed HTML nodes
- overusing global scope
*circular references aren't the case in Mark and Sweep algorithm,
but there are edge cases for JS + DOM
speaking of which...

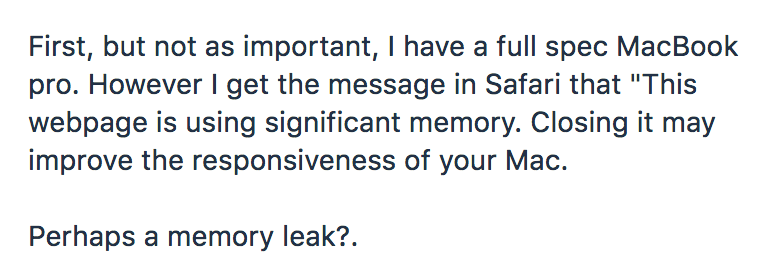

Profiling
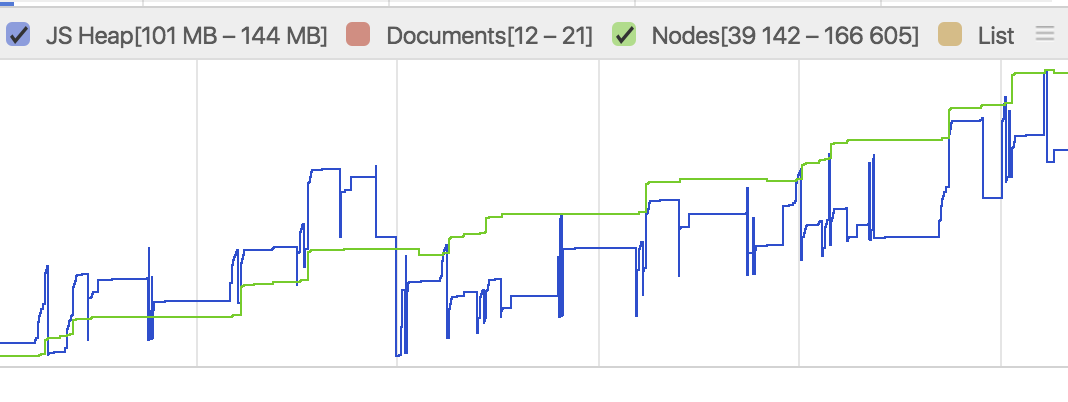
profiling

performance monitor
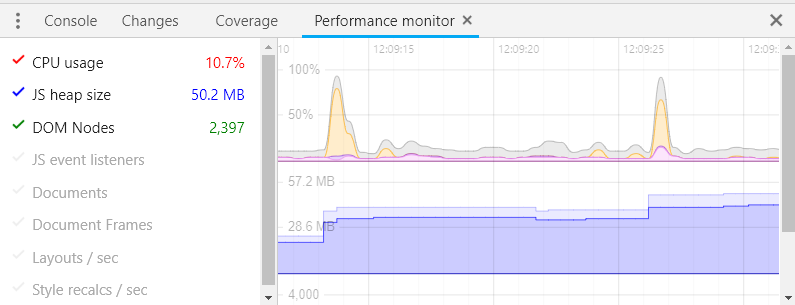

memory api
    // window.performance.memory

    {
      totalJSHeapSize: 29400000,
      usedJSHeapSize: 15200000,
      jsHeapSizeLimit: 1530000000
}- only in Chrome
- requires flag
--enable-precise-memory-info
synthetic memory tests
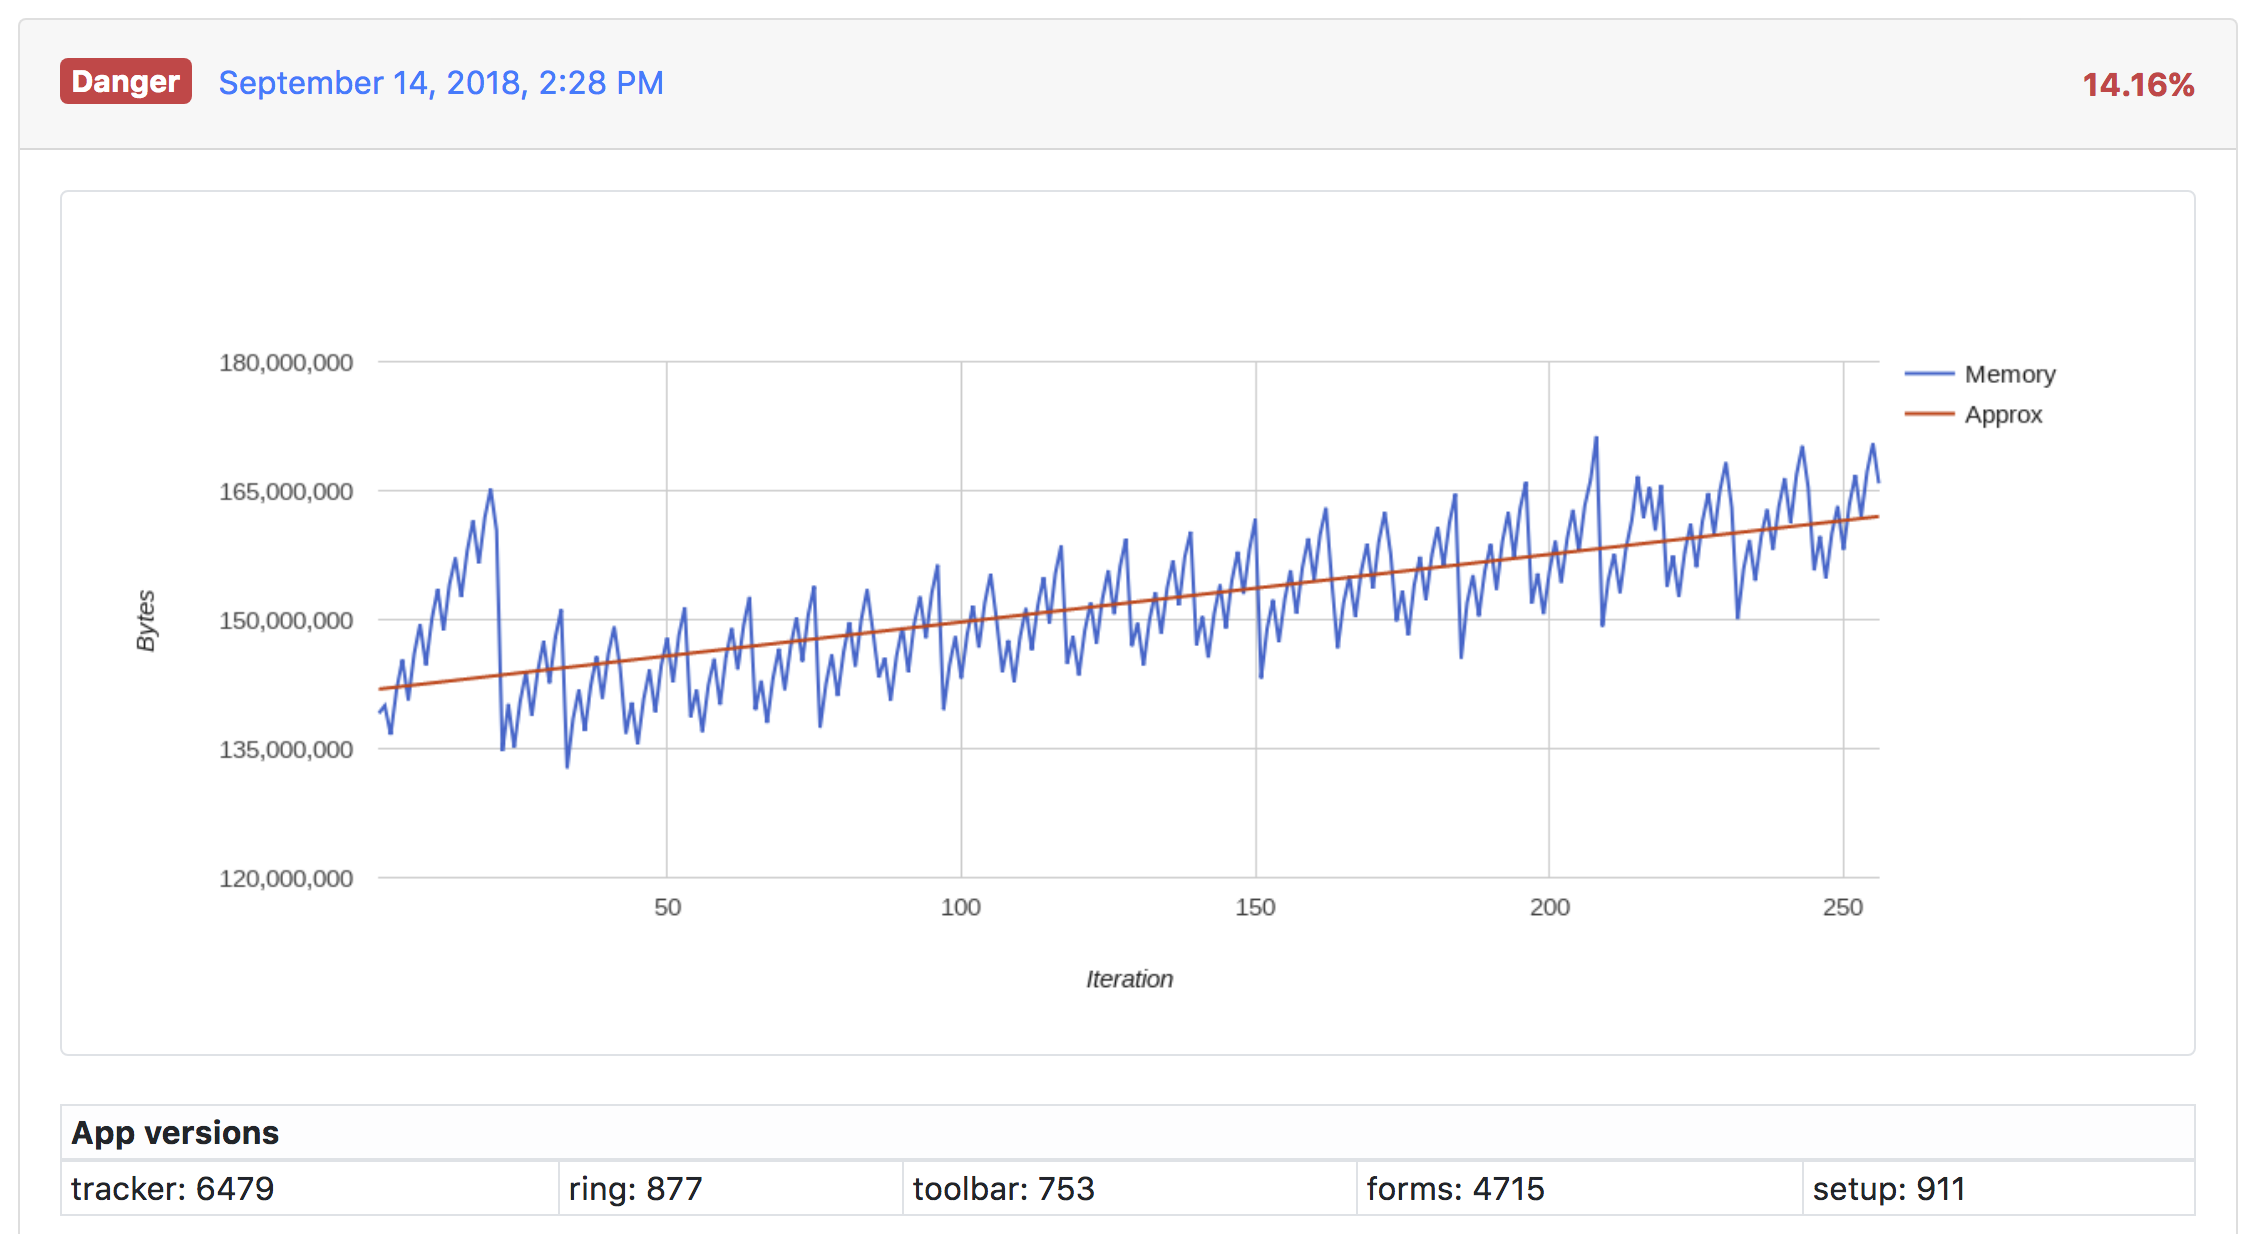
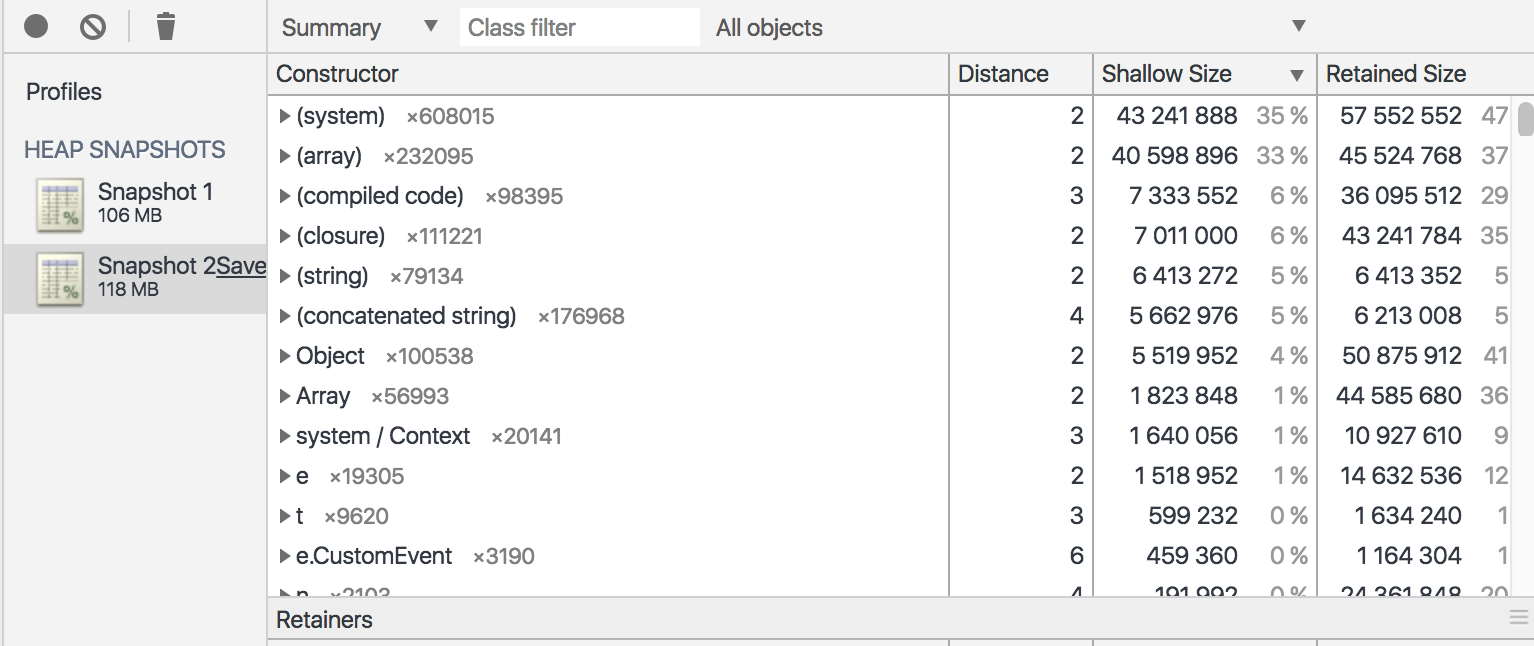
Memory snapshots
you can even ask your clients to send you a snapshot and analyze it ❤️
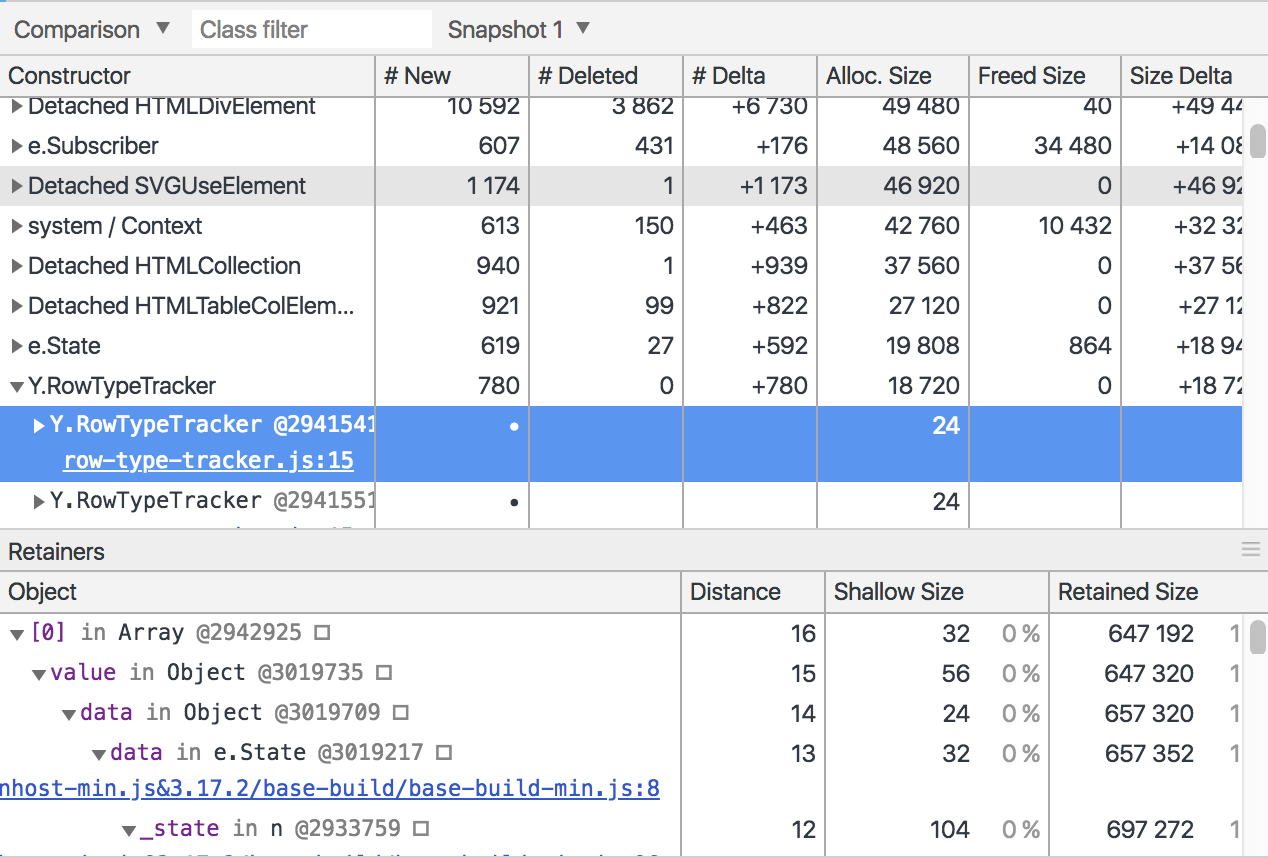
Memory snapshots comparison
przyklad, omowic retained vs shallow size
you can even ask your clients to send you their snapshots
🙈
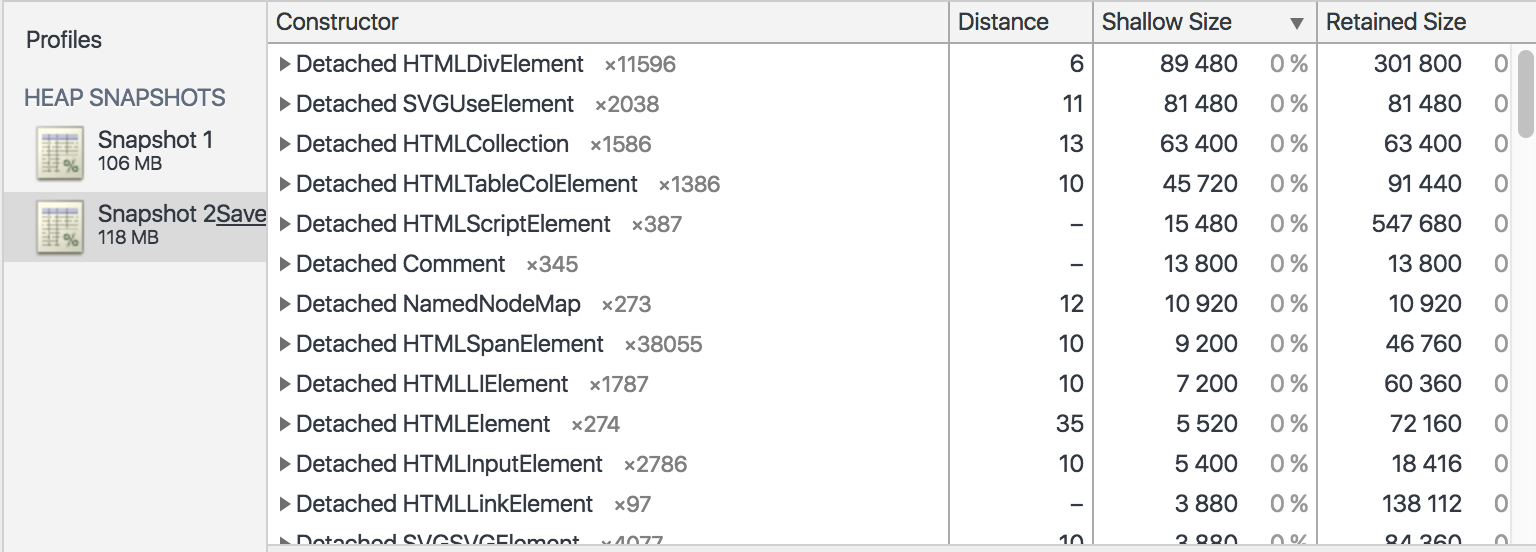
it kinda felt like this

syntH. memory tests - before
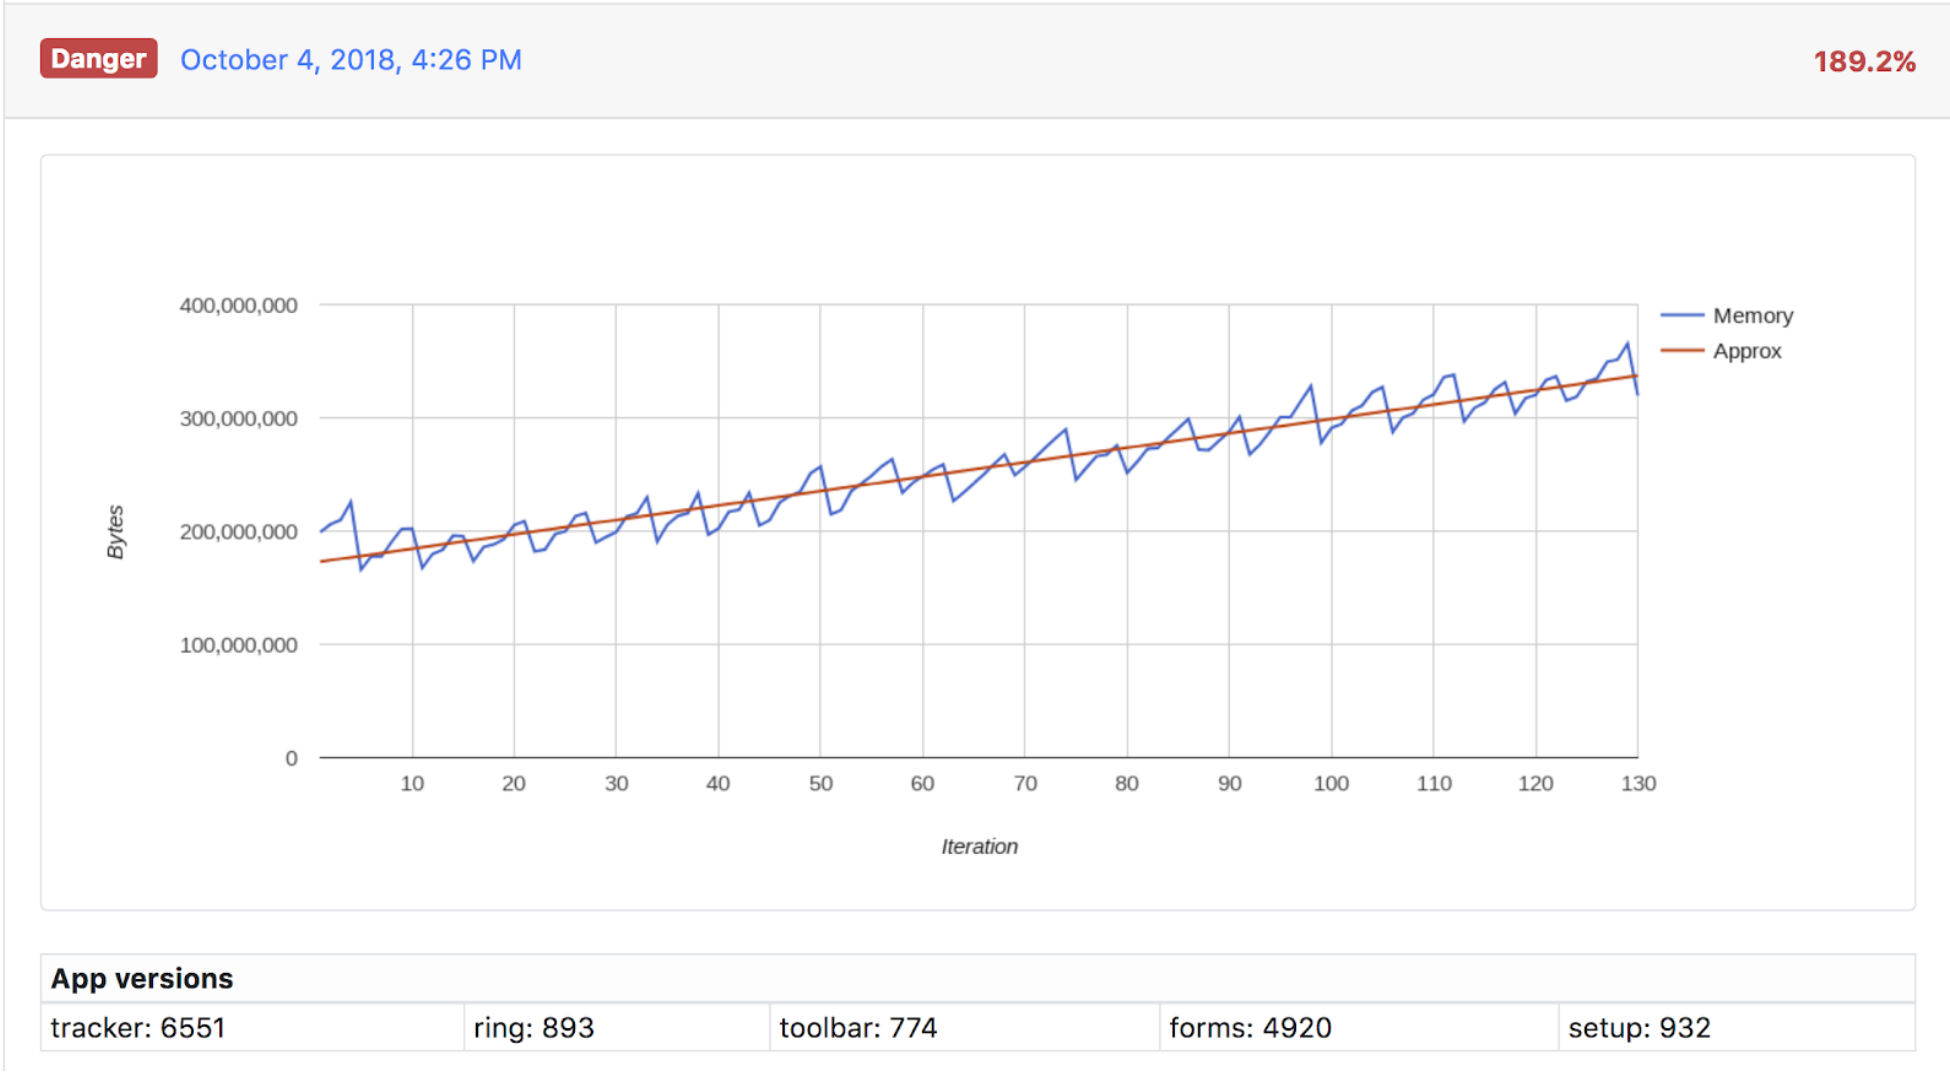
syntH. memory tests - AFTER
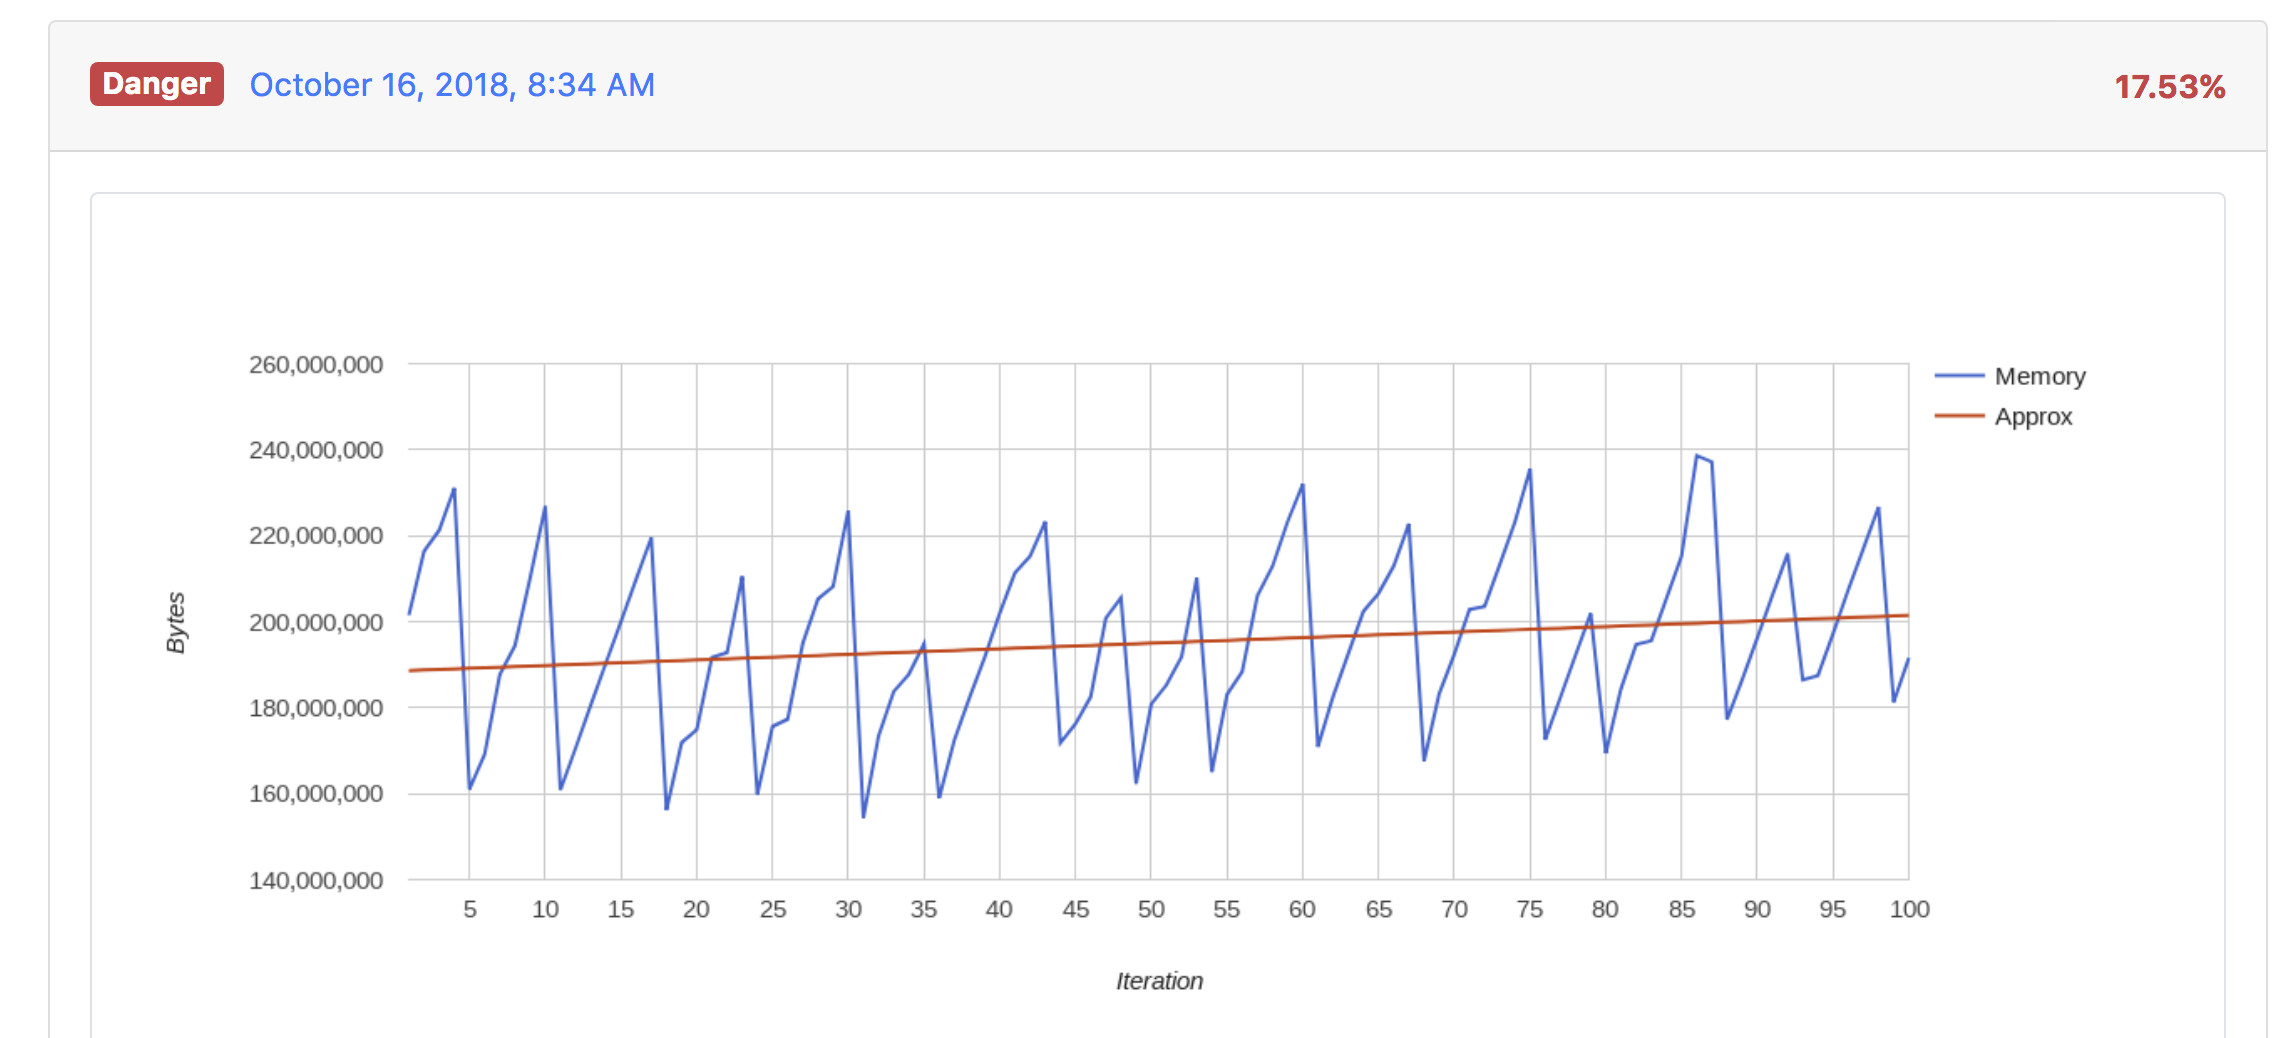
real user
measurements
- calculations are only approximate
- yet another task that would slow down code execution on client's side
Manually calculate memory allocated on heap but:
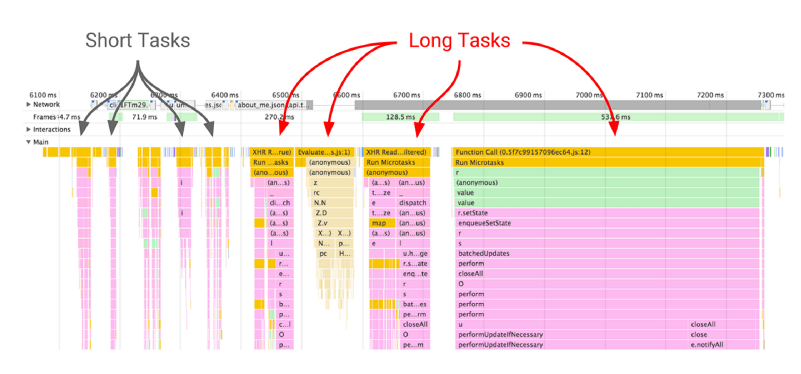
long tasks
read more at:
https://w3c.github.io/longtasks
    const observer = new PerformanceObserver((list) => {
        const perfEntries = list.getEntries();

        // queue reporting for long tasks existance
    });

    observer.observe({entryTypes: ["longtask"]});

    // long task refers to occurrences of event loop tasks
    // or pauses caused by UI thread work
    // whose duration exceeds 50ms
long tasks
long tasks
- No Firefox and Safari support
- You can get the idea of what's happening in general
fin
