Performing in
Real World
Real User Measurement
Hi, I'm Rafal RUManek

doing frontend stuff at Codewise
event organizer for Angular Dragons
@RafalRumanek
I have a poor sense of humour

(please, forgive me!)


1517 KB
is the average size of resources requested by a page
75 requests
is the average number of resources requested by a page
19 connections
is the average number of
TCP connections for a page
15.3s
is the average load time
for a mobile page
that takes longer than
3 seconds to load
53% of mobile site visits
leave a page


If you don't measure and optimize your app
performance, eventually it will downgrade


If you don't measure and optimize your app
performance, eventually it will downgrade

If you don't measure and optimize your app
performance, eventually it will downgrade
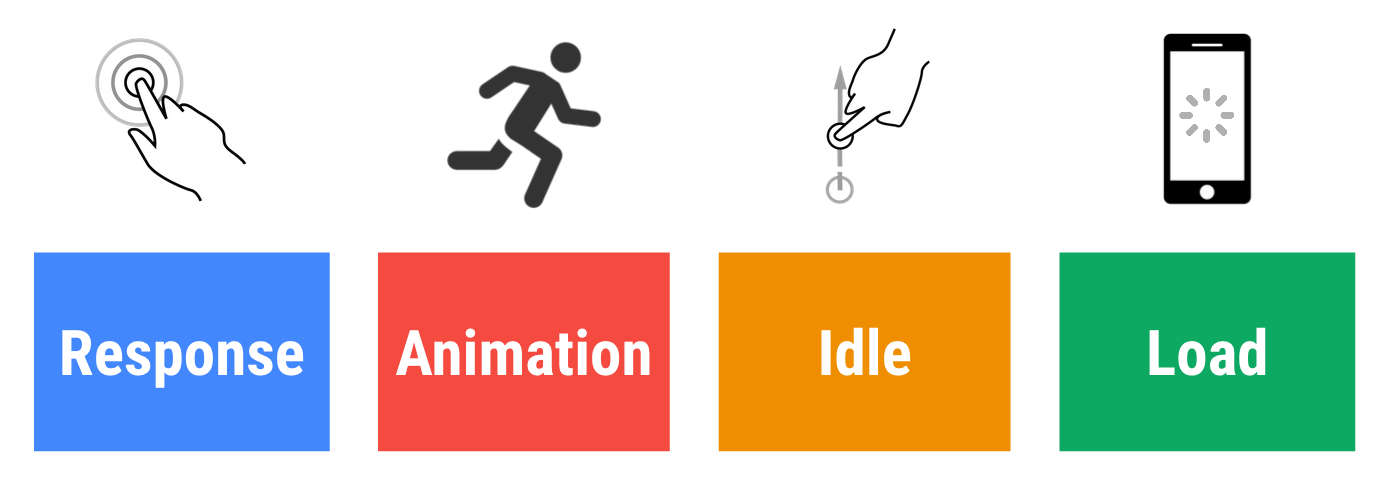
RAIL model - industry standards?
image src & read more at:
https://developers.google.com/web/fundamentals/performance/rail
1. Local tests
2. Synthetic tests
3. Real user tests
(during development, devtools + audits)
(pre-release)
(prod - Real User Measurement)
From click to load
image src & read more at:
https://www.w3.org/TR/navigation-timing

Good ol' friends
    const t0 = performance.now();
    doSomething();
    const t1 = performance.now();
    console.log("Call to doSomething took " + (t1 - t0) + " milliseconds.");
performance.now() - more accurate than Date.now()
and independant of the clock system;
almost a high-res timestamp
(Spectre, fingerprinting & other threats)
image src & read more at:
https://www.w3.org/TR/navigation-timing-2/

Navigation timing
Navigation timing
    const [perfData] = performance.getEntriesByType('navigation');
    // similar to window.performance.timing;

    const pageLoadTime = perfData.loadEventEnd - perfData.startTime;
    const dnsLookupTime = perfData.domainLookupEnd - perfData.domainLookupStart;
    const renderTime = perfData.domComplete - perfData.domLoading;
    const timeTillFirstBye = perfData.responseStart - perfData.requestStart;
read more at:
https://www.w3.org/TR/navigation-timing-2/
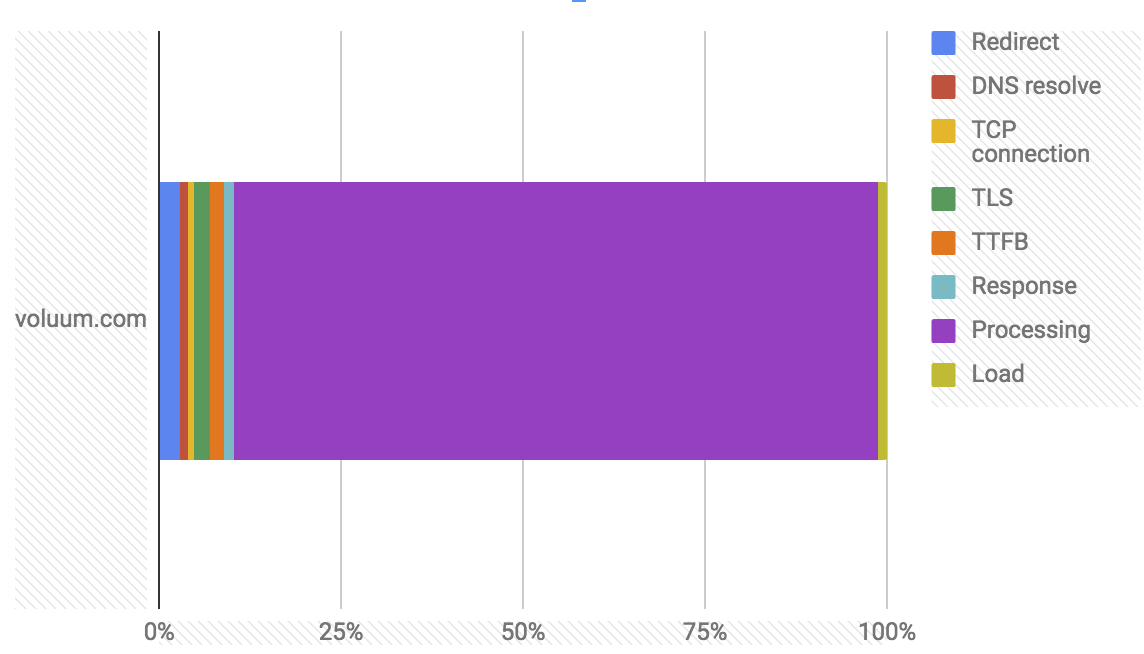
t = 3521ms

Resource timing
Resource timing
    // finding data for resources with versioning
    const [ringTimingData] = performance.getEntries()
        .filter(({name}) => name.includes('voluum_frontend_ring'));

    // choosing data by name
    const [resourceData] = performance
        .getEntriesByName('https://domain.com/smiesznypiesek.jpg');

    // retrieving script transfer size
    const scriptsResources = performance.getEntriesByType('resource')
        .filter(entry => entry.initiatorType === 'script');
    const scriptsTransferSize = scriptsResources
        .reduce((sum, {transferSize})=> sum + transferSize, 0);
Resource timing buffer
-
Limited buffer size - overflowing entries are ignored
-
can be increased (setResourceTimingBufferSize) careful!
-
or cleared (clearResourceTiming)
-
onresourcetimingbufferfull
Performance observer
    const observer = new PerformanceObserver(obsrvr => {
       const entries = obsrvr.getEntries();
       // queue perf data to send
    });


    observer.observe({entryTypes: ["resource"]});

    // ...

    observer.disconnect();
Long Tasks
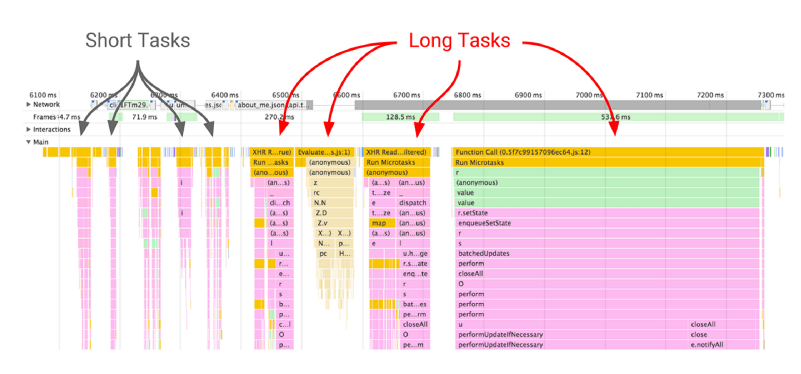
Long Tasks
read more at:
https://w3c.github.io/longtasks
    const observer = new PerformanceObserver(function(list) {
        const perfEntries = list.getEntries();

        // queue reporting for long tasks existance
    });

    observer.observe({entryTypes: ["longtask"]});

    // long task refers to occurrences of event loop tasks
    // or pauses caused by UI thread work
    // whose duration exceeds 50ms
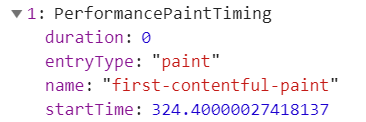
Paint Timing
    // first-paint, first-contentful-paint

    const timingEntries = performance.getEntriesByType('paint');
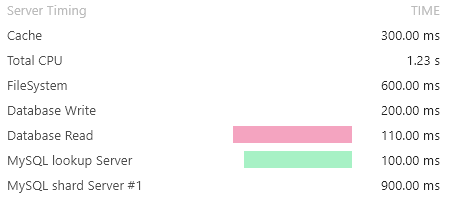
Server Timing headers
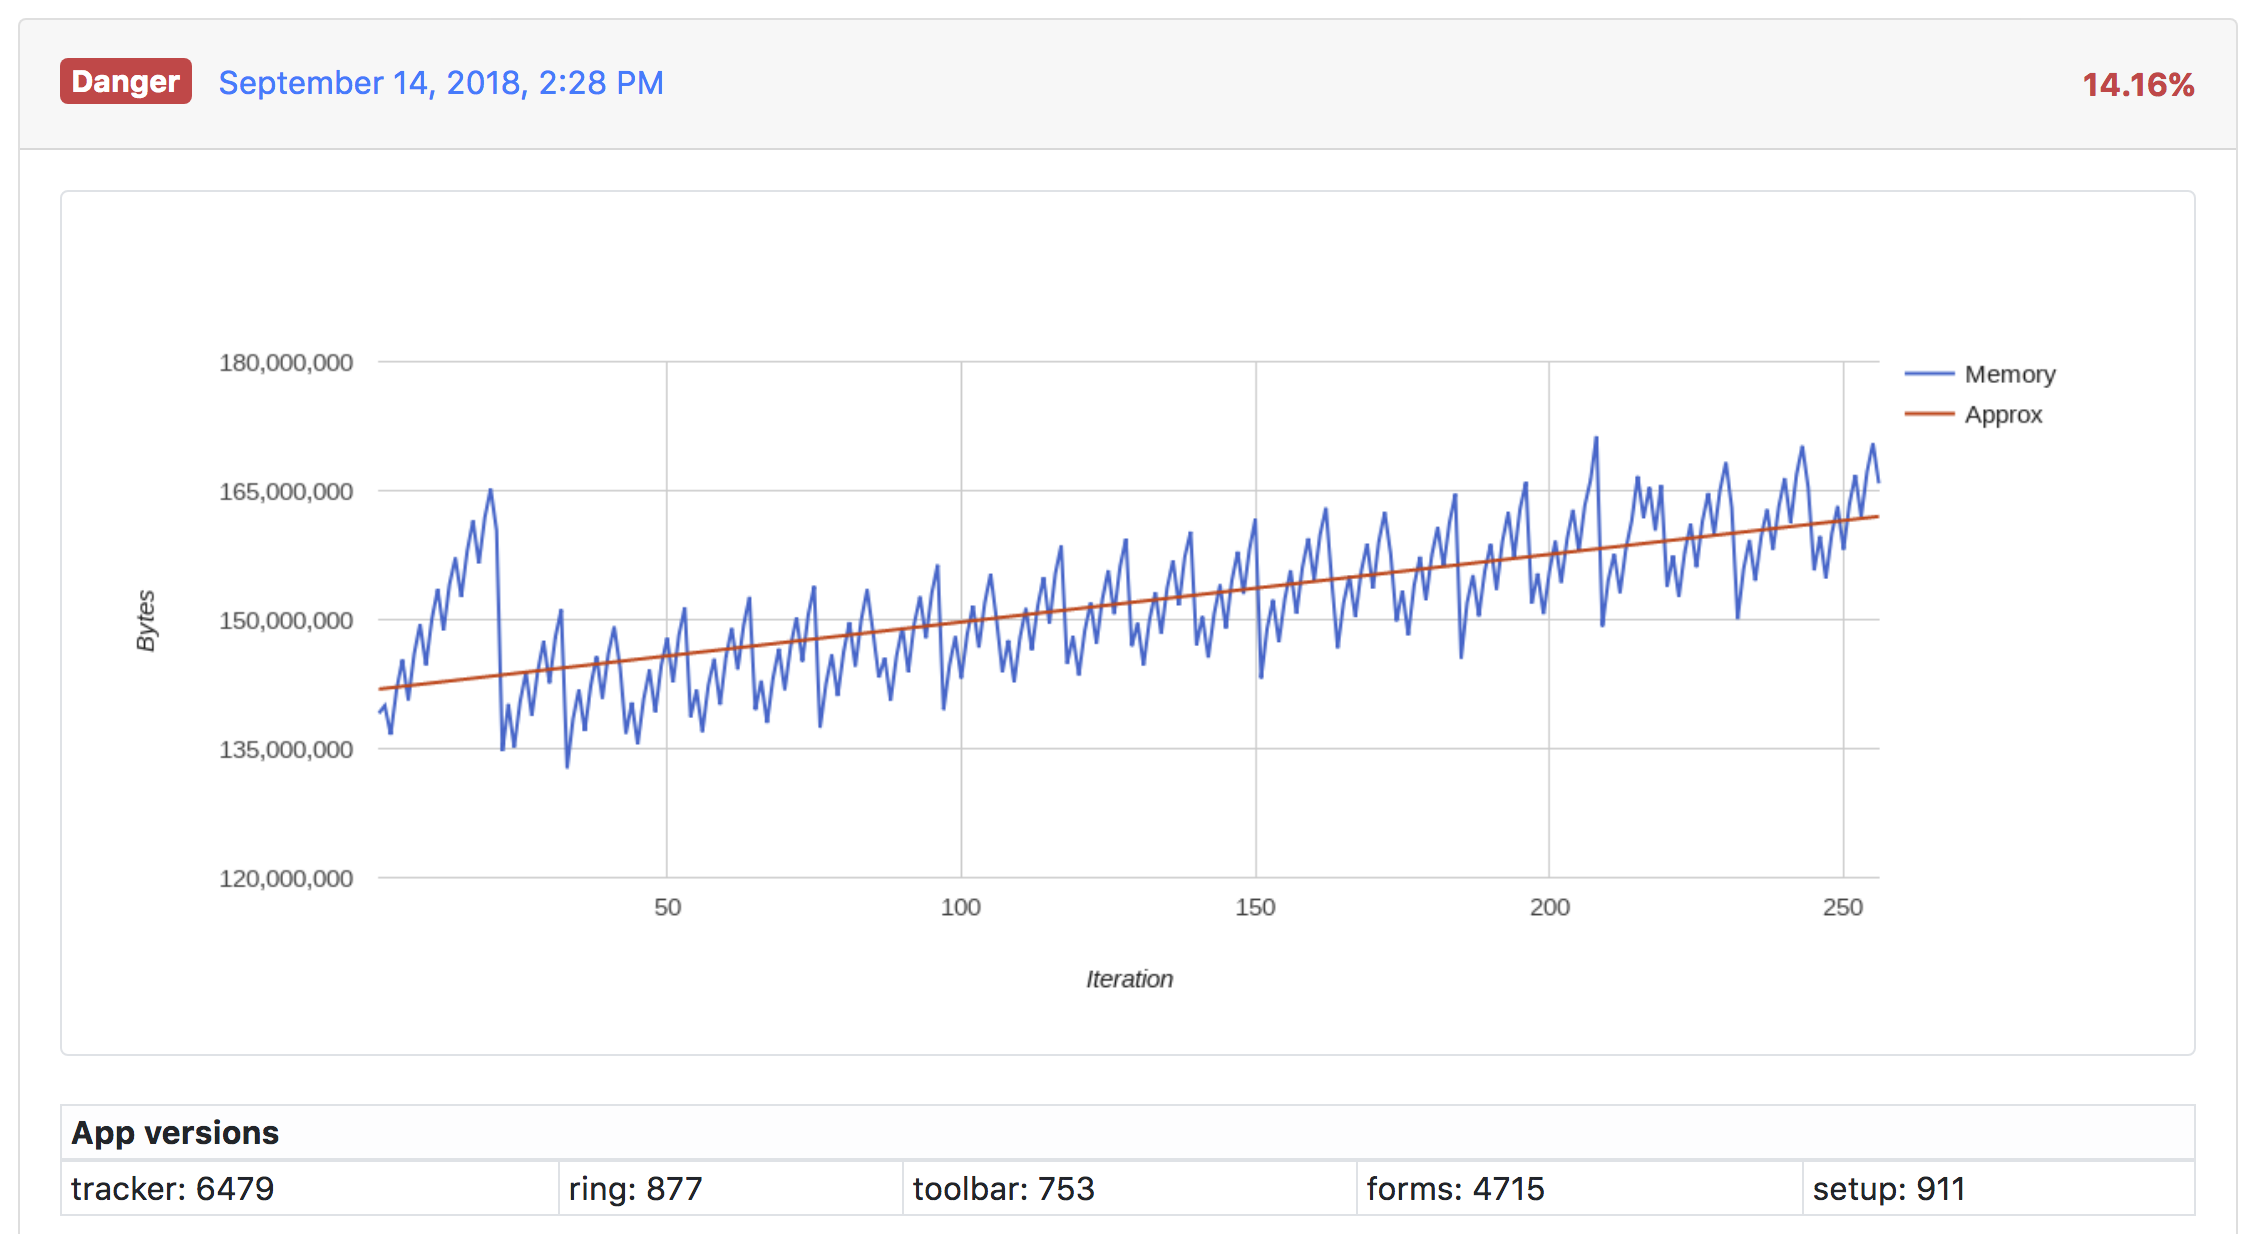
Memory

Disclaimer
-
for sending gathered data, consider using Beacon API
-
make sure you separate background tab performance with Page Visibility API
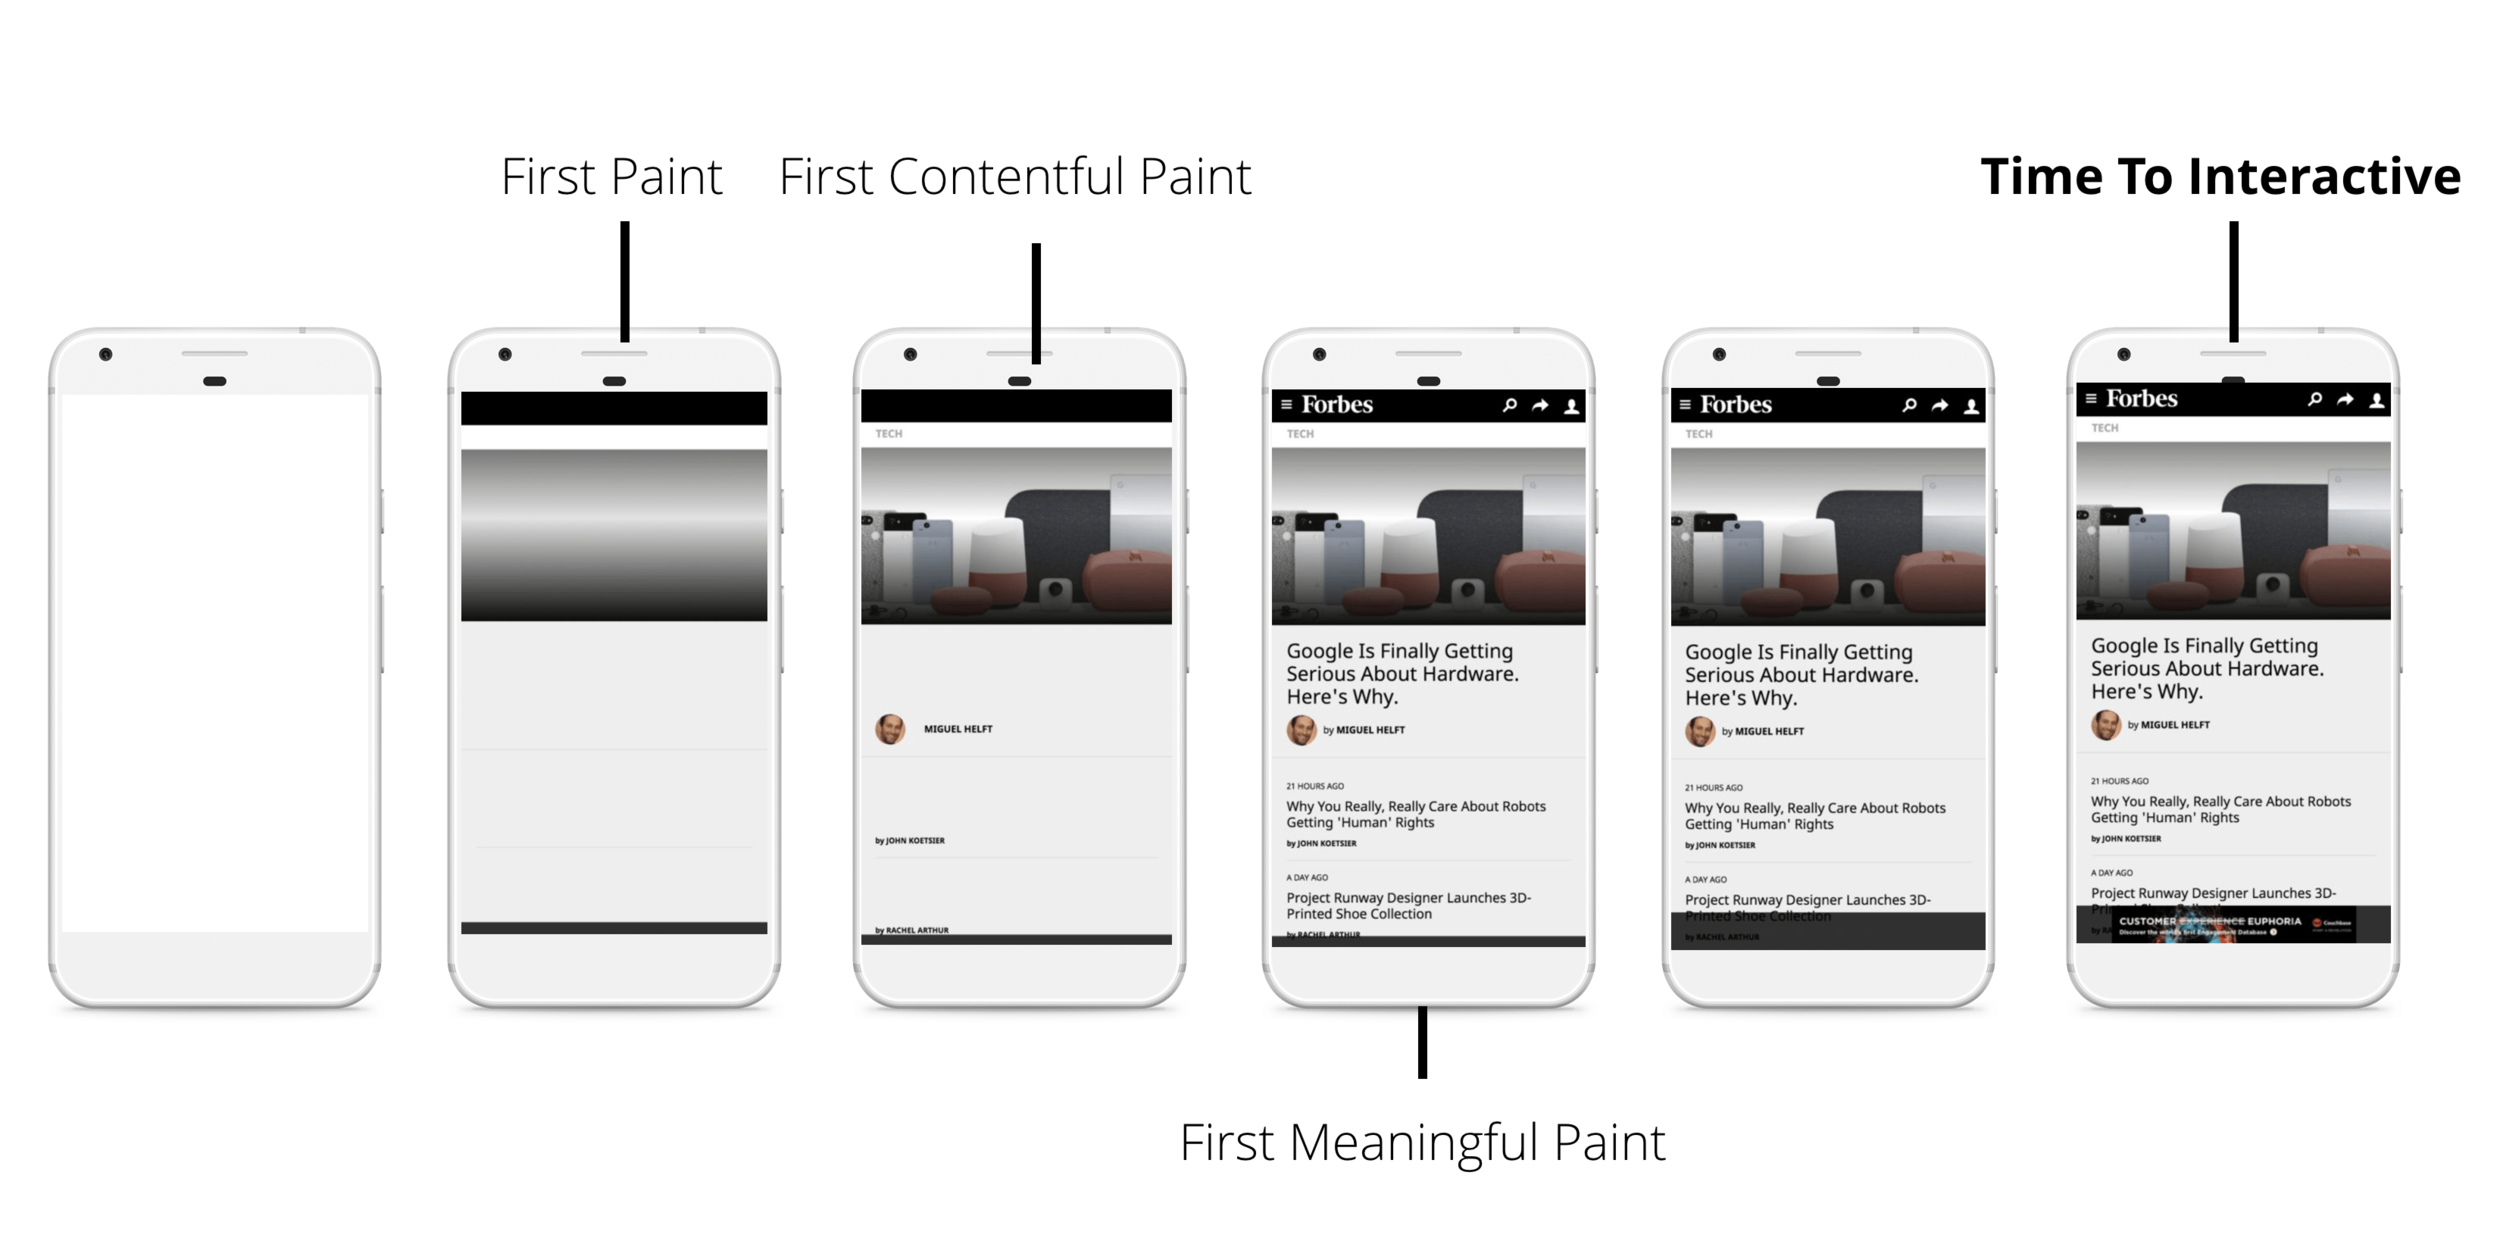
image src & read more at:
https://developers.google.com/web/fundamentals/performance/rail
When is your app really ready?
Perceived performance
Time till visually ready
-
First paint (if available) - Chrome's firstPaintTime, IE's msFirstPaint; not necessarily meaningful
-
domContentLoadedEventEnd - available through performance.timing; happens after domInteractive
-
hero image (if exists) - Resource Timing
-
framework ready - custom, user defined event
Time till interactive
-
TTVR
-
no long tasks (Long Tasks API)
-
FPS don't drop below 20 - can be measured with requestAnimationFrame
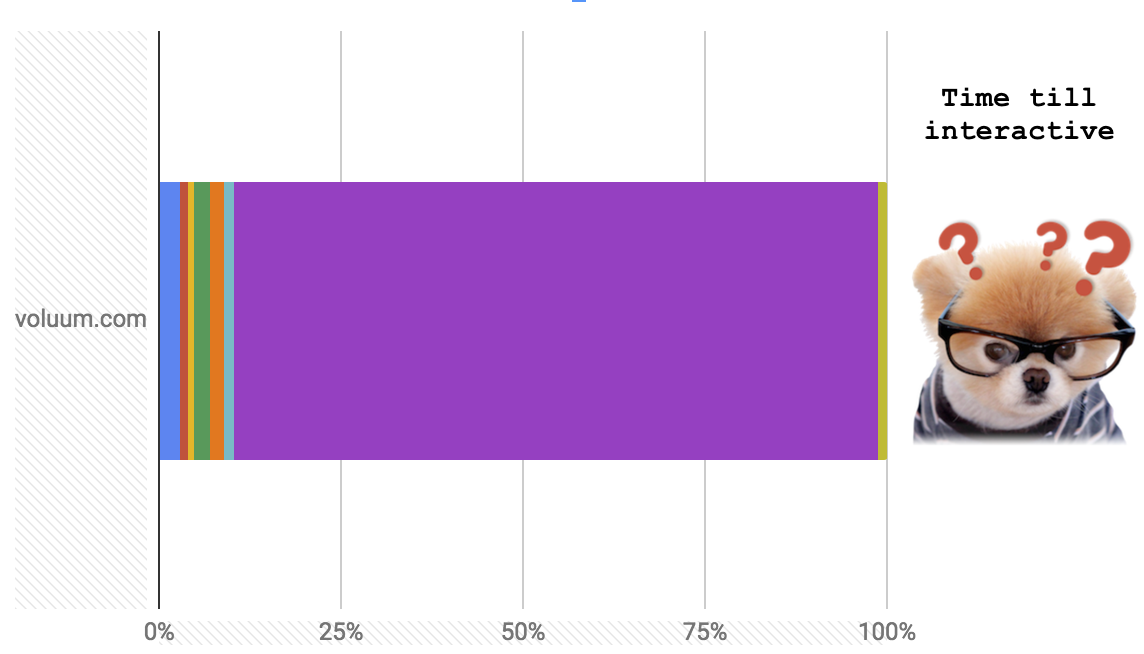
(hopefully not so obvious)
Performance tips

Compression
-
gzip is a standard - what about brotfli and zopfli?
-
keep in mind (de)compression times
- doesn't mean brotli is slower -
CDNs can do that for you!
Combine bundling & splitting
-
balance out your huuuge bundle with versioning of smaller pieces
-
use code splitting, lazy loading & preloading
-
is SSR + progressive enhancement a viable option?

Be lazy!
-
do lazy loading
-
do lazy rendering on boostrap
-
do lazy rendering for bigger UI elements

Use HTTP/2.0
-
headers compression (think of CSP header)
-
PUSH resources to users they will request (careful - PUSH vs. local cache)
-
better parallelism for resources from same domain
read more at:
https://http2.github.io/faq/
pre- hints
-
prefetch, preload, preconnect, dns-prefetch 'rel' attributes for link
-
https://hstspreload.org/
Cache all the things!
-
use CDN effectively!
-
cache-side cache, both for static resources and dynamic data: etag or


Data structures matter
simple things such as Map vs. Object
can make difference:
https://github.com/facebook/jest/pull/6960
read more at:
https://v8project.blogspot.com/2018/01/hash-code.html
Visualisations help
-
source-map-explorer
-
webpack bundle analyzer
-
request map generator
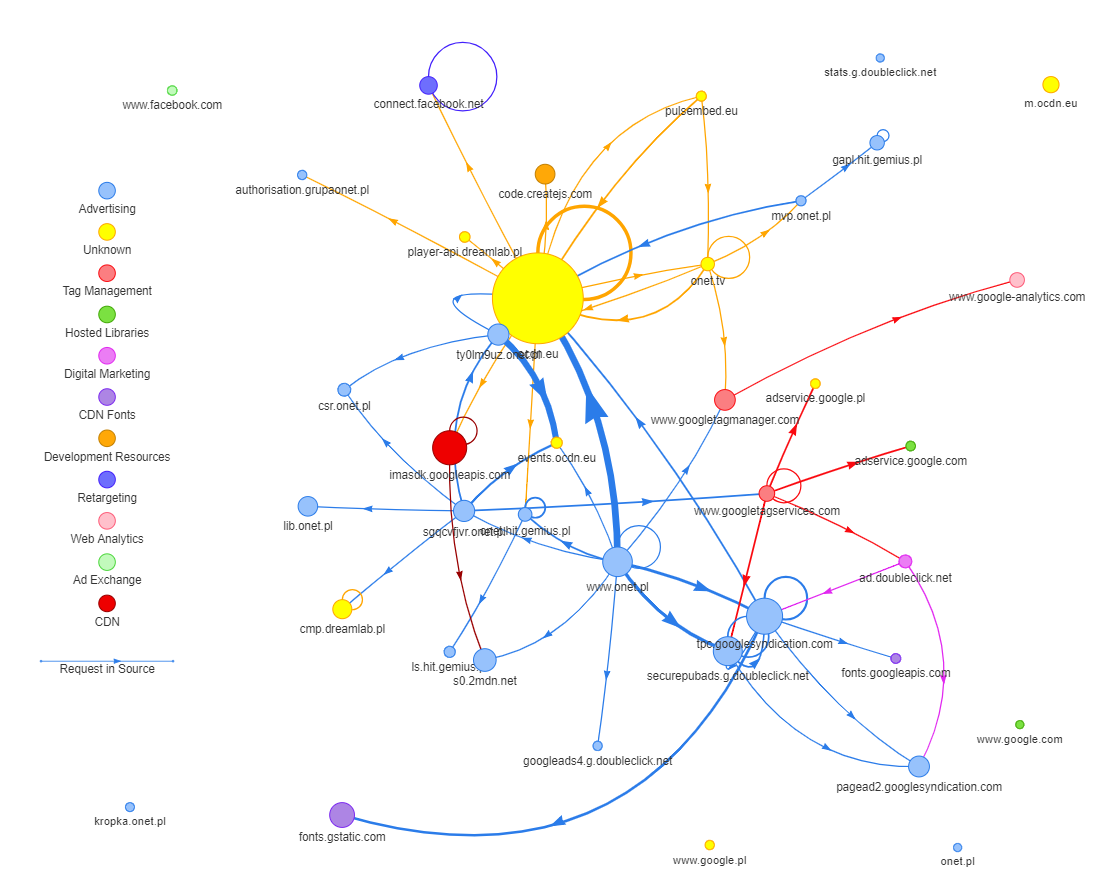

image soruce:
https://pexels.com
Being fast matters!
The longer you
neglect performance,
the more issues you will have

Being fast matters!
The longer you
neglect performance,
the more issues you will have
