Predicting Surgical Site Infections (SSI) using Electronic Medical Records
Rebecca Barter, Prabhu Shankar, Parul Dayal,
Karl Kumbier, Hien Nguyen, Bin Yu

A collaborative journey


Dr Prabhu Shankar
Dr Parul Dayal
Dr Hien Nguyen
Prof Bin Yu
(almost Dr) Rebecca Barter

Dr Karl Kumbier
Zimlichman et al. 2013, Merkow et al. 2015, Klevens et al. 2002, Magill et al. 2014
Surgical Site Infections
~160,000
Cases per year
>8000
Deaths associated with SSI per year
11%
ICU deaths are associated with SSI
$3.2 billion
Attributable cost per year to hospitals
11 days
Additional hospitalization for the average SSI patient
Surgical Site Infections
Closer monitoring
Preventative treatment
Take quicker action
If we can predict which patients are at high risk of SSI...
Better patient outcomes
Lower costs for hospitals
To generate a prediction... we need data!
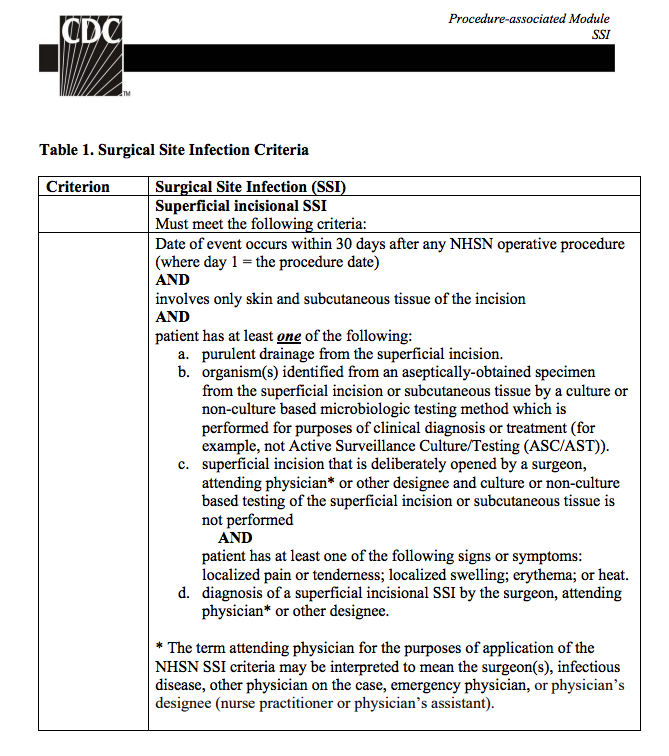
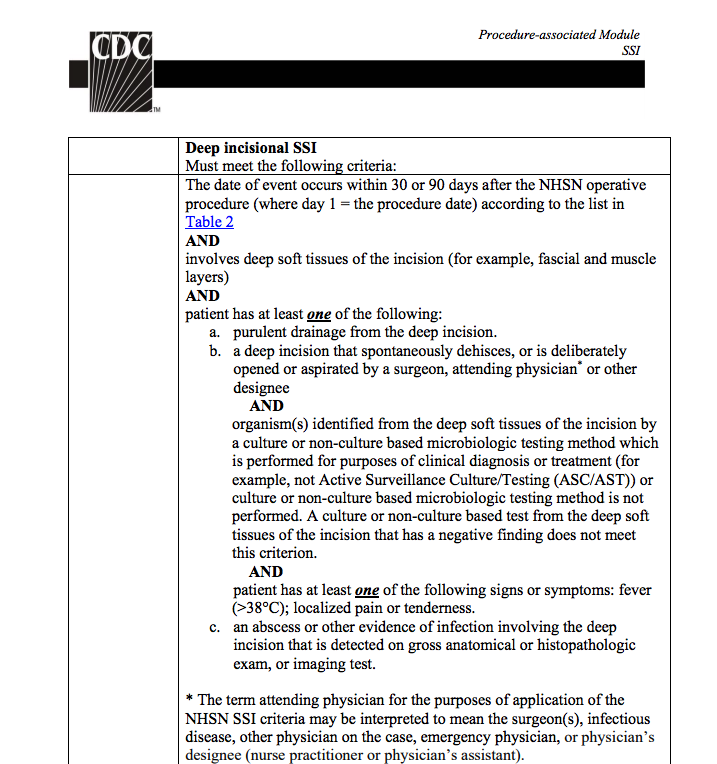
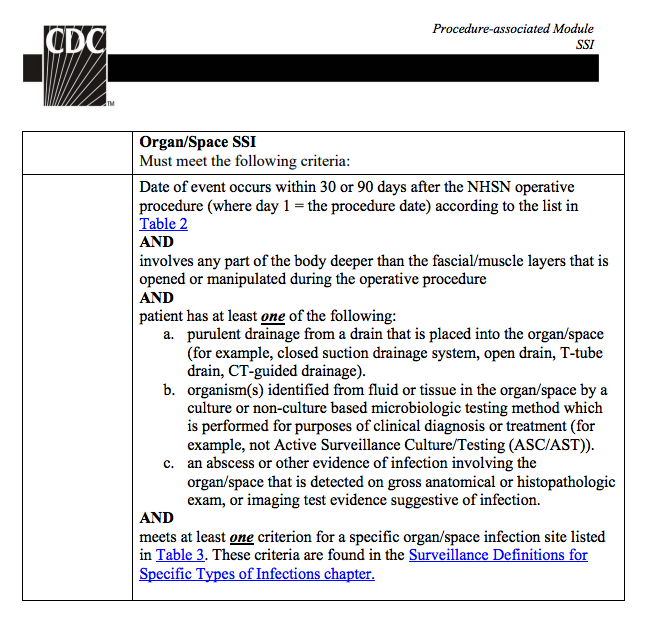
SSI Surveillance by the CDC
30 days
Infection*?
All hospitals have compulsory SSI reporting to the CDC
National Healthcare Safety Network (NSHN)
*How do you define an infection?
+
NHSN surveillance data
EHR data
Current approaches


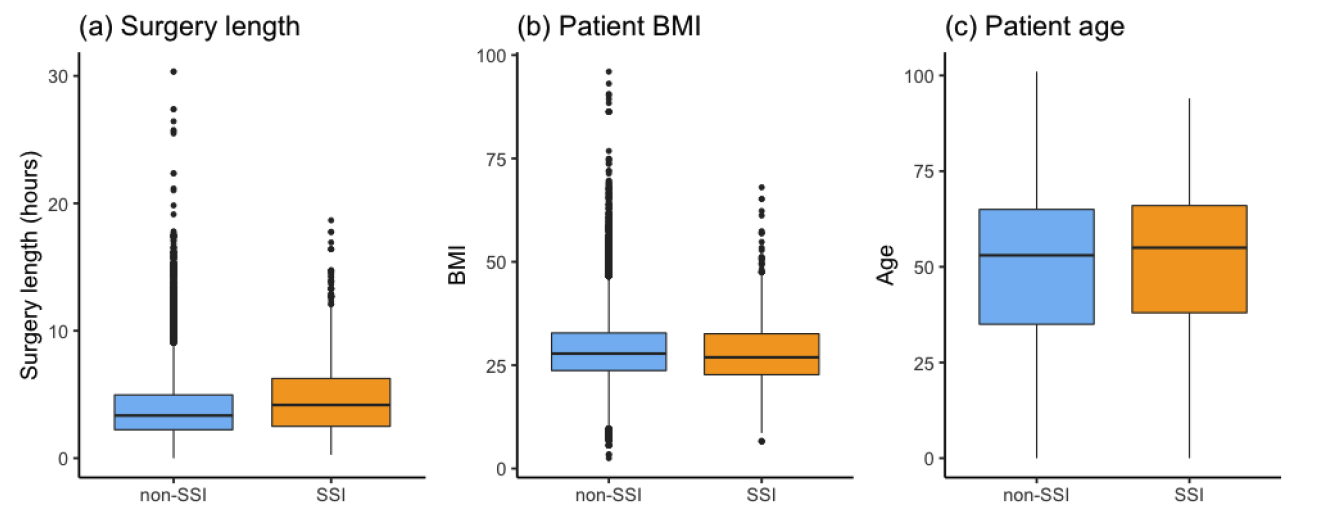
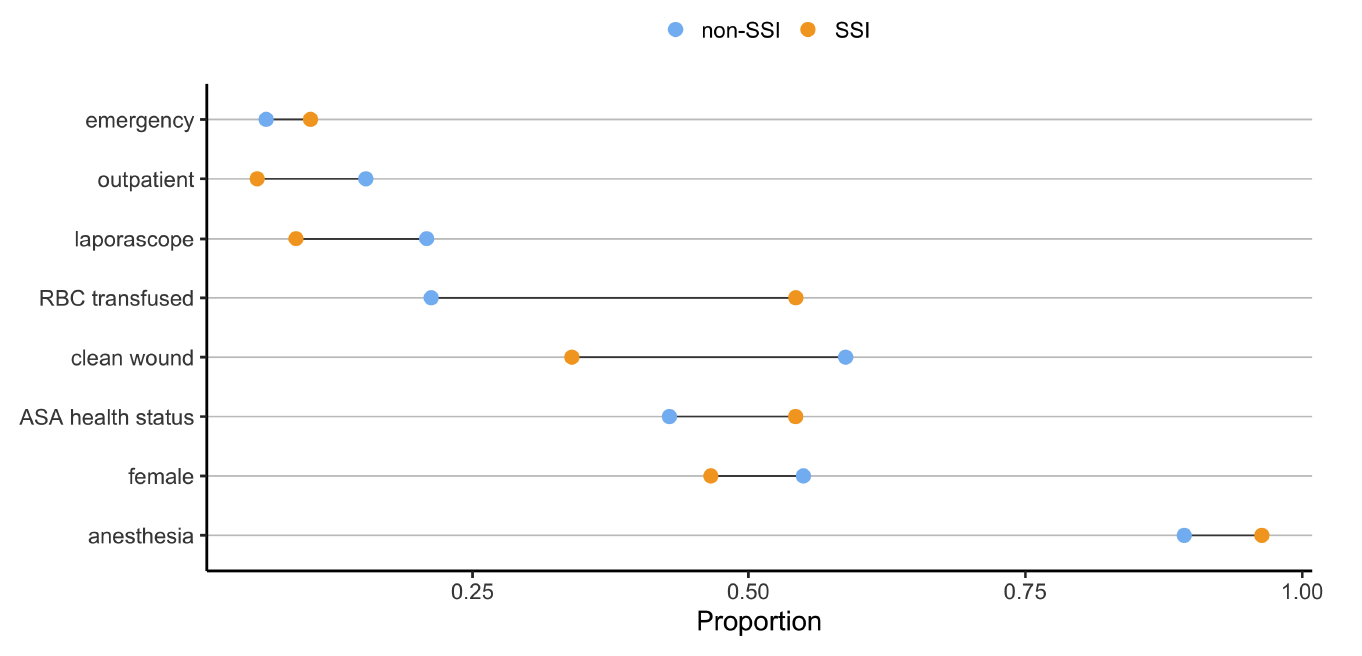
Surgery
Patient
SSI
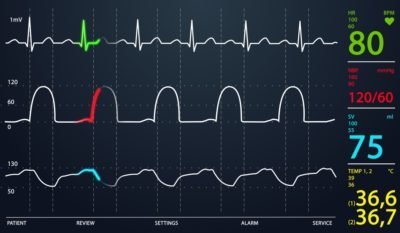
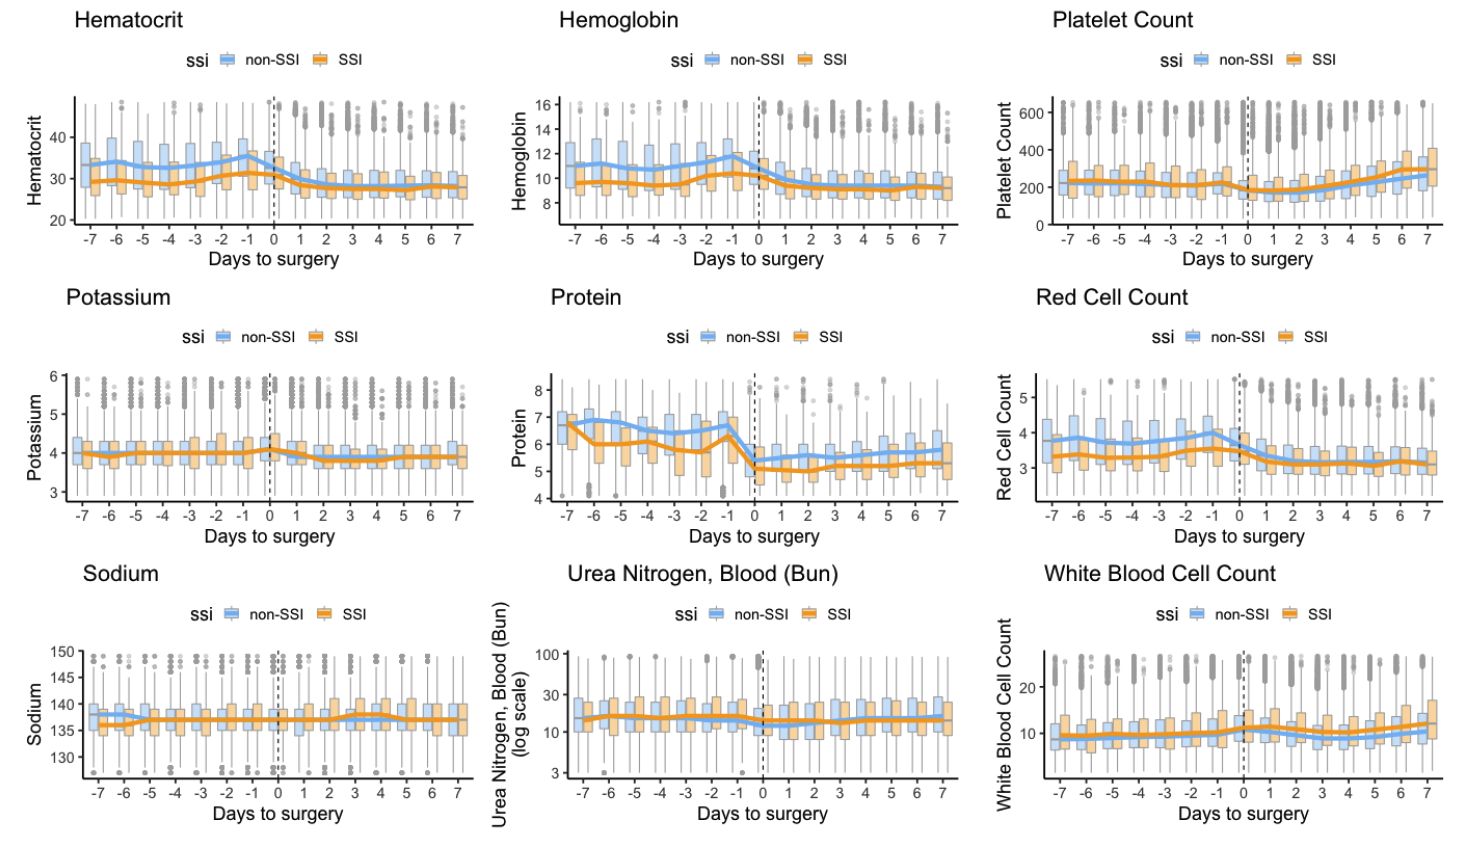
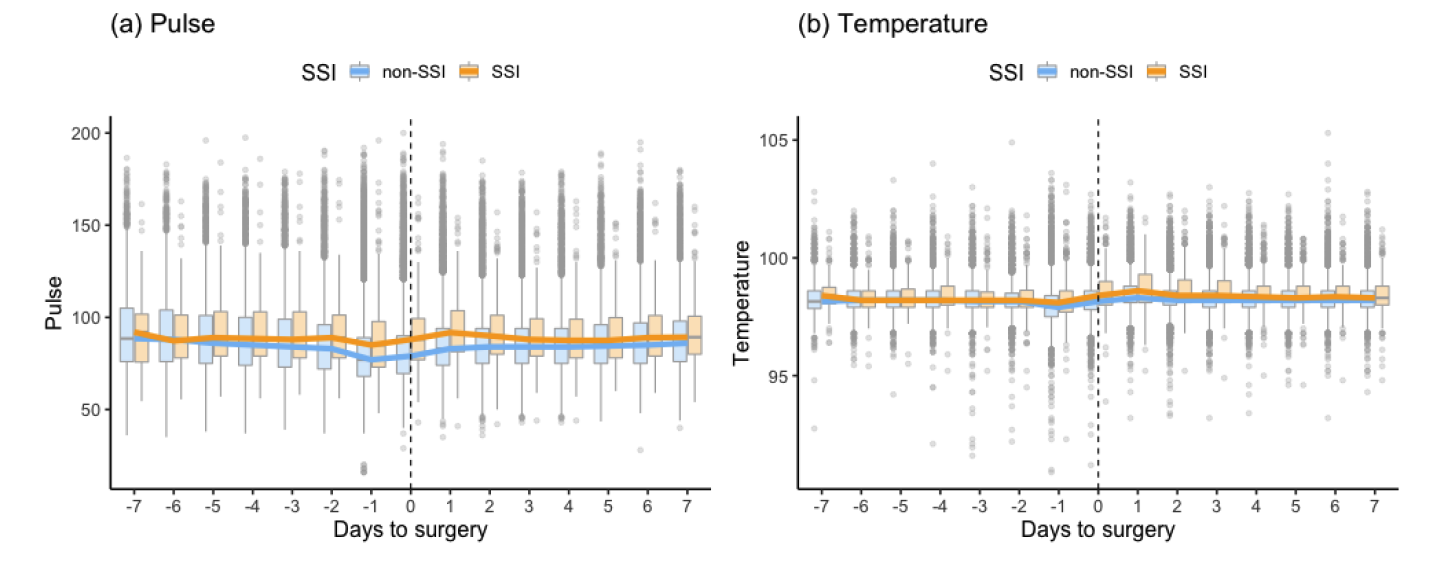
Vitals
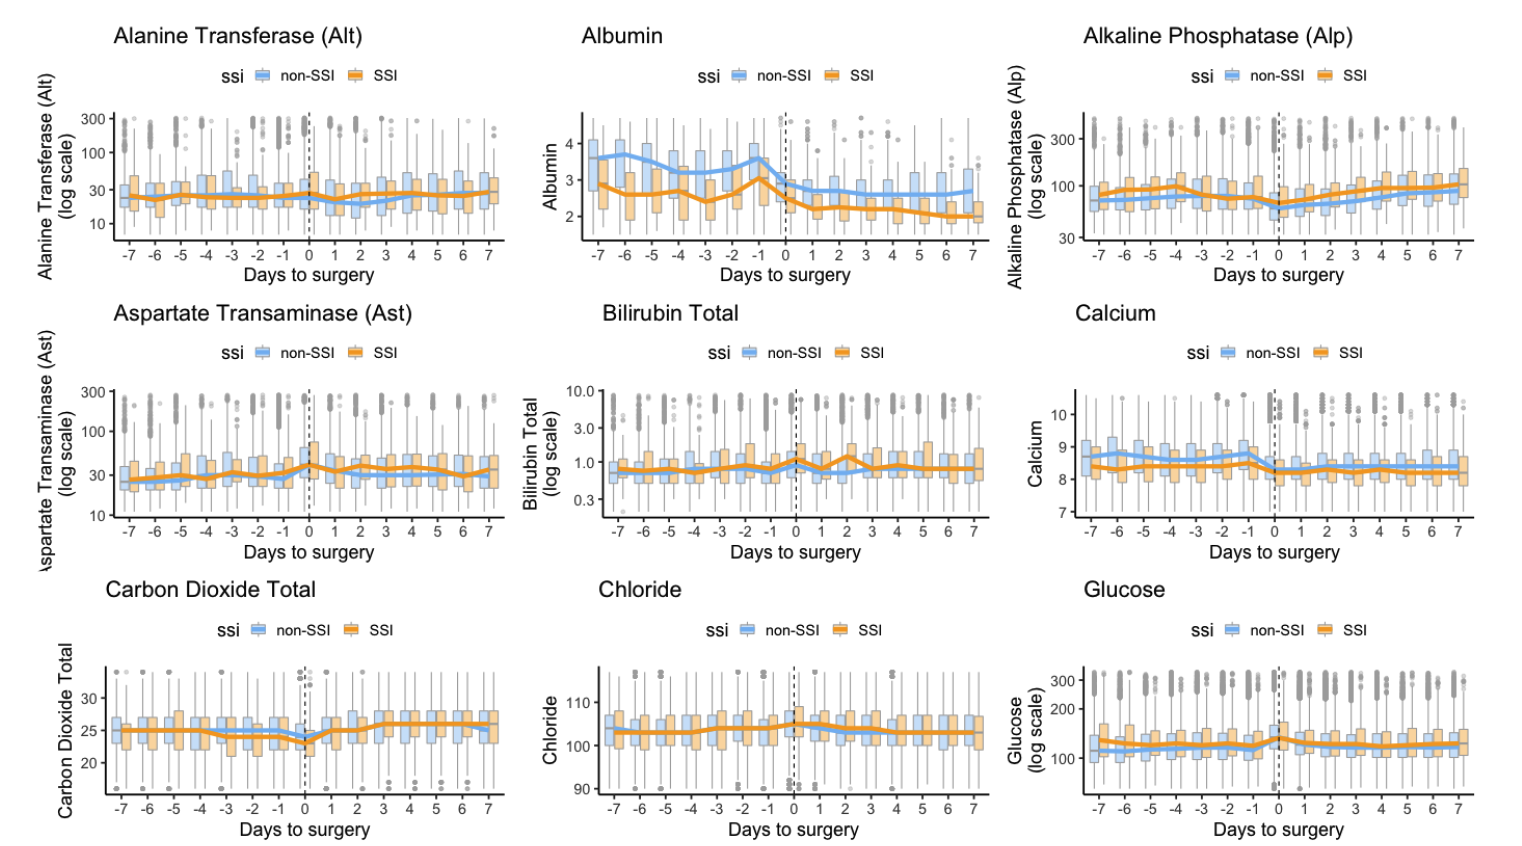
Labs
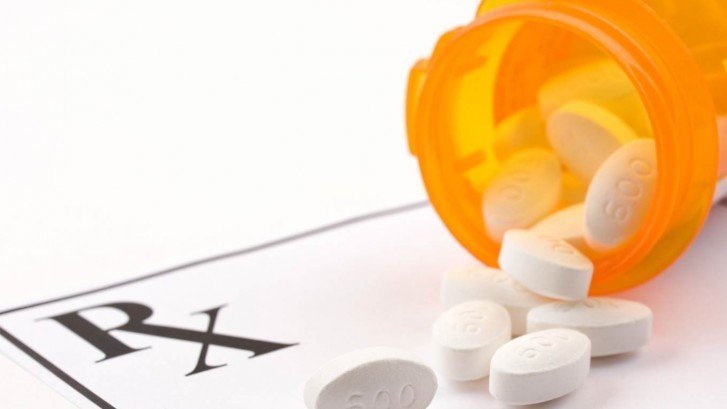
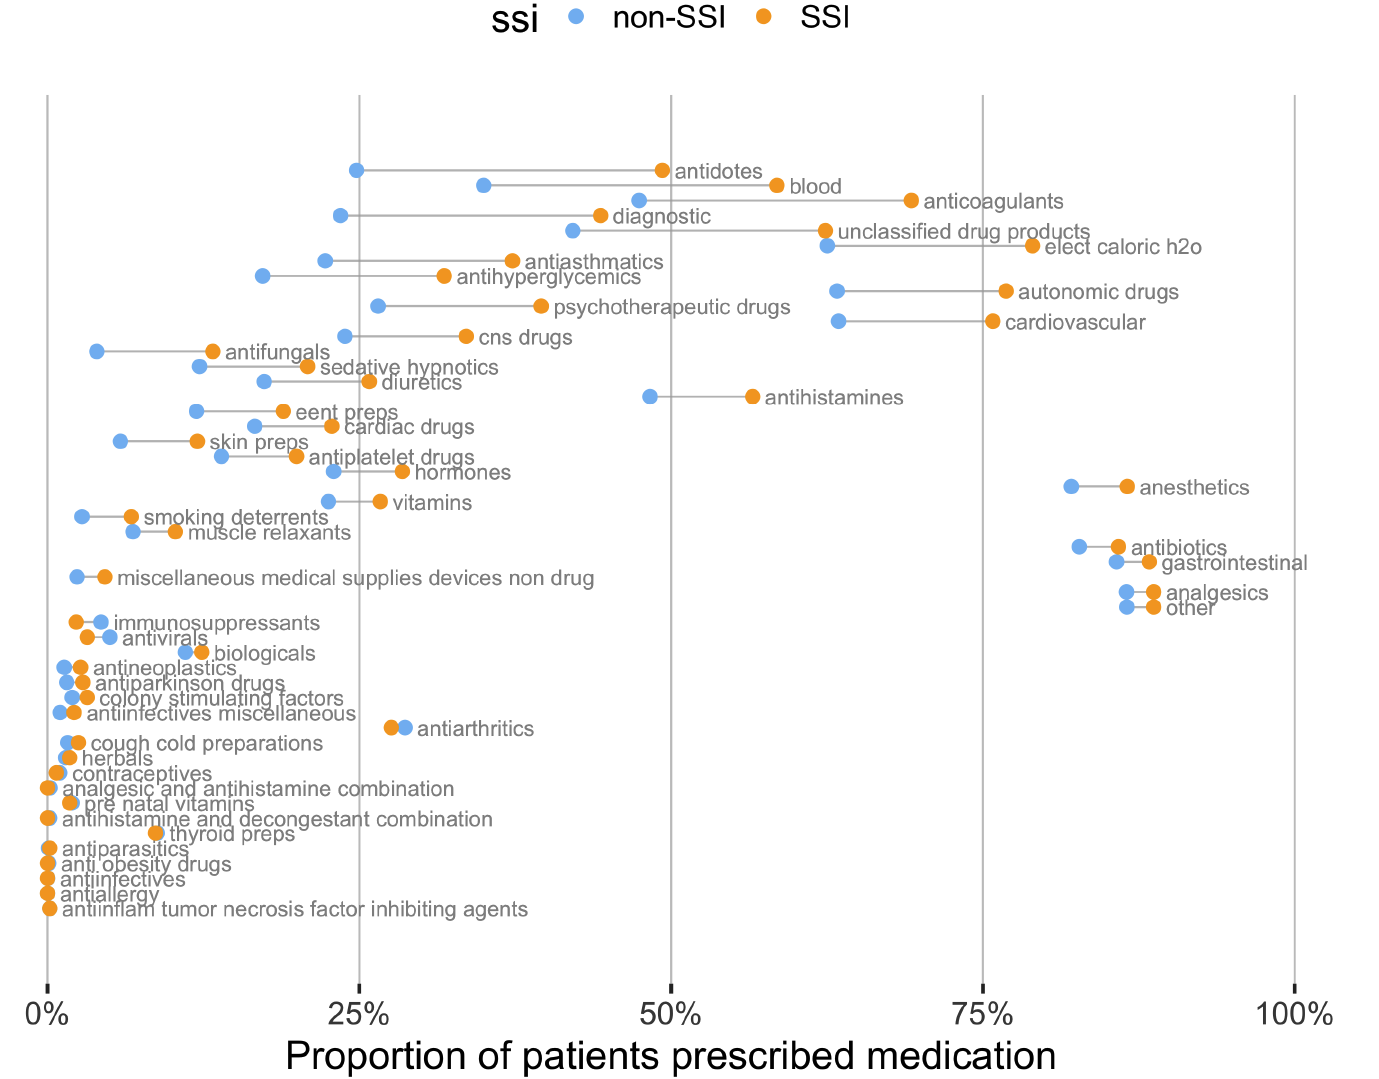
Medications
... Our idea
Obtaining NHSN and EHR data
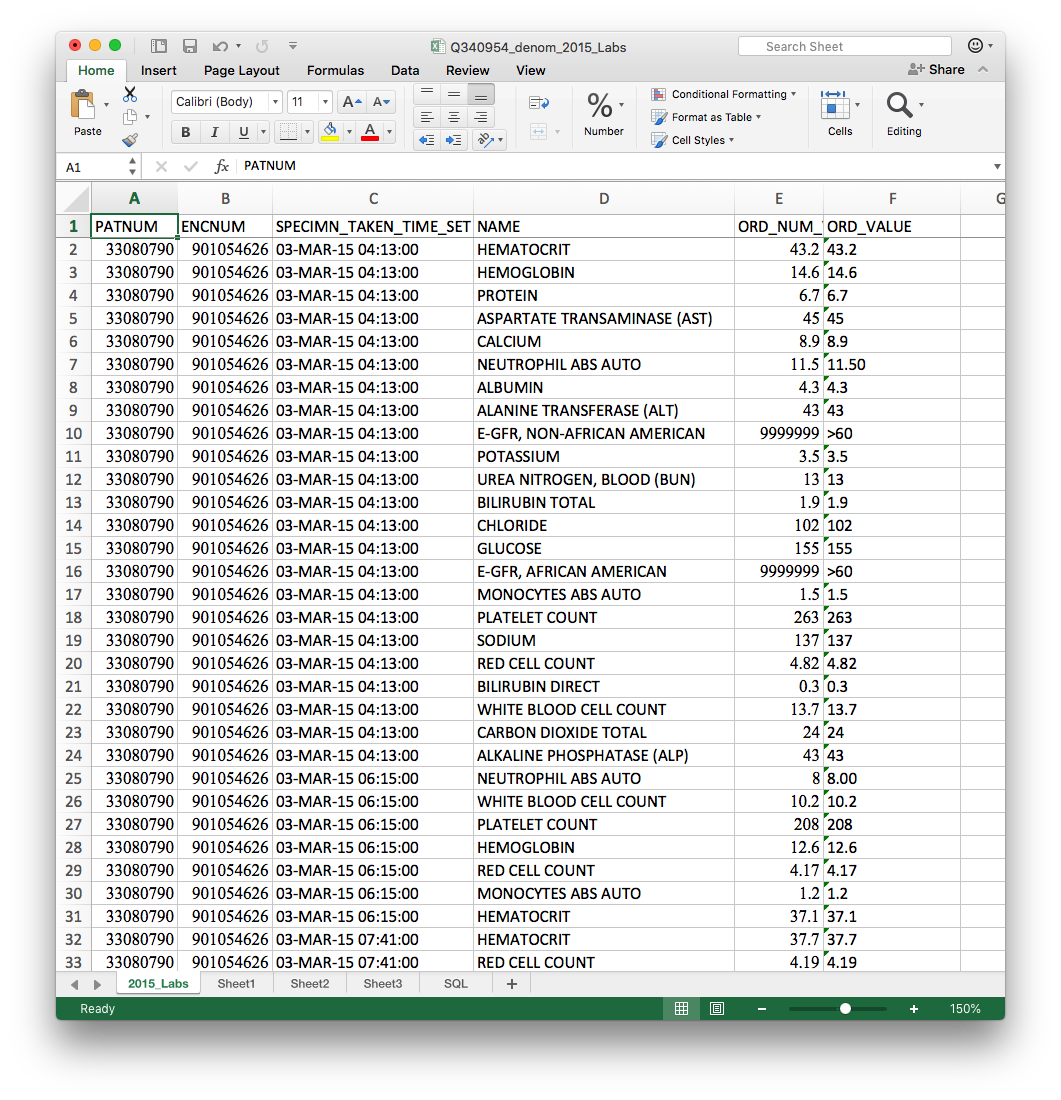
The data is large and messy
Data was split across
- one file per year (2014-2017)
- multiple sheets within each excel file
for multiple types of data
- Labs
- Medications
- Previous diagnoses
- Problem list
- Vitals
- NHSN file (patient + surgery info)
Total: 26 excel files, each with multiple sheets

Combining the data was tricky...
The different sheets had slightly different column names, so initially everything beyond the first sheet was missing
Filenames differed slightly by year:
-
2014: Prob_List.xlsx
-
2015: Prob_list.xlsx
-
2016: Problem_list.xlsx
-
2017: Problem_List.xlsx
In 2017 there were two vitals datasets: *Vitals.xlsx and *Vitals_2
Defining complete datasets
Combined within data-types (across sheets and years)
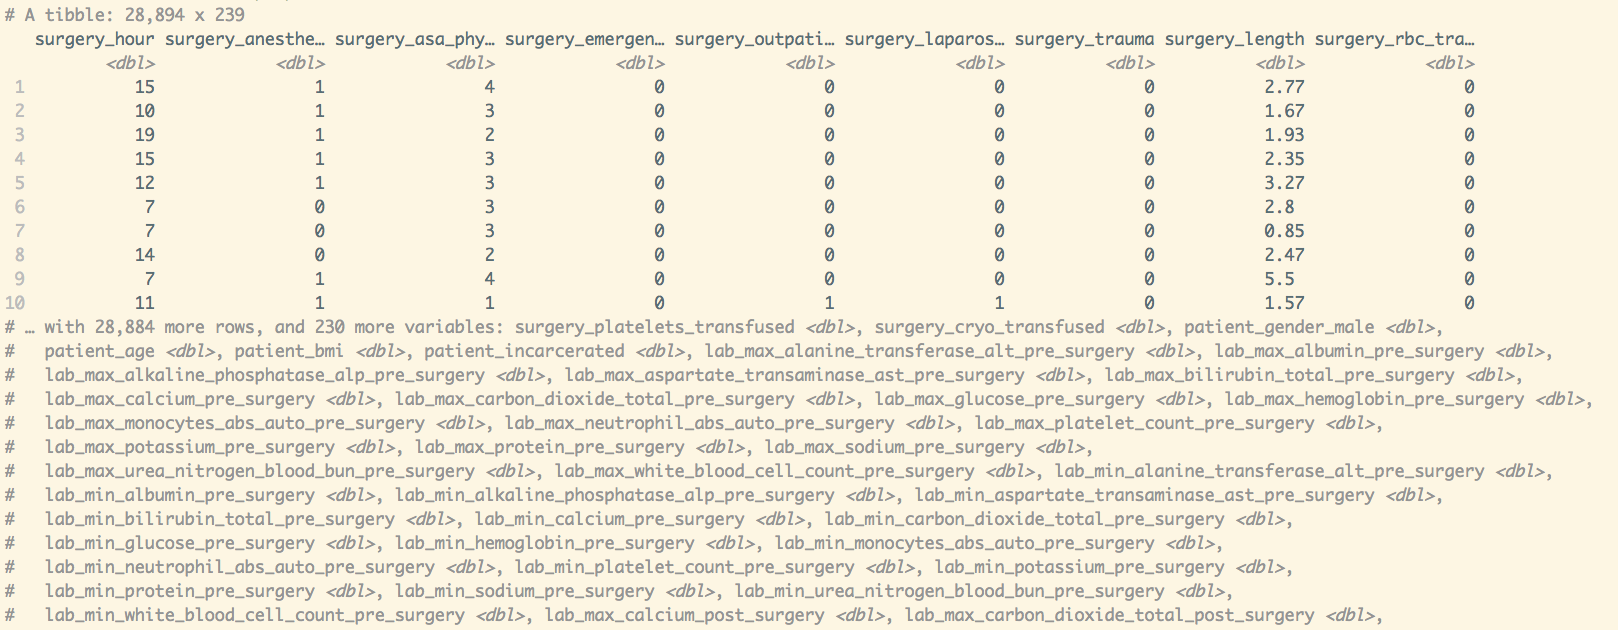
Goal: combine into a single covariate matrix
NHSN denominator data
39,174 rows and 44 variables
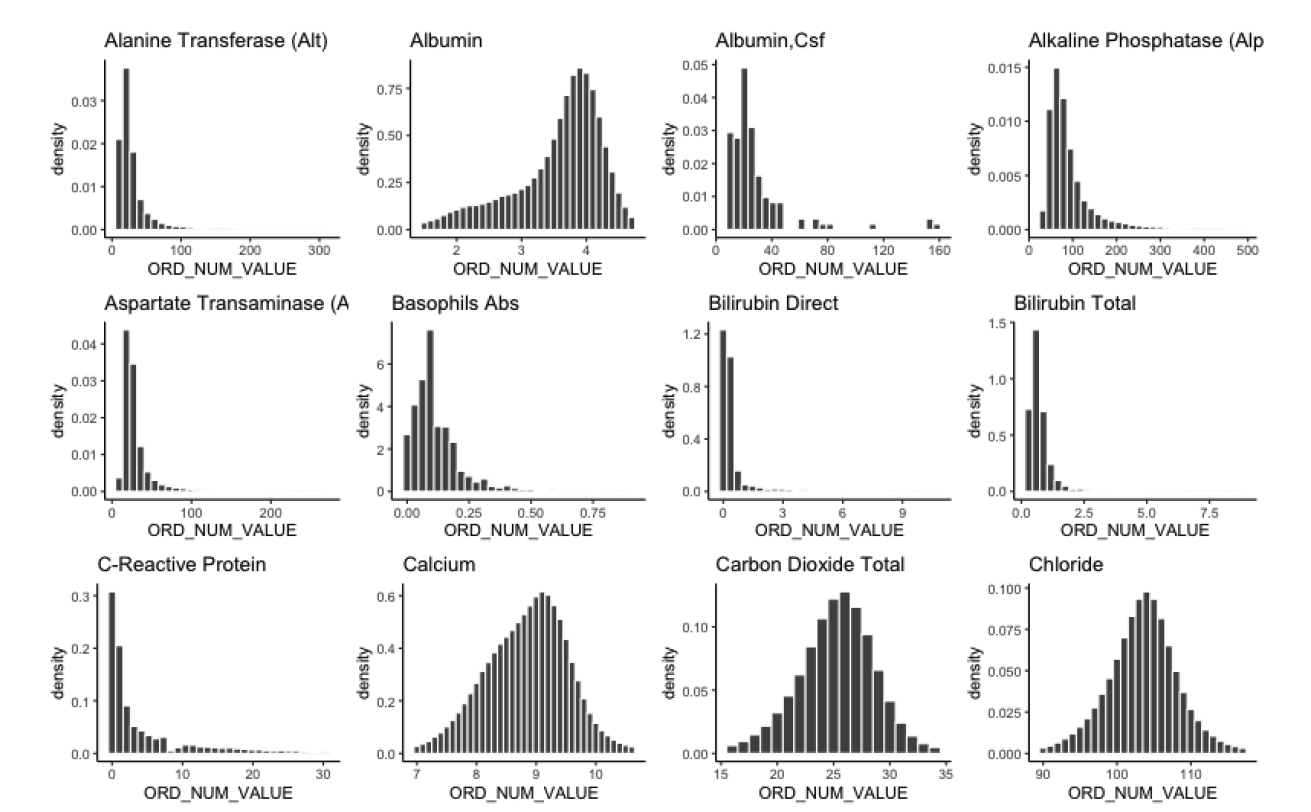
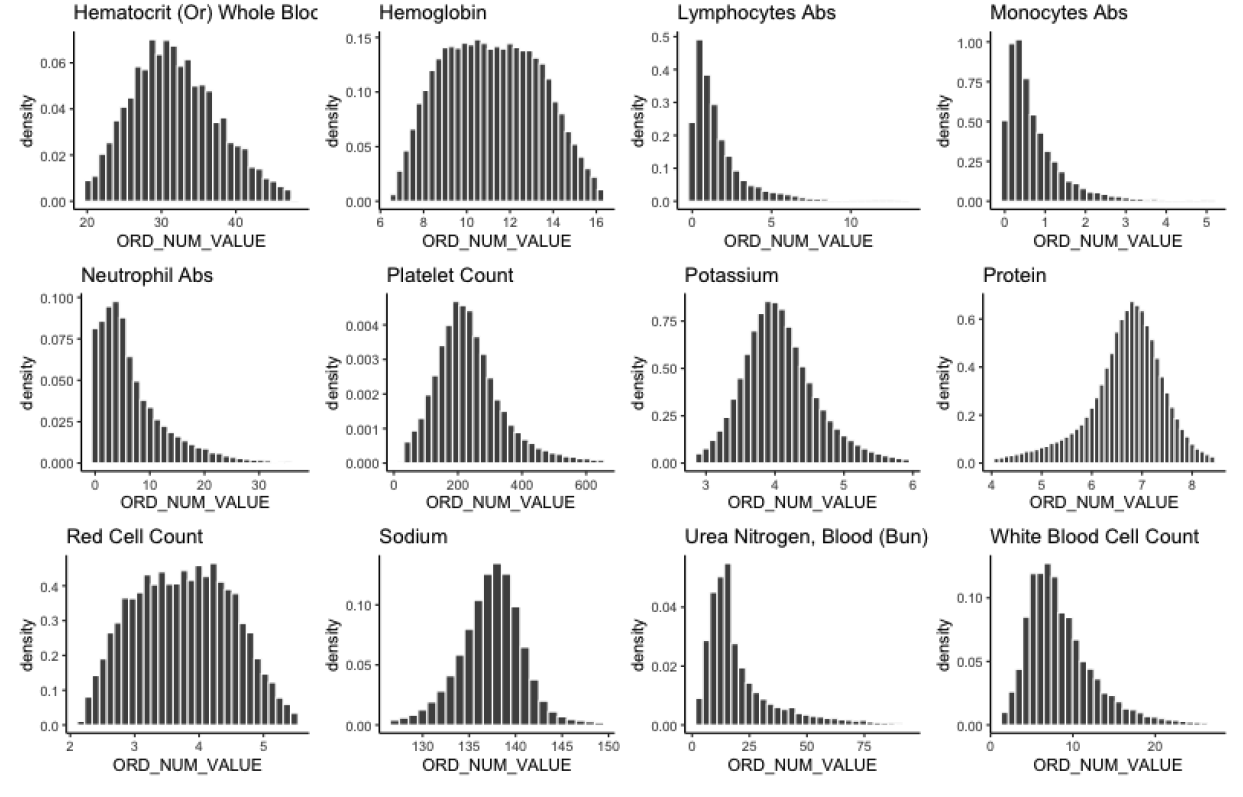
Lab EHR data
12,927,273 rows across 30 lab variables
Vitals EHR data
8,666,375 rows across 9 vitals measurements (including pulse and temperature)
Medication EHR data
7,637,621 rows across 50 medication classes
Converting from long to wide form
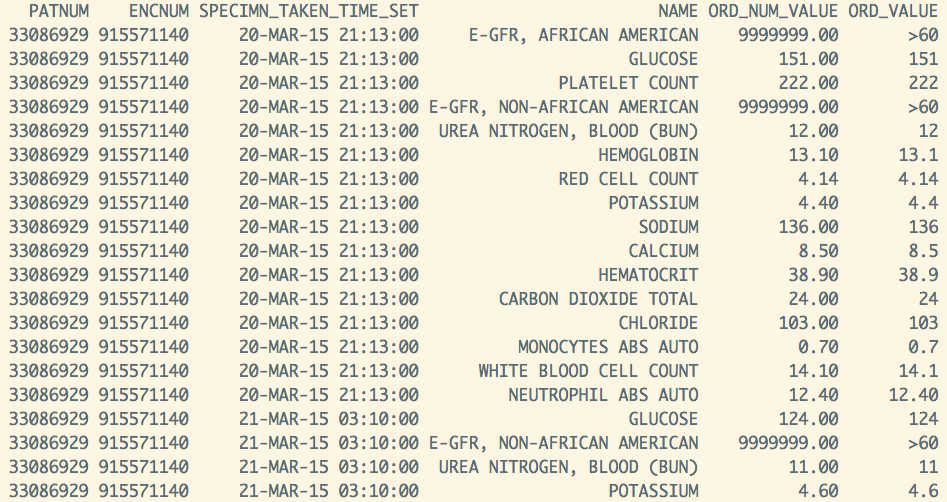
Lab data
(long-form)
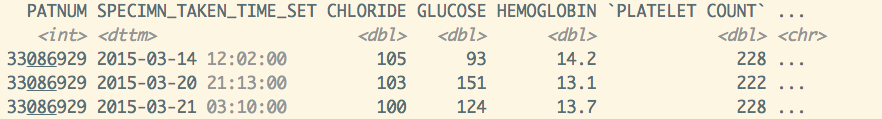
Lab data
(wide-form)
Want one row per surgery...
Summarising irregularly measured variables
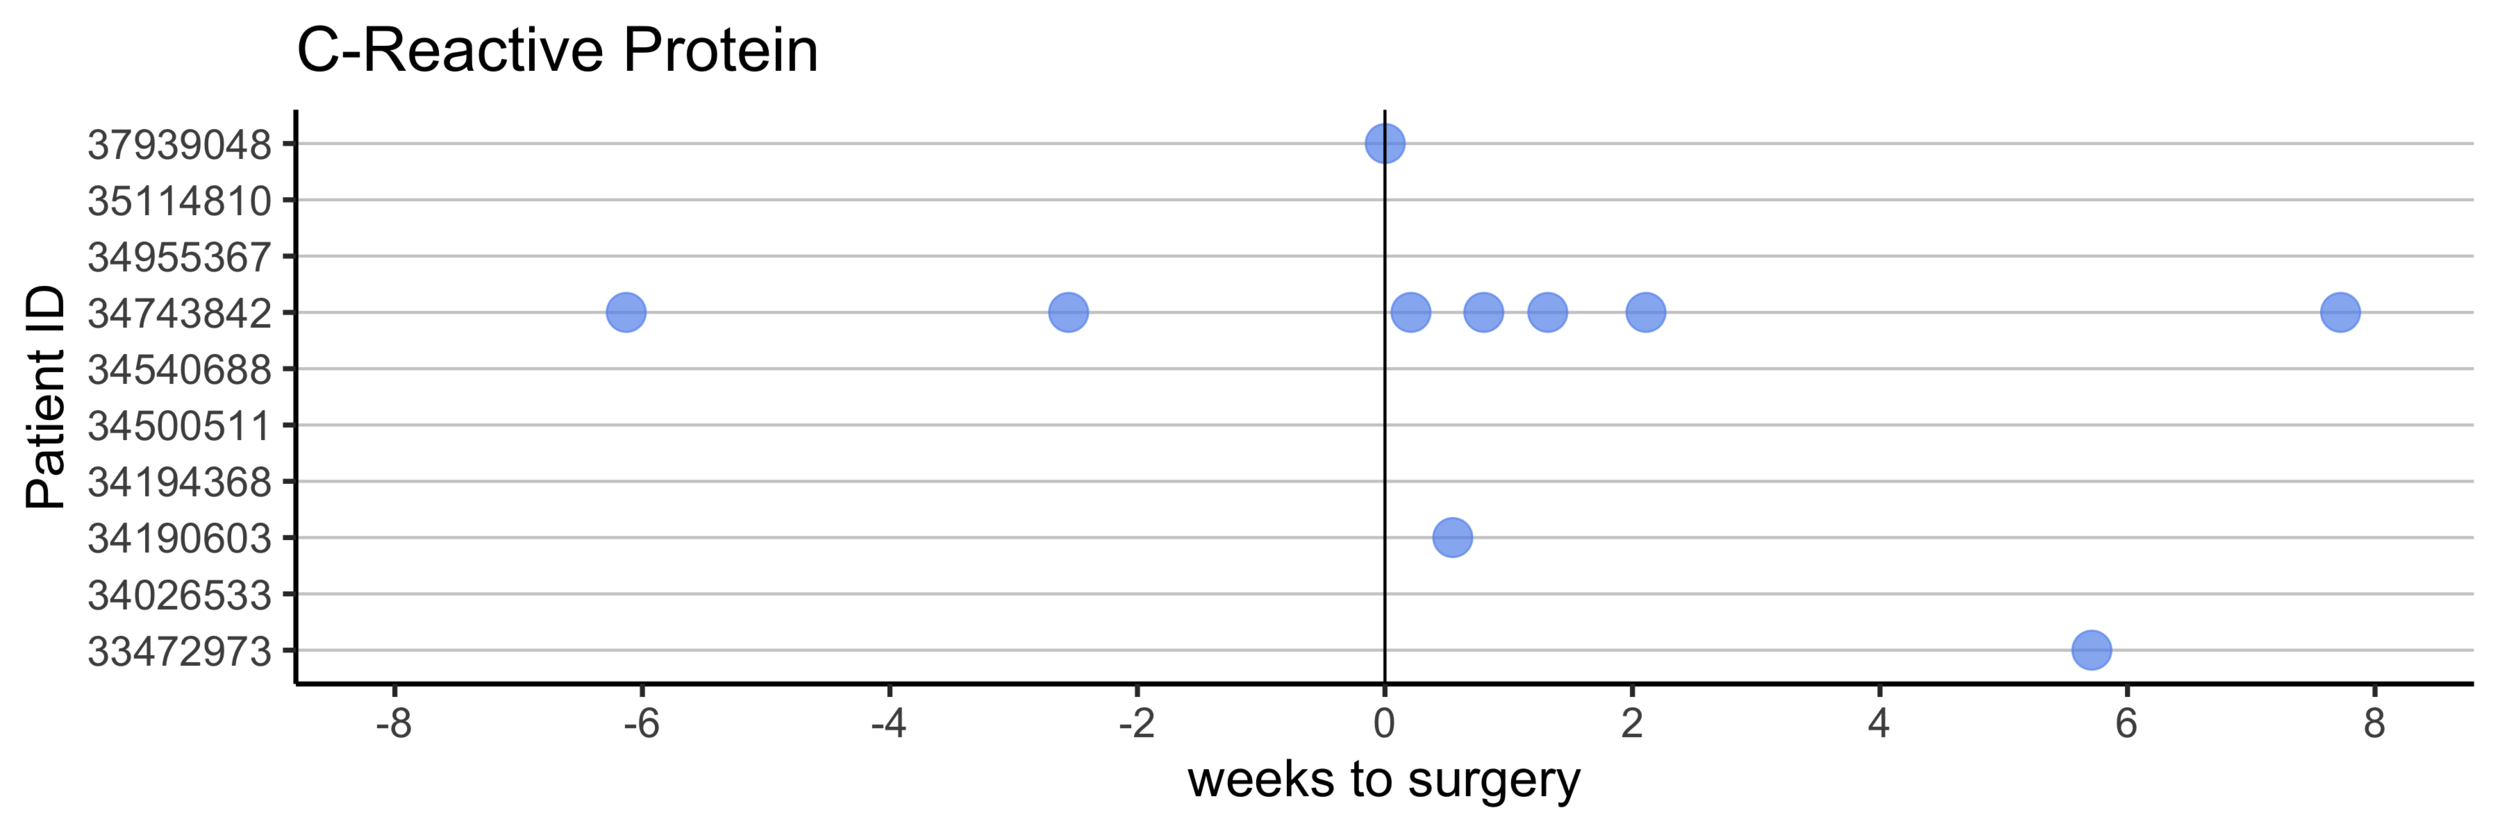
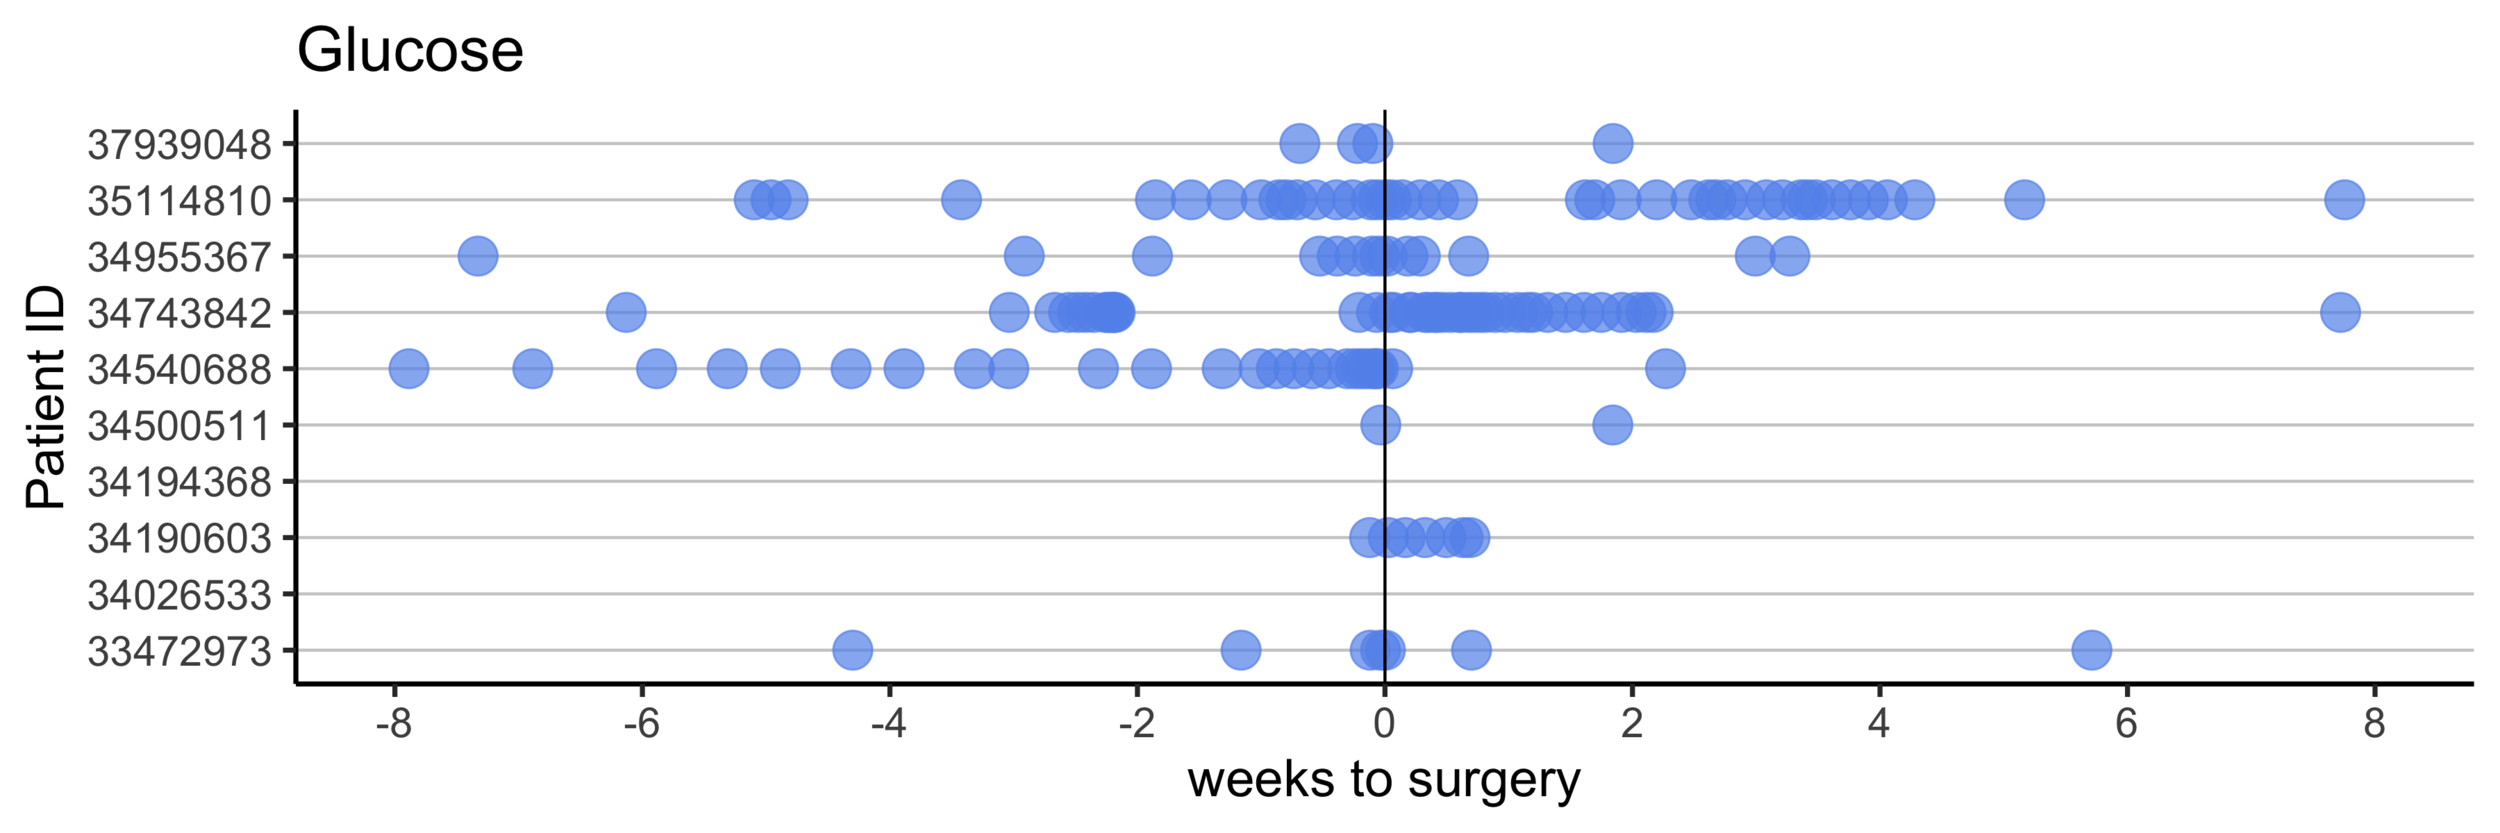
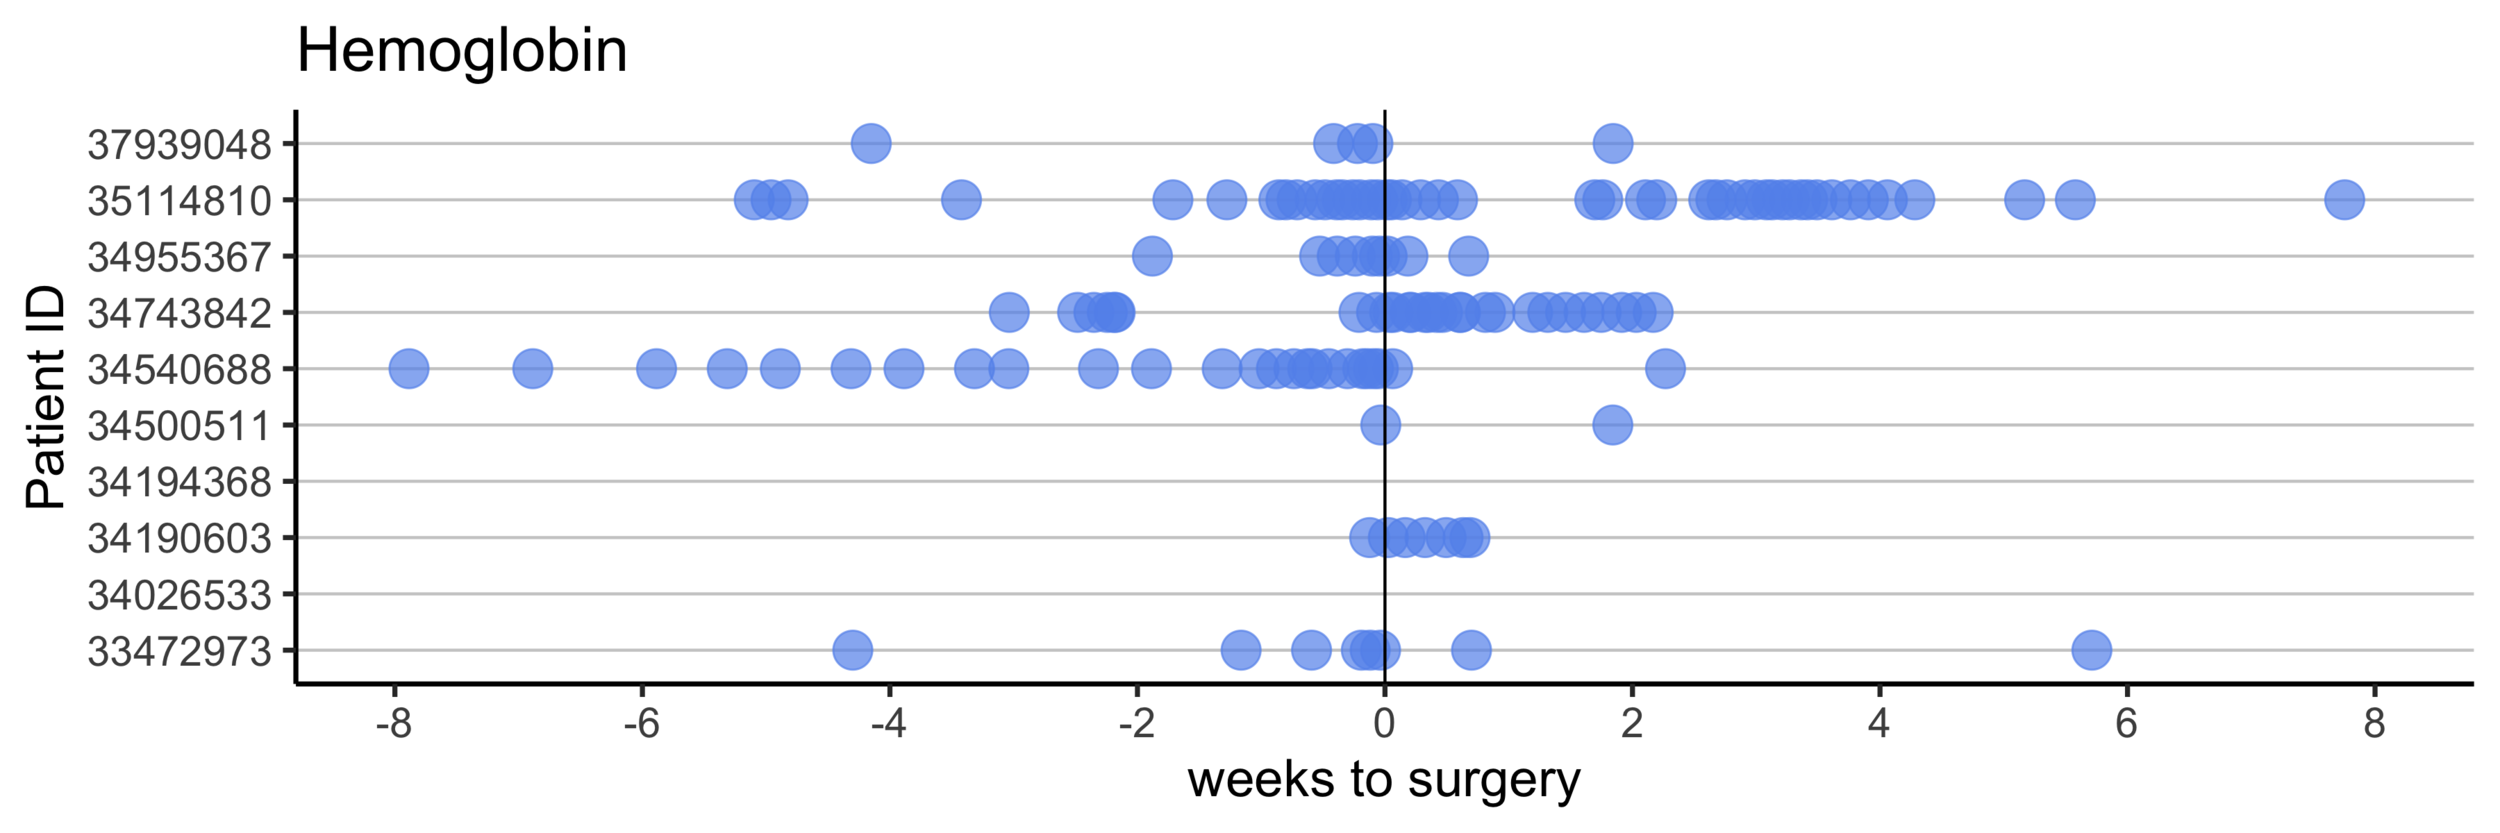
Take average value in the 30 days pre- and post-surgery
Remove labs that have missing values for more than 30% of patients
Combining by patient ID and date
Each row is a single surgery
Handling missing data
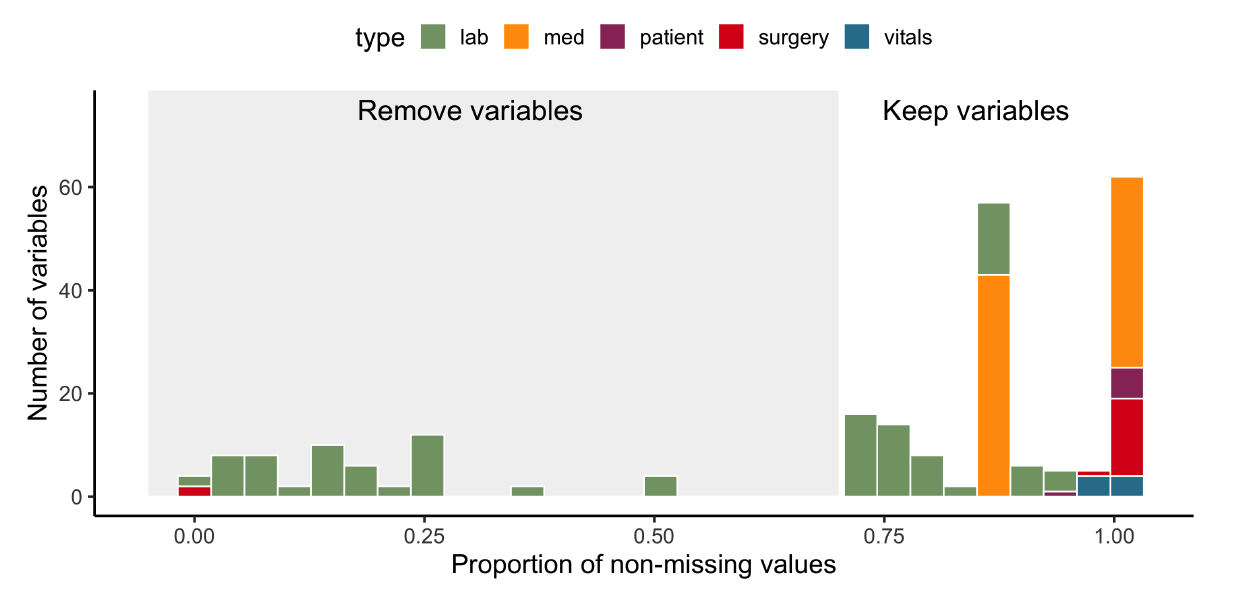
Impute
missing values
Remove variables with fewer than 70% non-missing values
Data imputation
Imputation via Random Forest missRanger
Stekhoven, D. J. & Buhlmann, P. (2011) MissForest- non-parametric missing value imputation for mixed-type data.
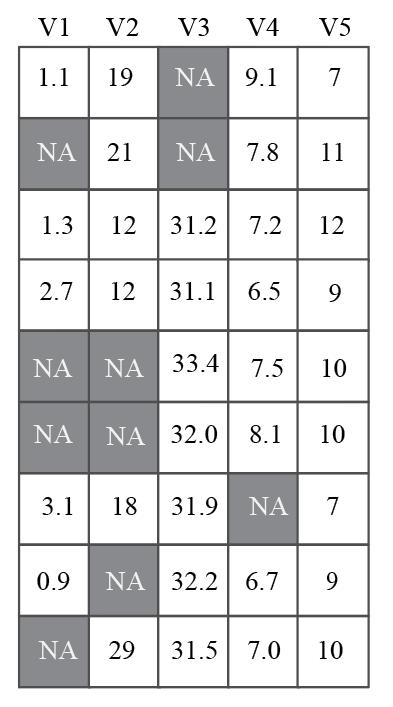

Fit RF model
Plug into RF model
2.3
2.0
3.2
1.6
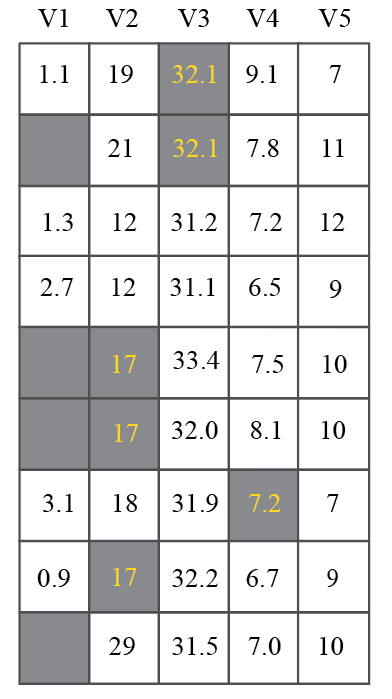
Data imputation
Imputation via Random Forest missRanger
Stekhoven, D. J. & Buhlmann, P. (2011) MissForest- non-parametric missing value imputation for mixed-type data.
Fit RF model
Plug into RF model
2.3
2.0
1.6
3.2
1.6
1.6
2.3
2.0
3.2
19
25
21
Run through all variables
Iterate until matrix change between iterations is small
Data oddities
- Four patients reported with SSI whose surgeries did not appear in the main NHSN dataset
- Decided to remove them
- Missing surgery times in 13% of patients
- discussion and exploration revealed that UCD switched to an EPIC EHR system in July 2014
- Decided to remove all patients before July 2014
- Diagnosis codes were a mixture of ICD9 and ICD10
- Converted all diagnosis codes to ICD9
- Mistakes in definitions in the codebook
- Asked collaborators for clarifications
- Lab values that are >10000 but all others are in [0, 20]
- Did some research to discover that these values are possible...
The final covariate matrix
Number of surgeries: 37,881
Number of SSI cases: 790 (~2%)
Number of variables: 263
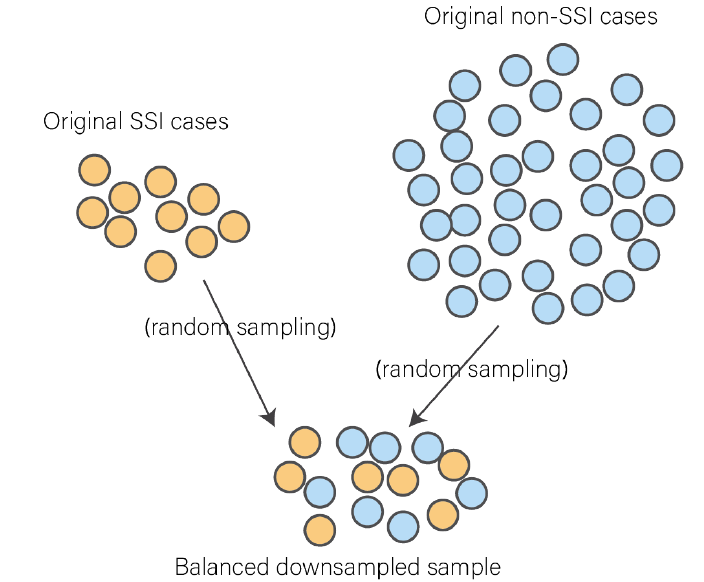
Predicting SSI
SSI is a rare event
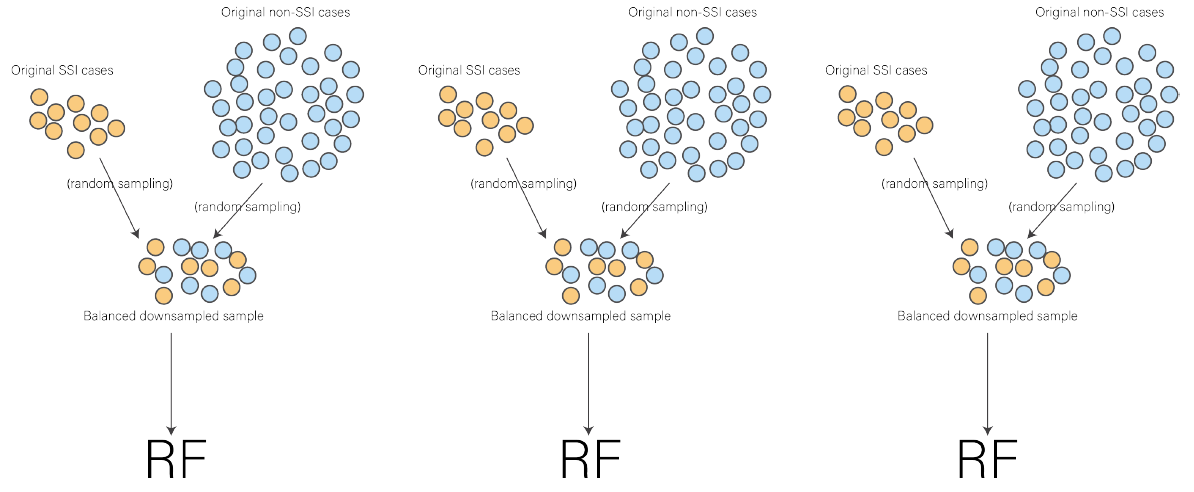
Repeated balanced subsampling
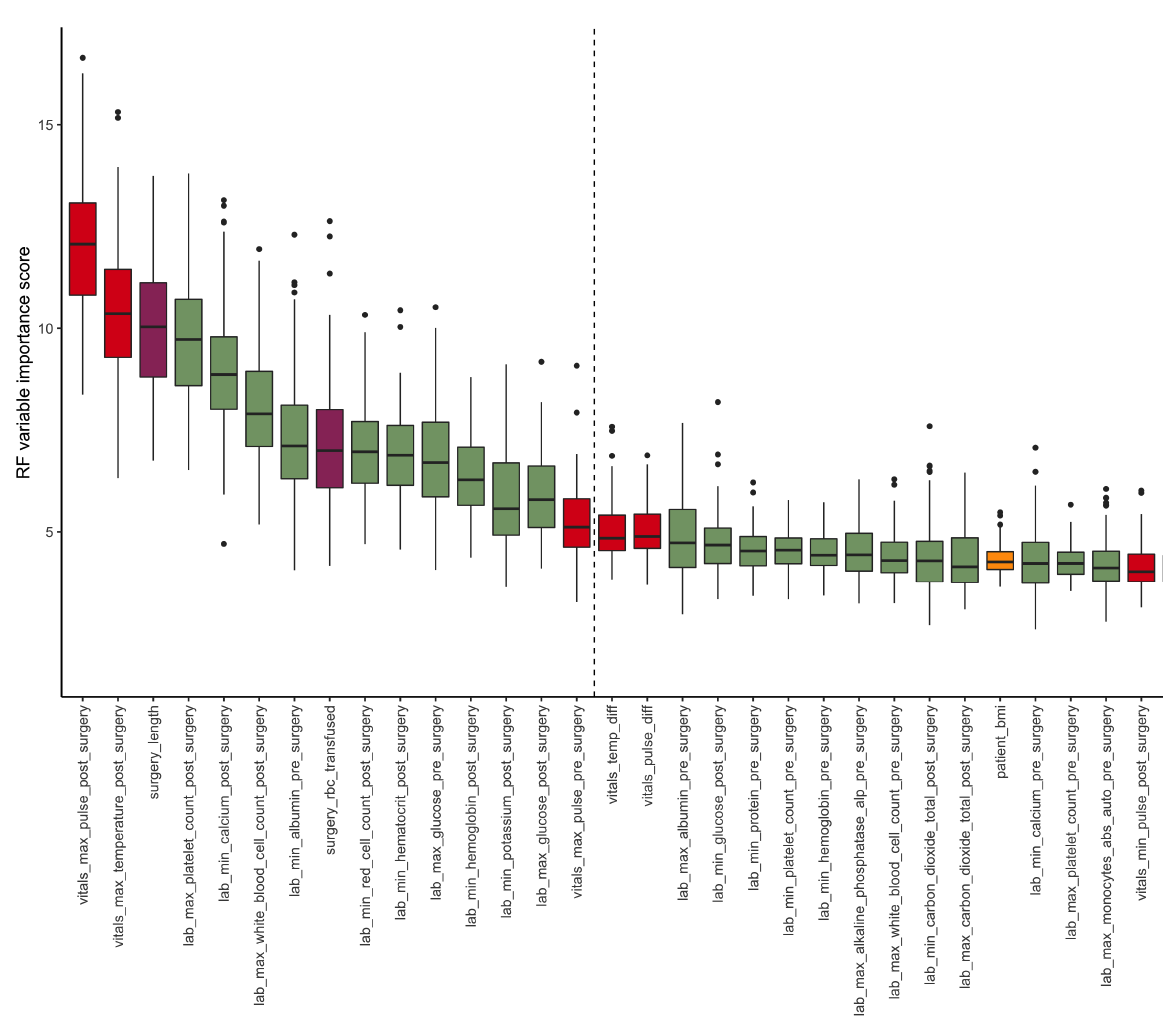
Feature selection
Variable importance
Variable importance
Variable importance
Feature selection

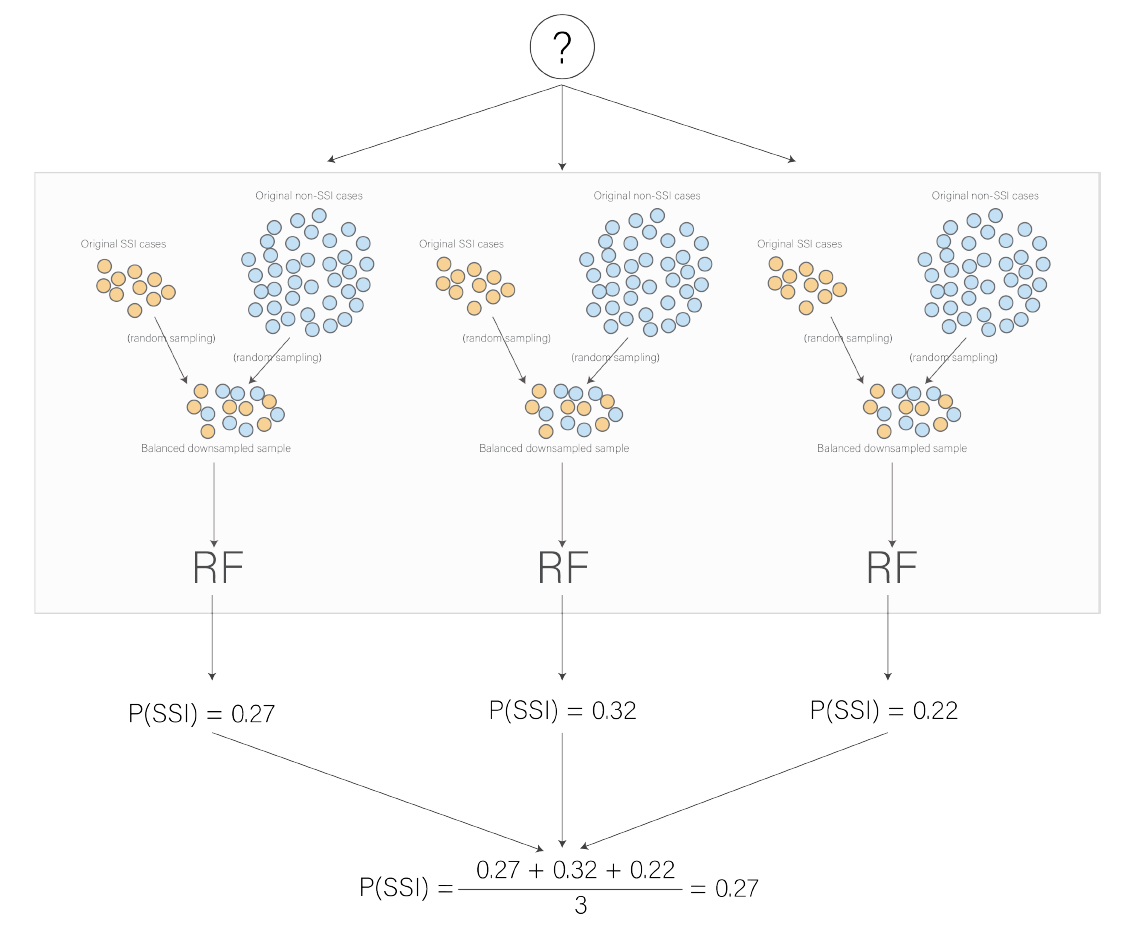
Aggregated RF model
(top 15)
(top 15)
(top 15)
Predicting SSI
(top 15)
(top 15)
(top 15)
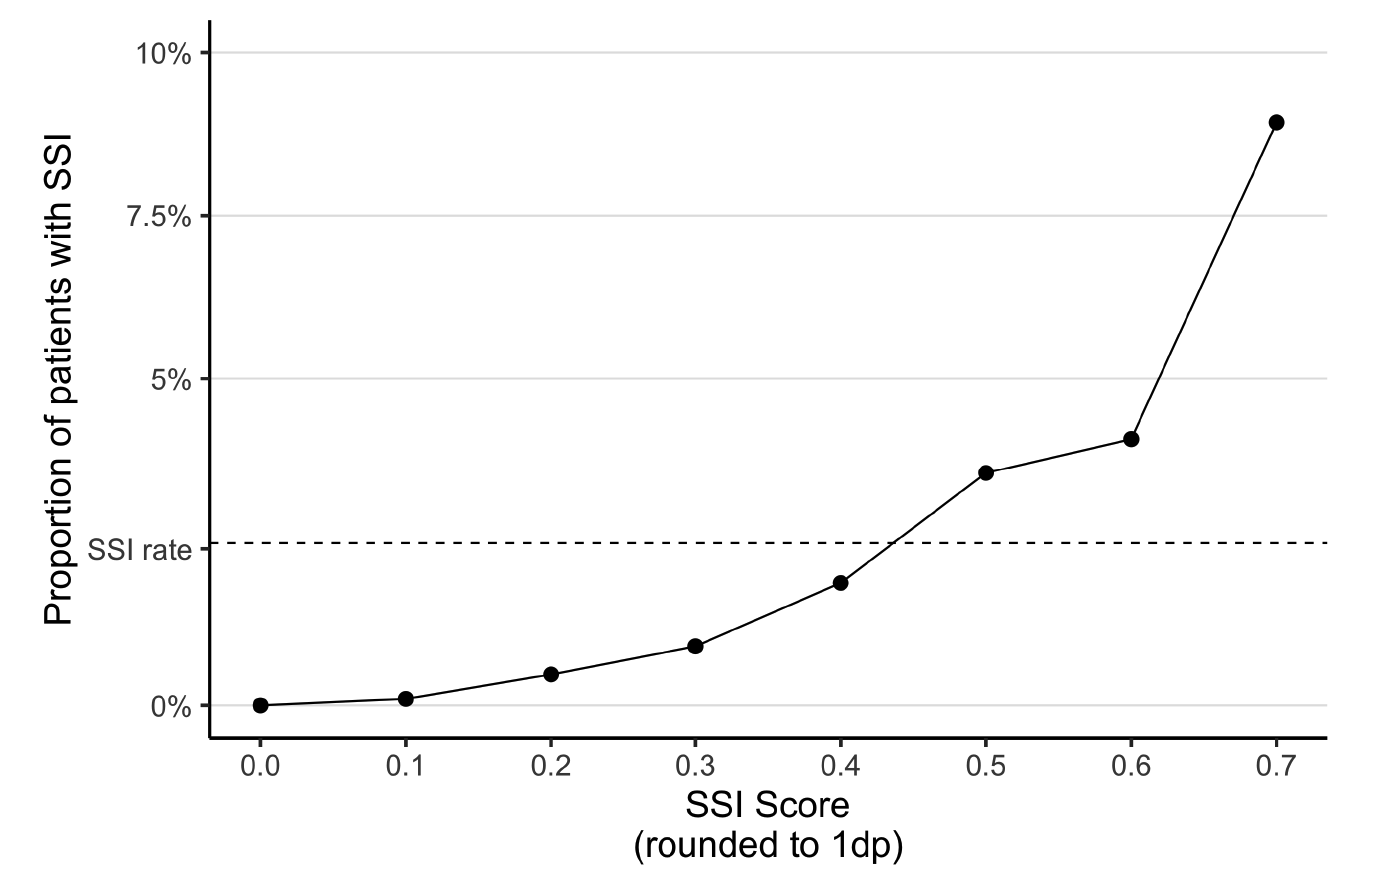
Performance Evaluation
Performance on test set
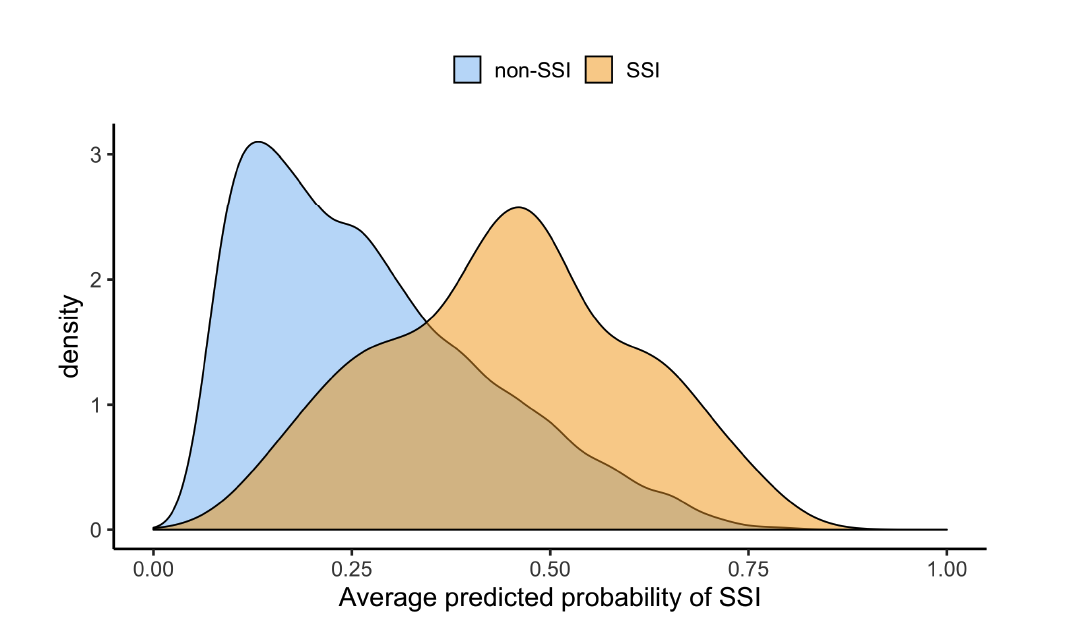
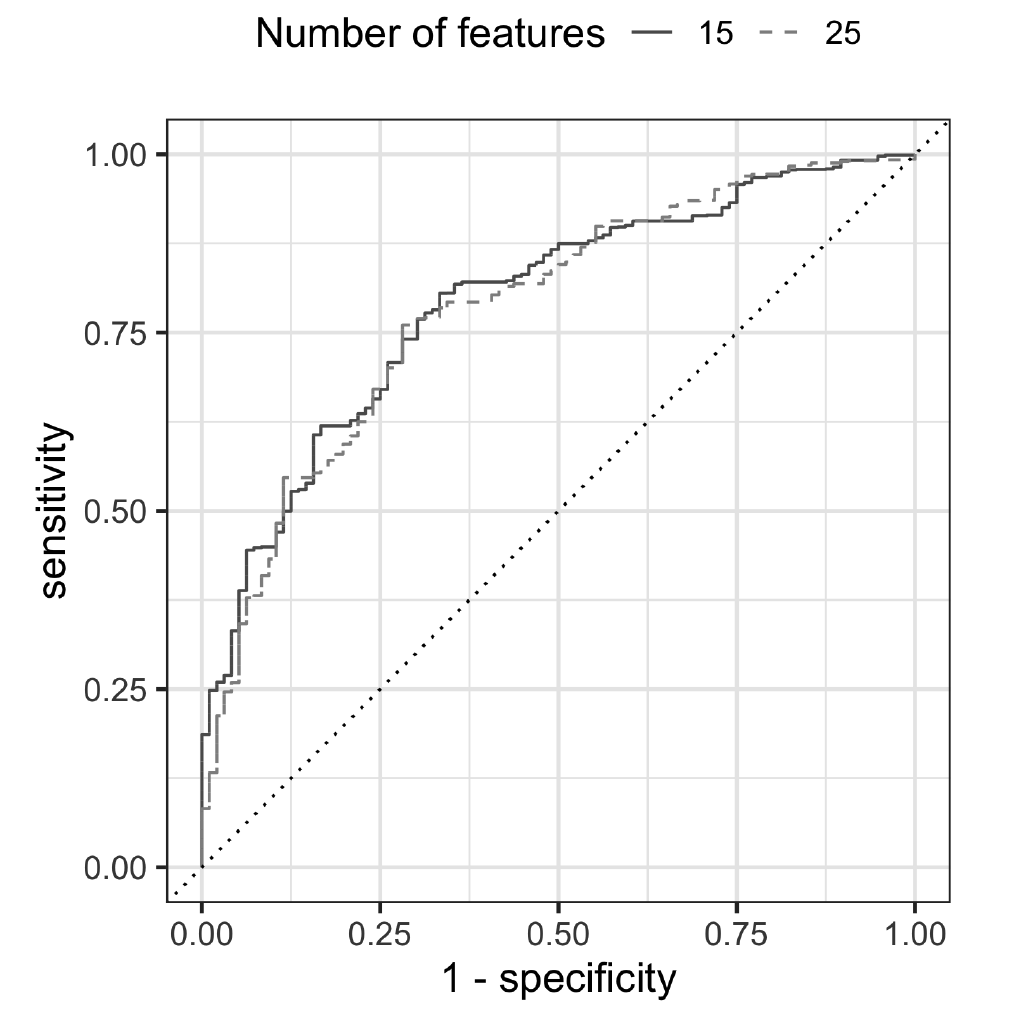
AUC 0.79
Comparing alternative approaches: single model
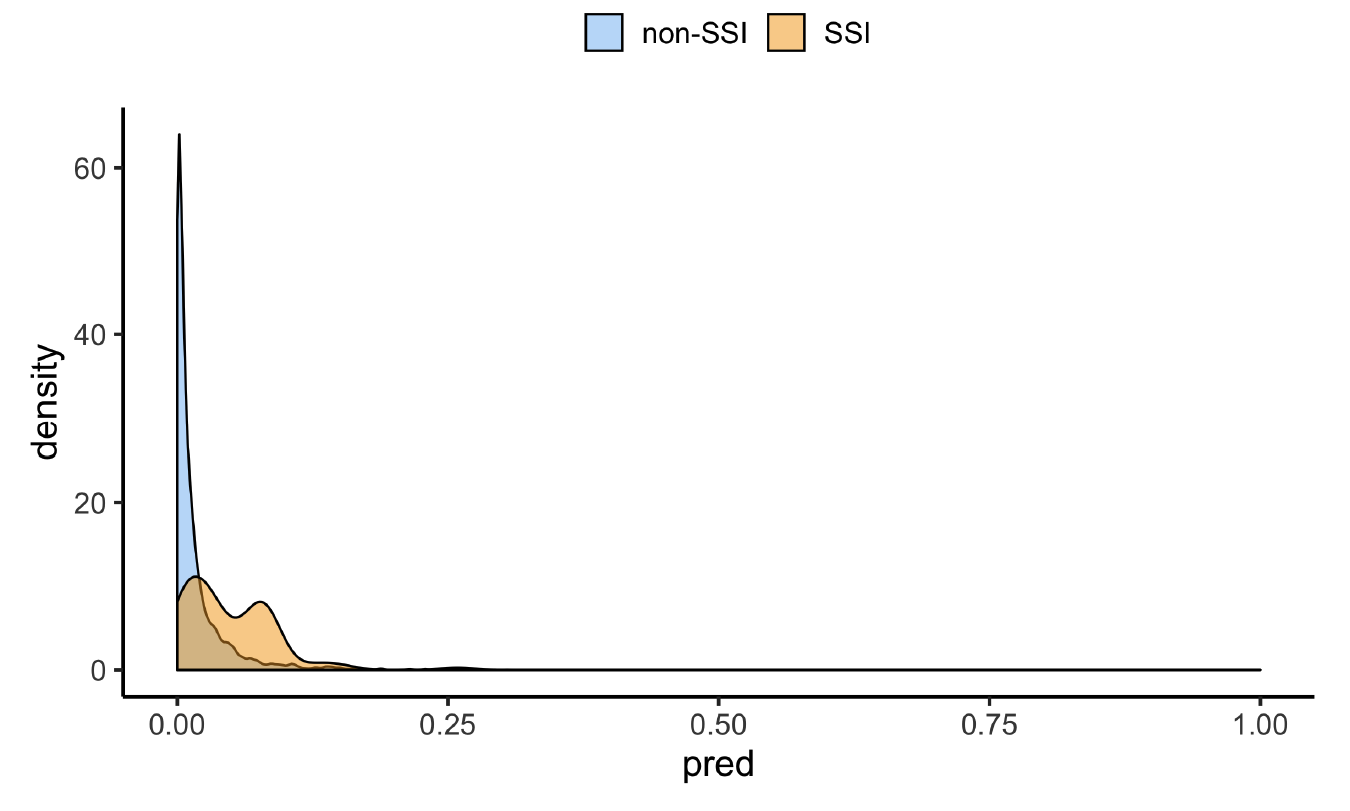
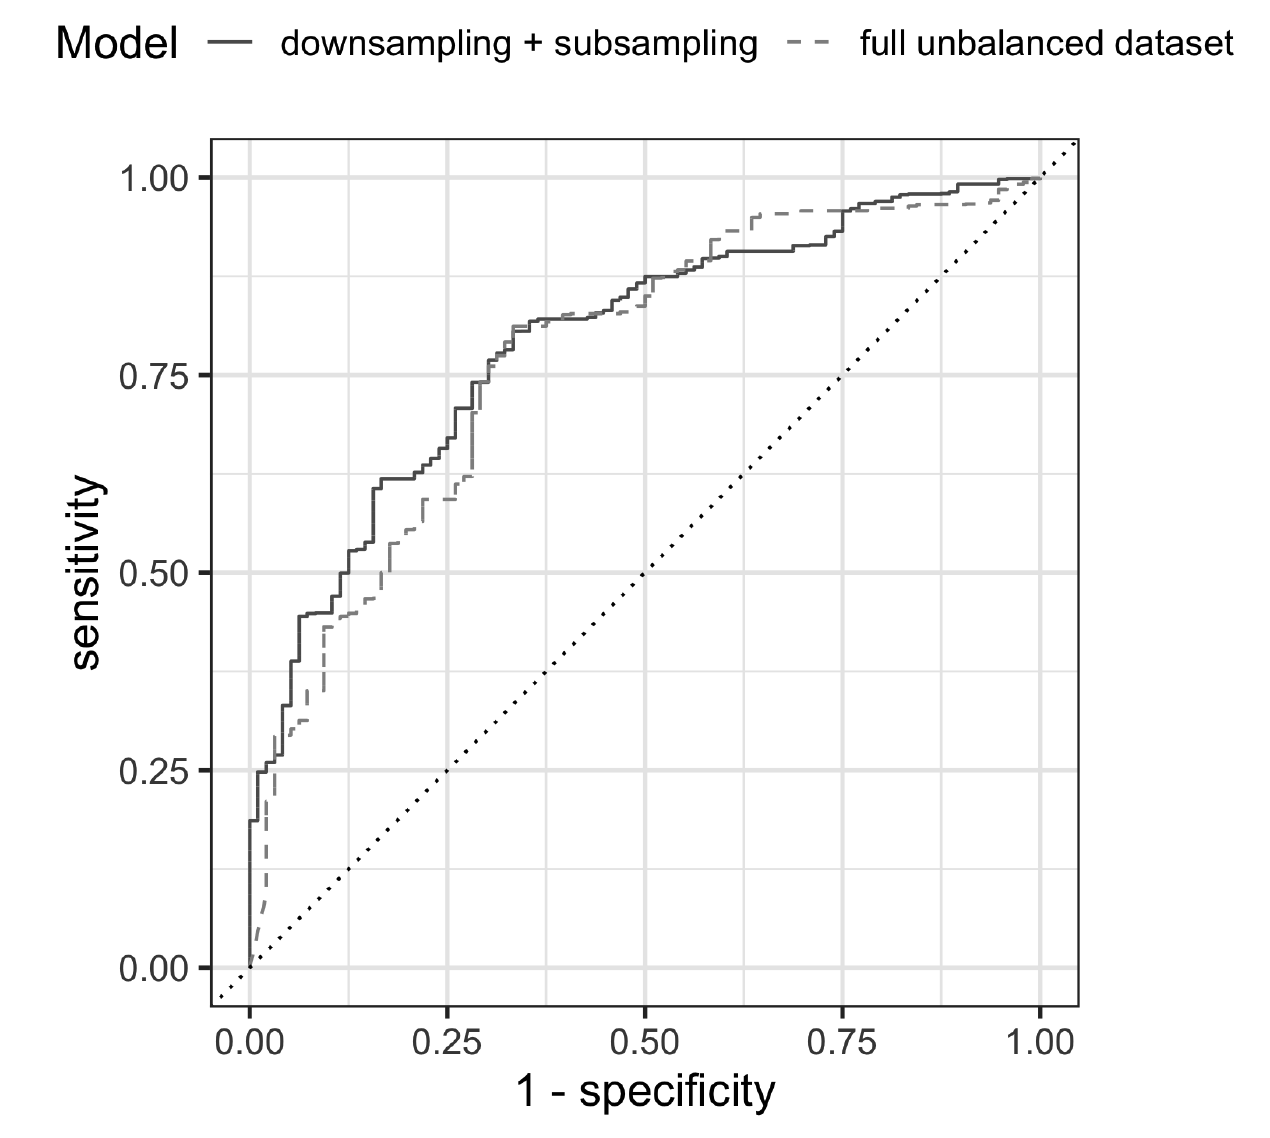
single-model
AUC: 0.77
Comparing alternative approaches: Up/Downsampling
Upsampling
Downsampling
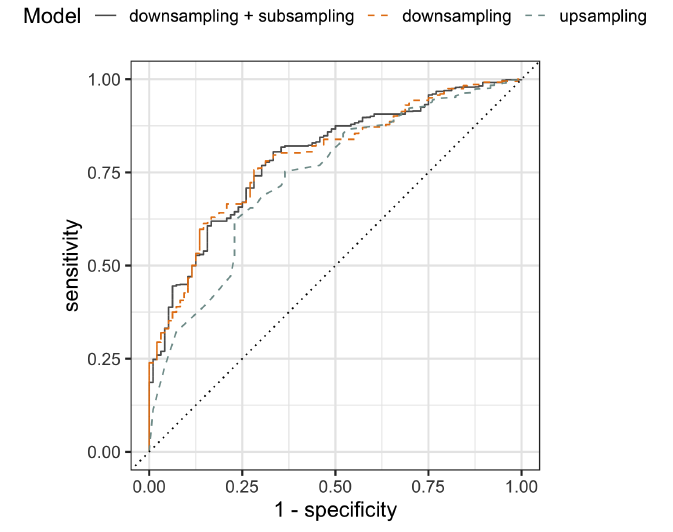
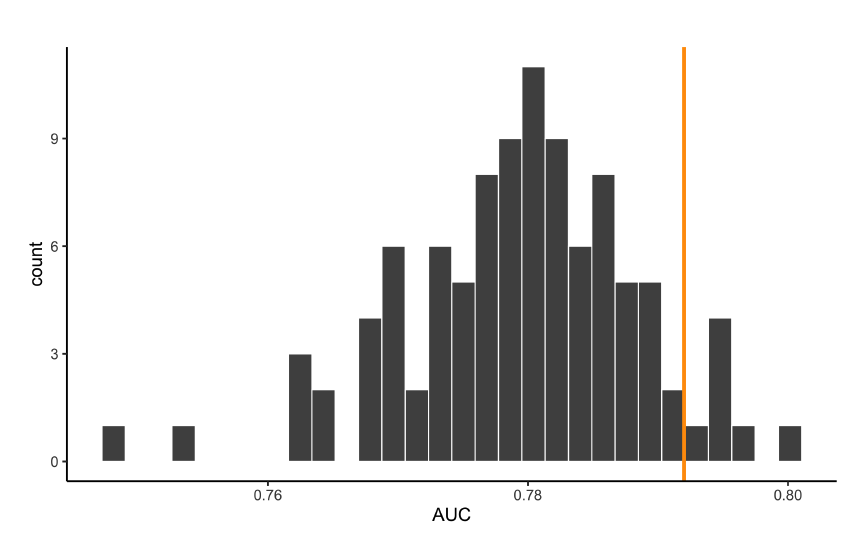
Comparing many downsampling results with our aggregate approach
Comparing alternative approaches: NHSN variables only
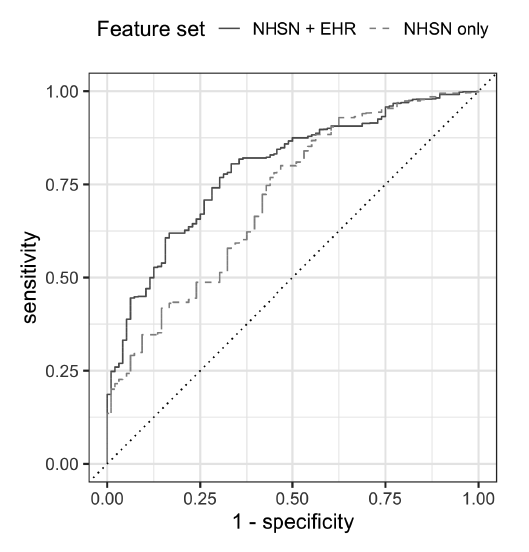
NHSN-only
AUC: 0.73
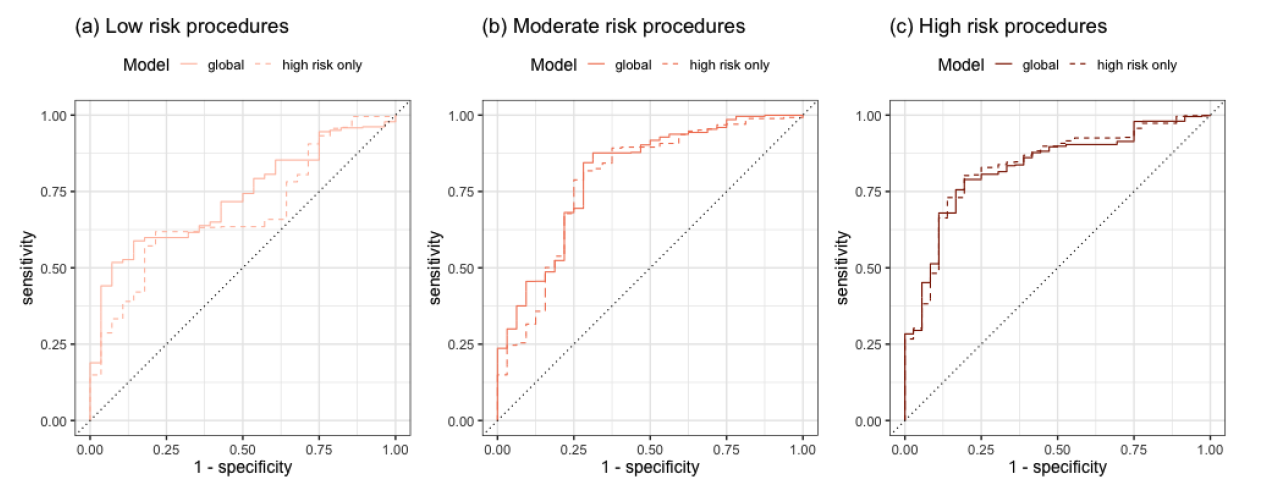
Comparing alternative approaches: grouping procedures by risk
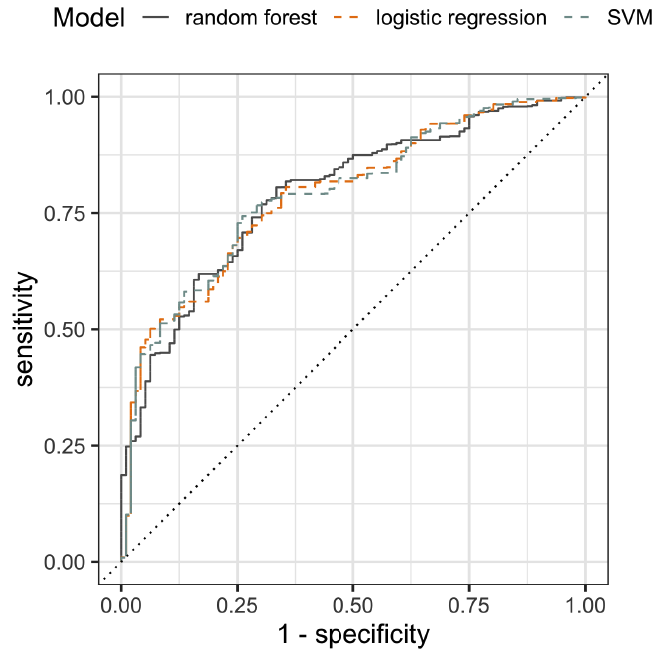
Comparing alternative approaches: SVM and logistic regression
Conclusion
Takeaways
SSI is really hard to predict.
We incorporated EHR data
Our model has an AUC of 0.79 on the test set
Aggregating many balanced models seems to work very well (at least for this problem!)
...
We will soon be testing on a cohort from the Davis VA hospital
... and would like to develop a GUI for the Davis surgeons