Retour d'expérience
@sveltejs/pancake
Roman Karavia, 2020-09-27
GitHub / Twitter: @rkaravia

Svelte Society Day
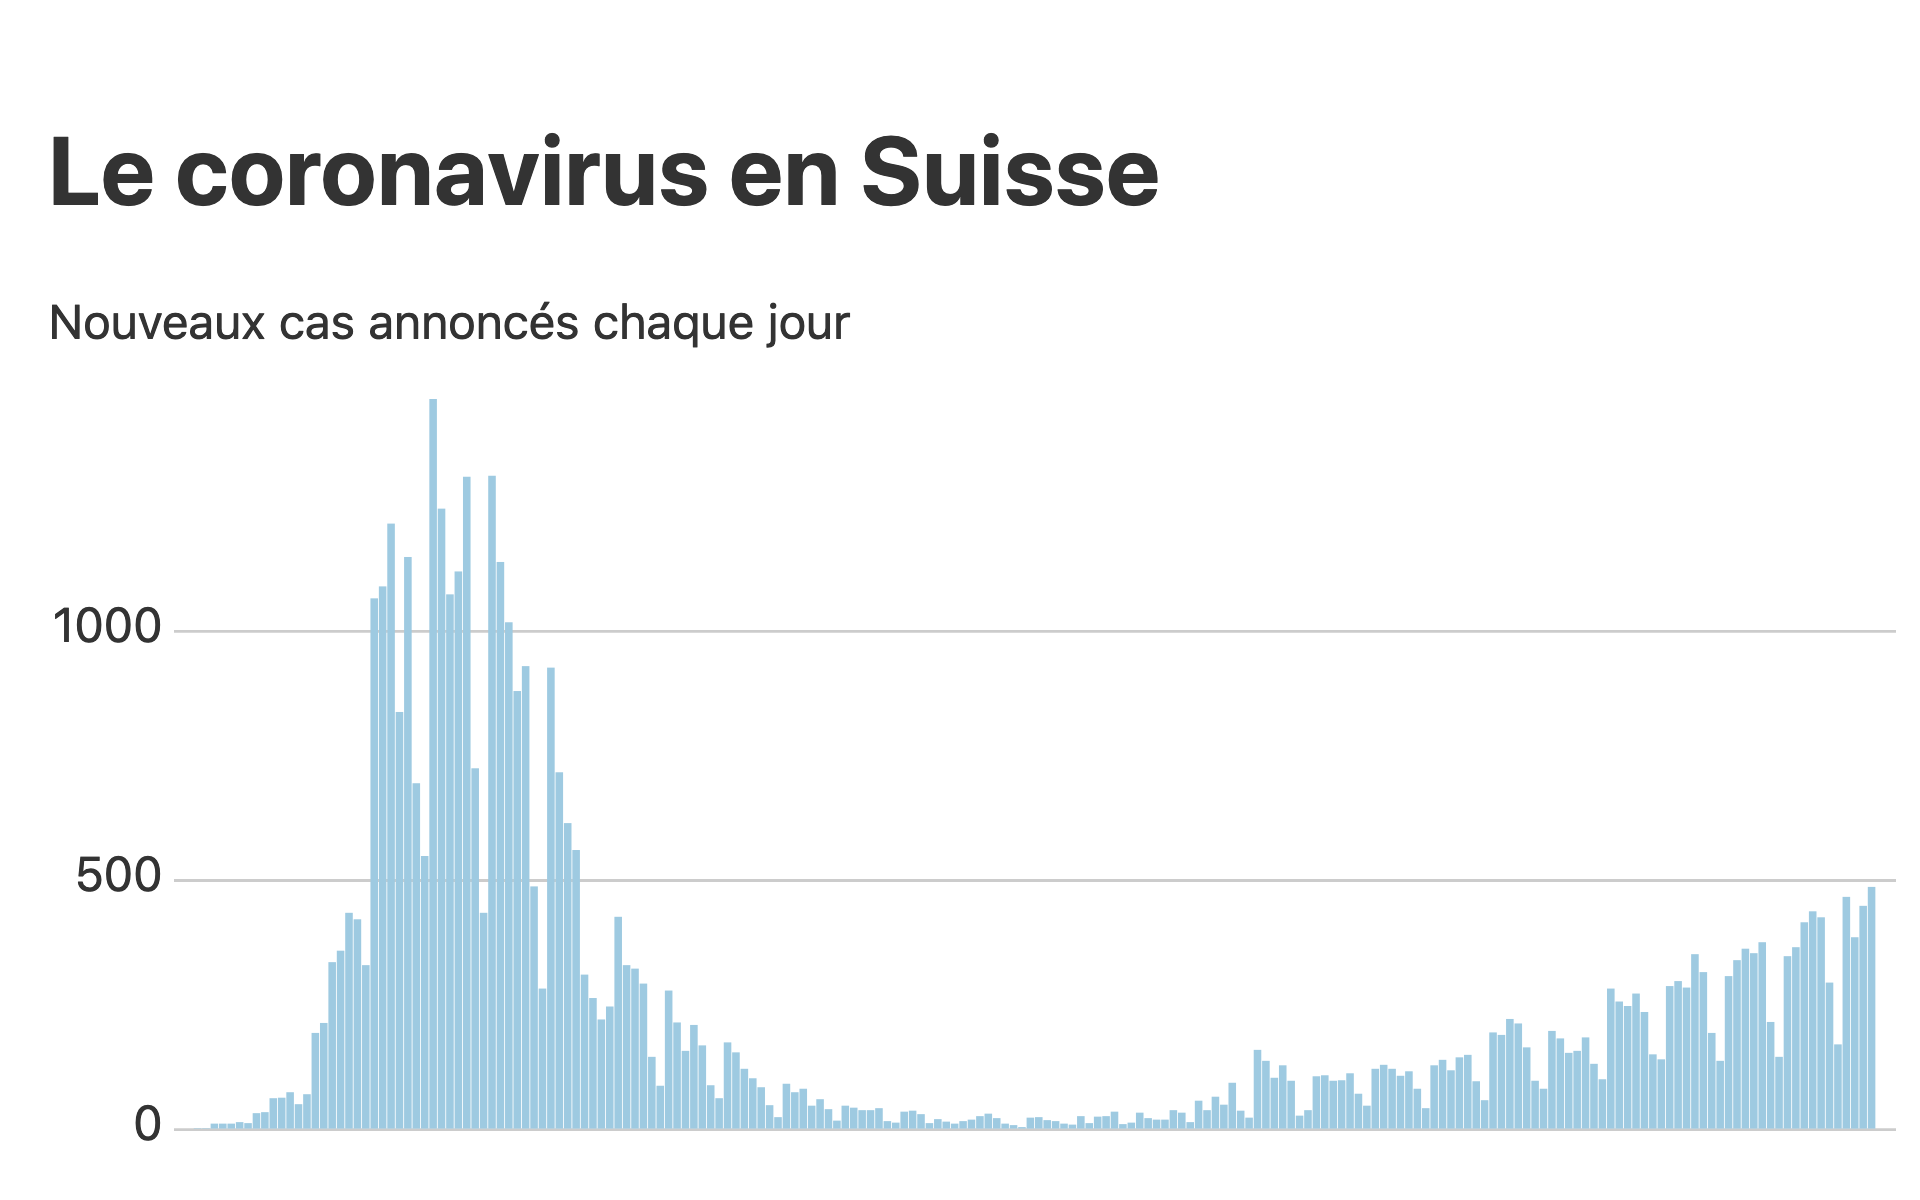
France
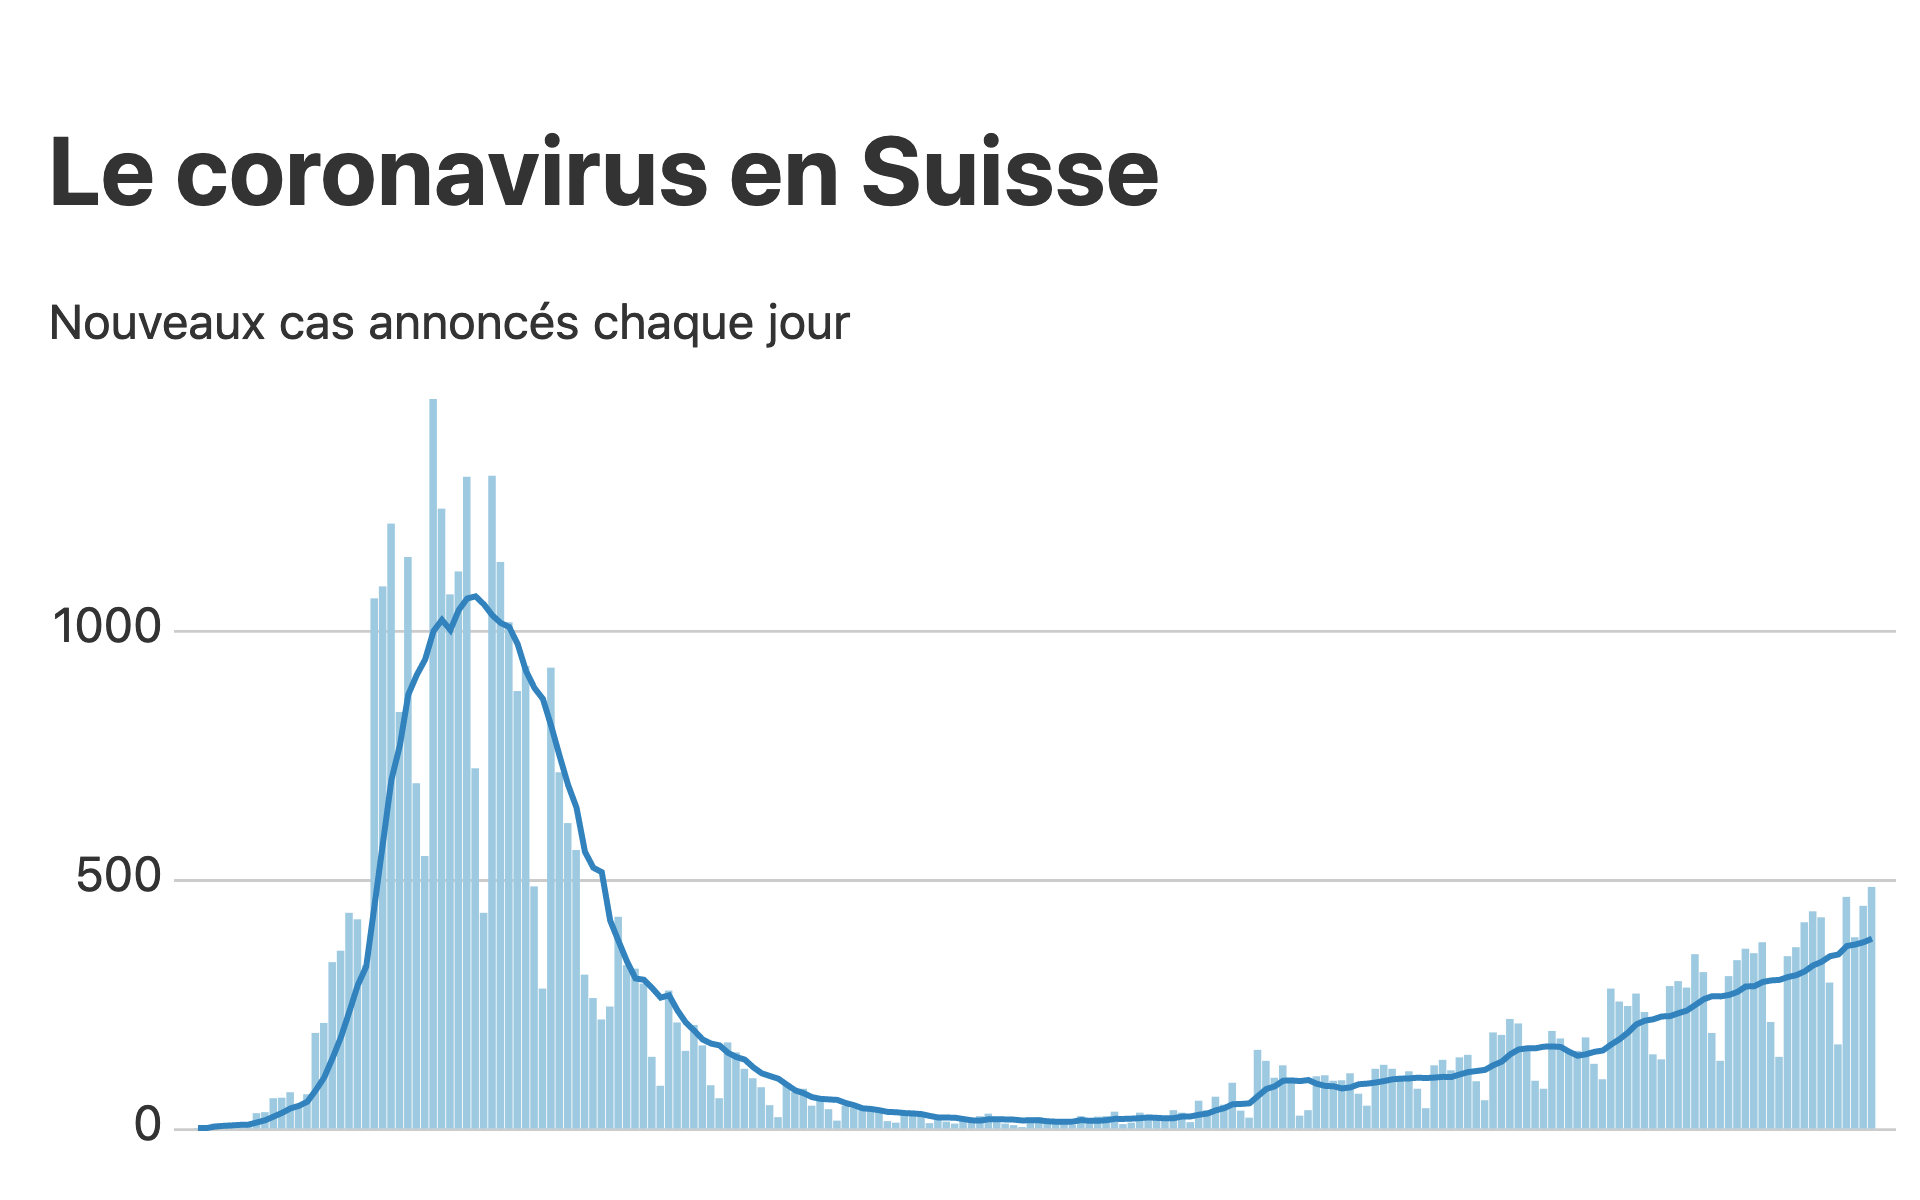
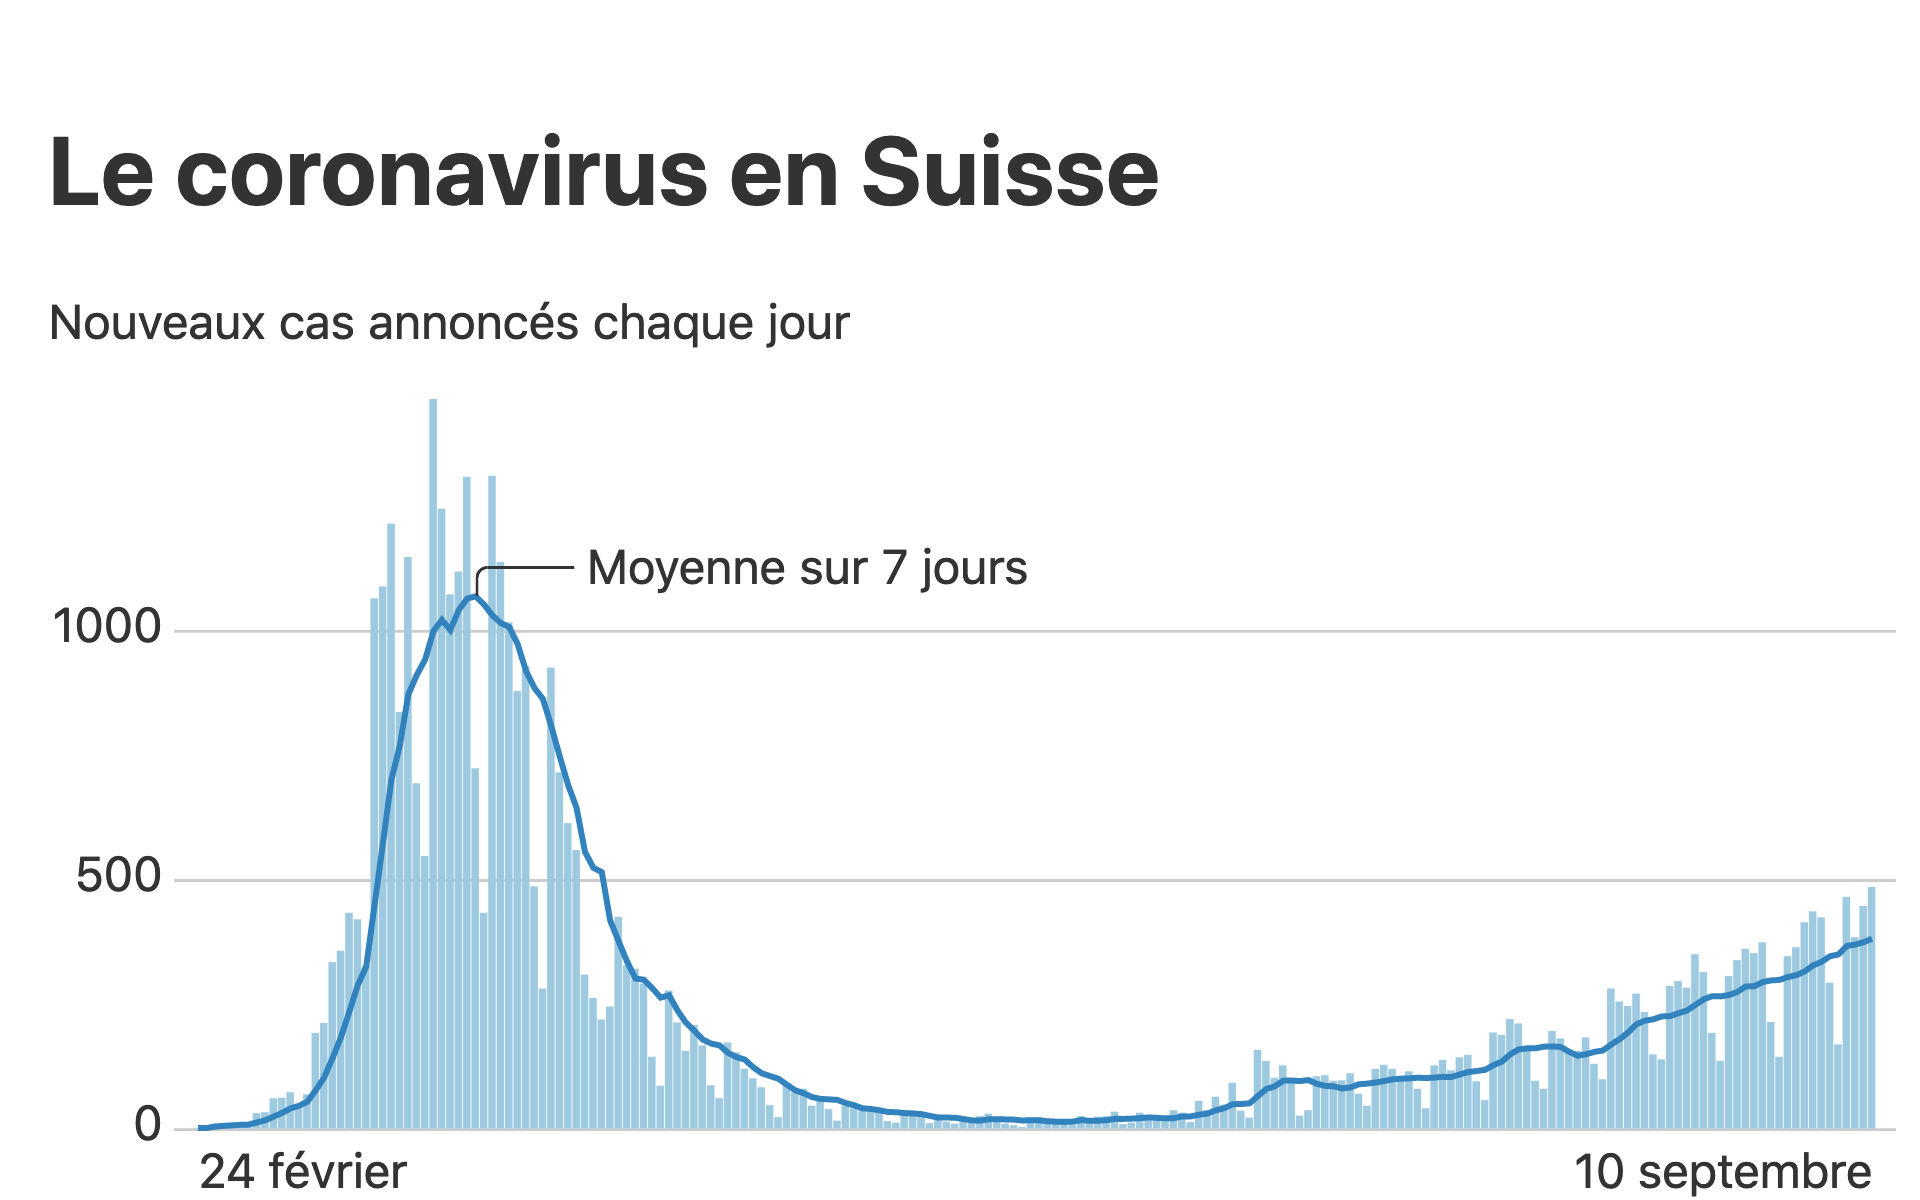
Comment créer un tel diagramme ?

Comment créer un tel diagramme ?
Manière «traditionnelle»
- Déterminer la largeur à disposition
- Rendu du diagramme avec D3, Vega, etc
- Si la largeur change
- Déterminer la nouvelle largeur
- Refaire le rendu côté client ou envoyer une requête au serveur pour demander une nouvelle taille de rendu
Nouvelle idée
<svg viewBox="0 0 100 100" preserveAspectRatio="none">

<style>
  svg * {
    vector-effect: non-scaling-stroke;
  }
</style>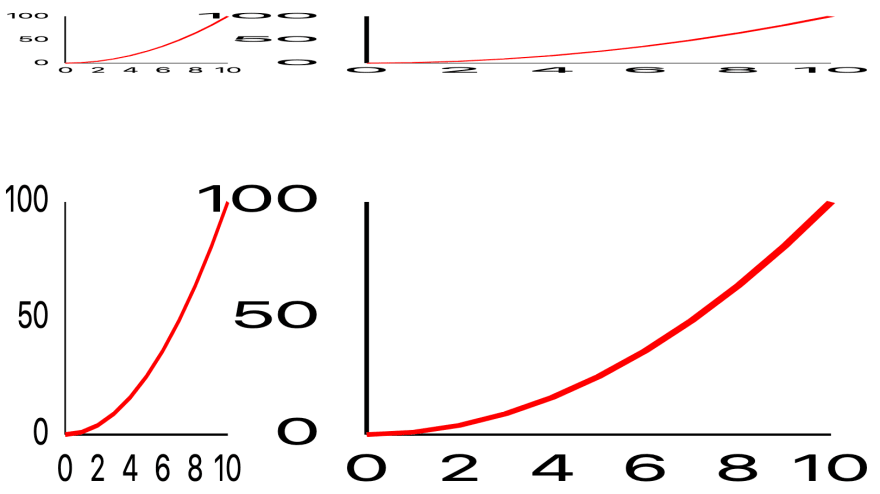
- SVG qui s'adapte à n'importe quelle taille
- HTML par dessus pour du le rendu de texte
Manière «pancake»
Déterminer la largeur à disposition- Rendu du diagramme avec
D3, Vega@sveltejs/pancake -
Si la largeur changeDéterminer la nouvelle largeurRefaire le rendu côté client ou envoyer une requête au serveur pour demander une nouvelle taille de rendu
pancake
bibliothèque experimentelle créé par Rich Harris
=> Pas besoin de JavaScript côté client !
Version simplifiée pour ce talk
Données
[
  {
    "date": "2020-04-01",
    "n_cases": 1016
  },
  {
    "date": "2020-04-02",
    "n_cases": 878
  },
  {
    "date": "2020-04-03",
    "n_cases": 928
  }
]
Définir x/y
const data = rows.map((row, i) => {
  return {
    x: i,
    y: row.n_cases
  };
});
Trouver min/max pour le système de coordonnées
const x1 = 0;
const x2 = data.length - 1;
const y1 = 0;
const y2 = Math.max(...data.map(row => row.y));
<Pancake.Chart {x1} {x2} {y1} {y2}>
<!-- éléments du diagramme -->
</Pancake.Chart>Rendu des axes
<Pancake.Chart {x1} {x2} {y1} {y2}>
  <!-- ... -->
  <Pancake.Grid horizontal count={3} let:value>
    <div class="grid-line" />
    <span class="y label">{value}</span>
  </Pancake.Grid>
  <!-- ... -->
</Pancake.Chart>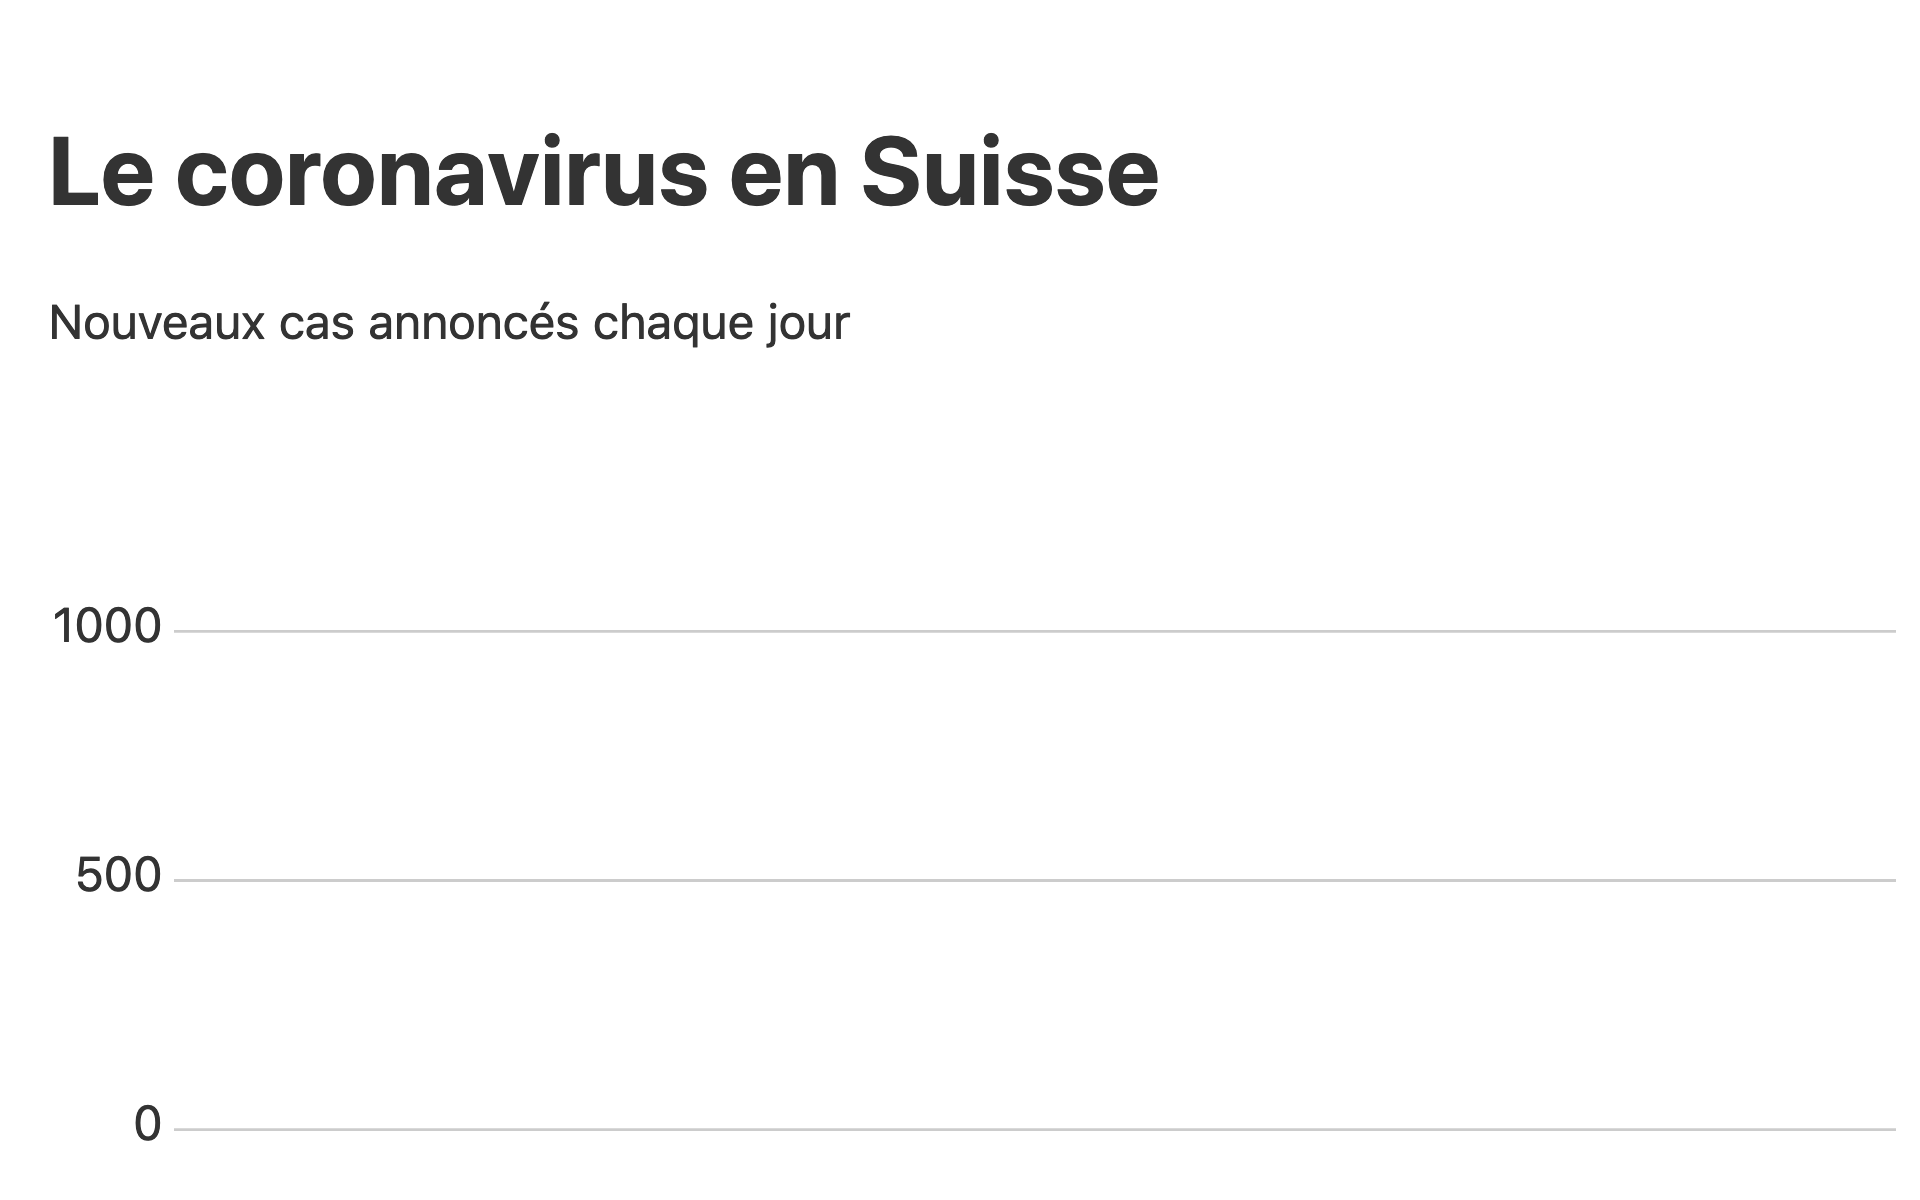
Rendu des colonnes
<Pancake.Chart {x1} {x2} {y1} {y2}>
  <!-- ... --->
  <Pancake.Svg>
    {#each data as { x, y }}
      <Pancake.SvgRect
        x1={x - 0.5} x2={x + 0.5} y1={0} y2={y}
        let:x let:y let:width let:height>
        <rect class="cases-day"
          {x} {y}
          width={width * 0.9}
          {height} />
      </Pancake.SvgRect>
    {/each}
  </Pancake.Svg>
  <!-- ... --->
</Pancake.Chart>
Rendu des colonnes
Rendu de la ligne (moyenne)
<Pancake.Chart {x1} {x2} {y1} {y2}>
  <!-- ... --->
  <Pancake.Svg>
    <Pancake.SvgLine {data} y={d => d.average} let:d>
      <path class="cases-week-average" {d} />
    </Pancake.SvgLine>
  </Pancake.Svg>
  <!-- ... --->
</Pancake.Chart>
<path fill="none" stroke="red"
d="M 10,30
A 20,20 0,0,1 50,30
A 20,20 0,0,1 90,30
Q 90,60 50,90
Q 10,60 10,30 z" />Rappel: L'attribut d de path prend des commandes de dessin
Rendu de la ligne (moyenne)