PROJECT CARDIOWAVE
CS460: COMPUTER GRAPHICS
TEAM 23
ROHINI DESHMUKH
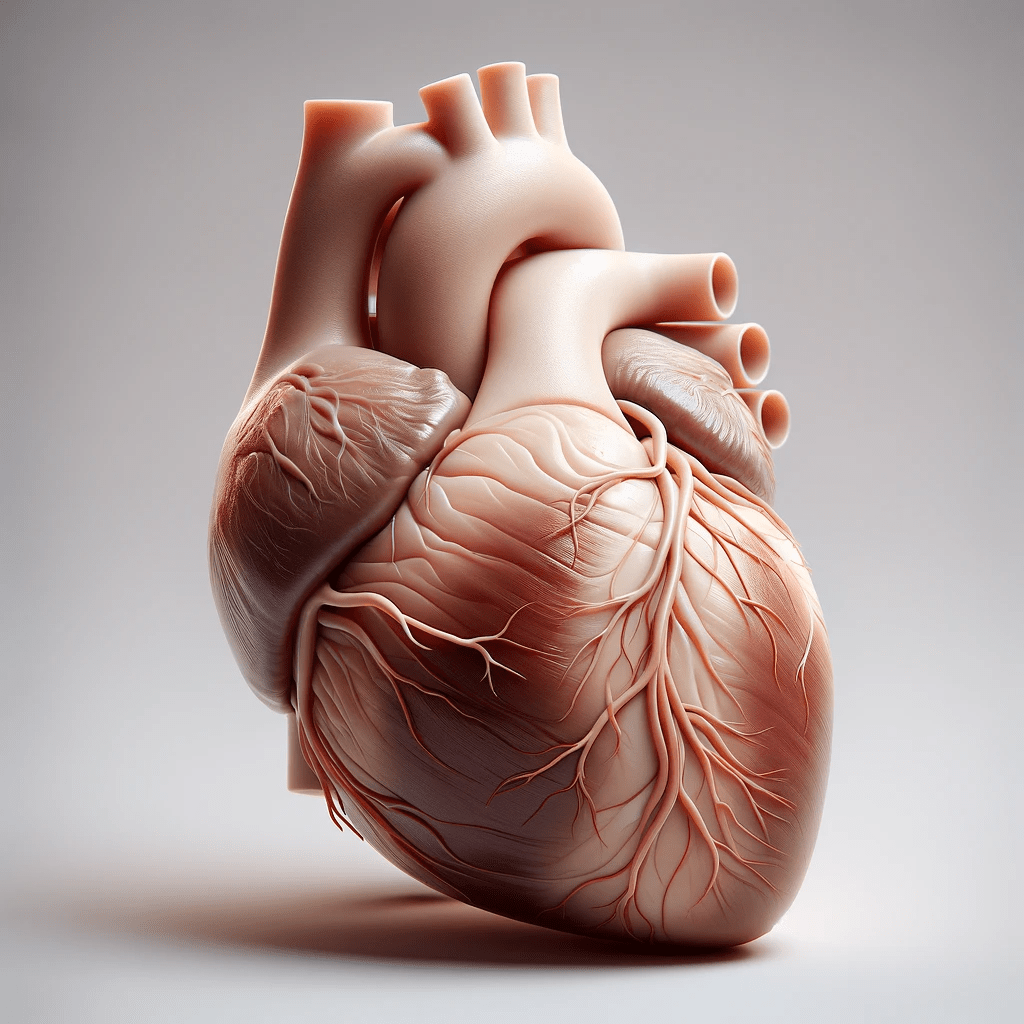
The aim of this project is to develop an interactive web-based 3D heart model that will visualize the pumping action of the atriums and ventricles in synchronization with ECG data.
Aim:
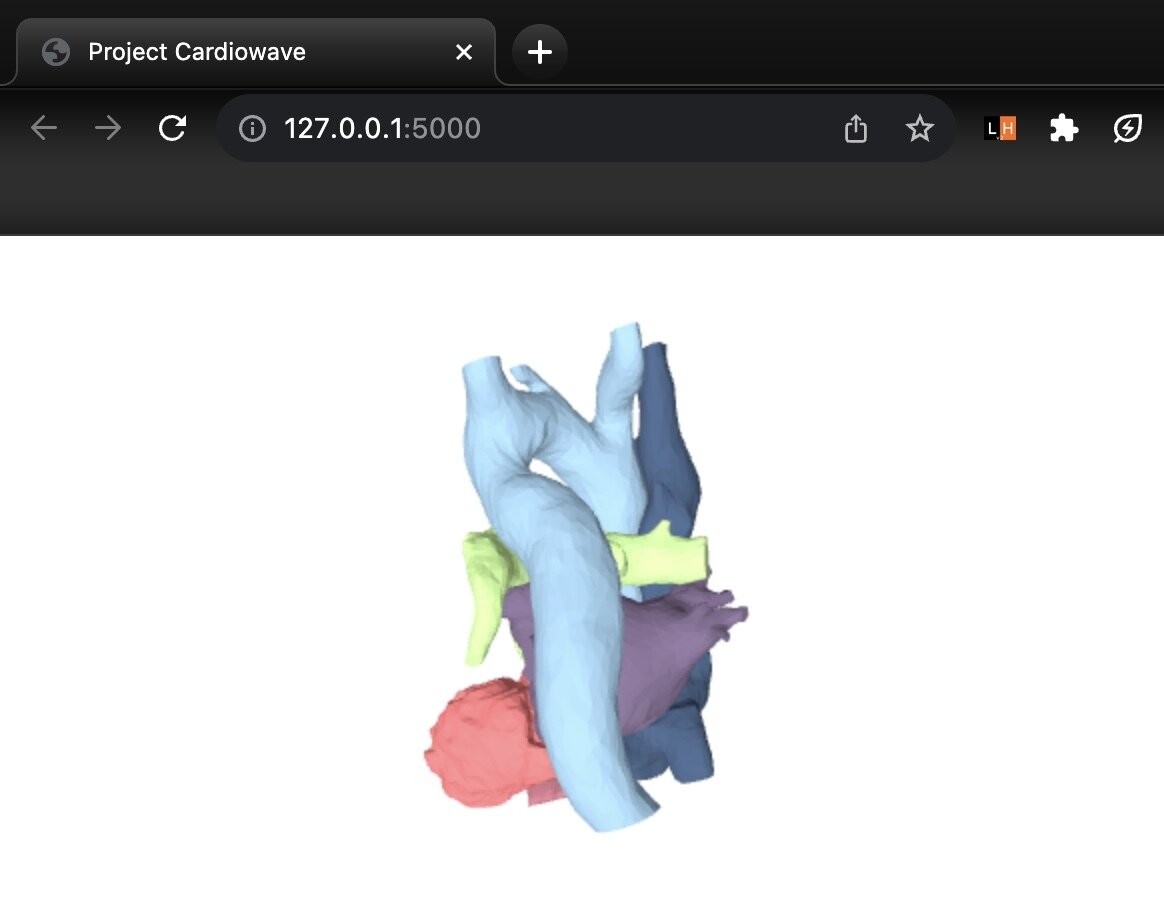
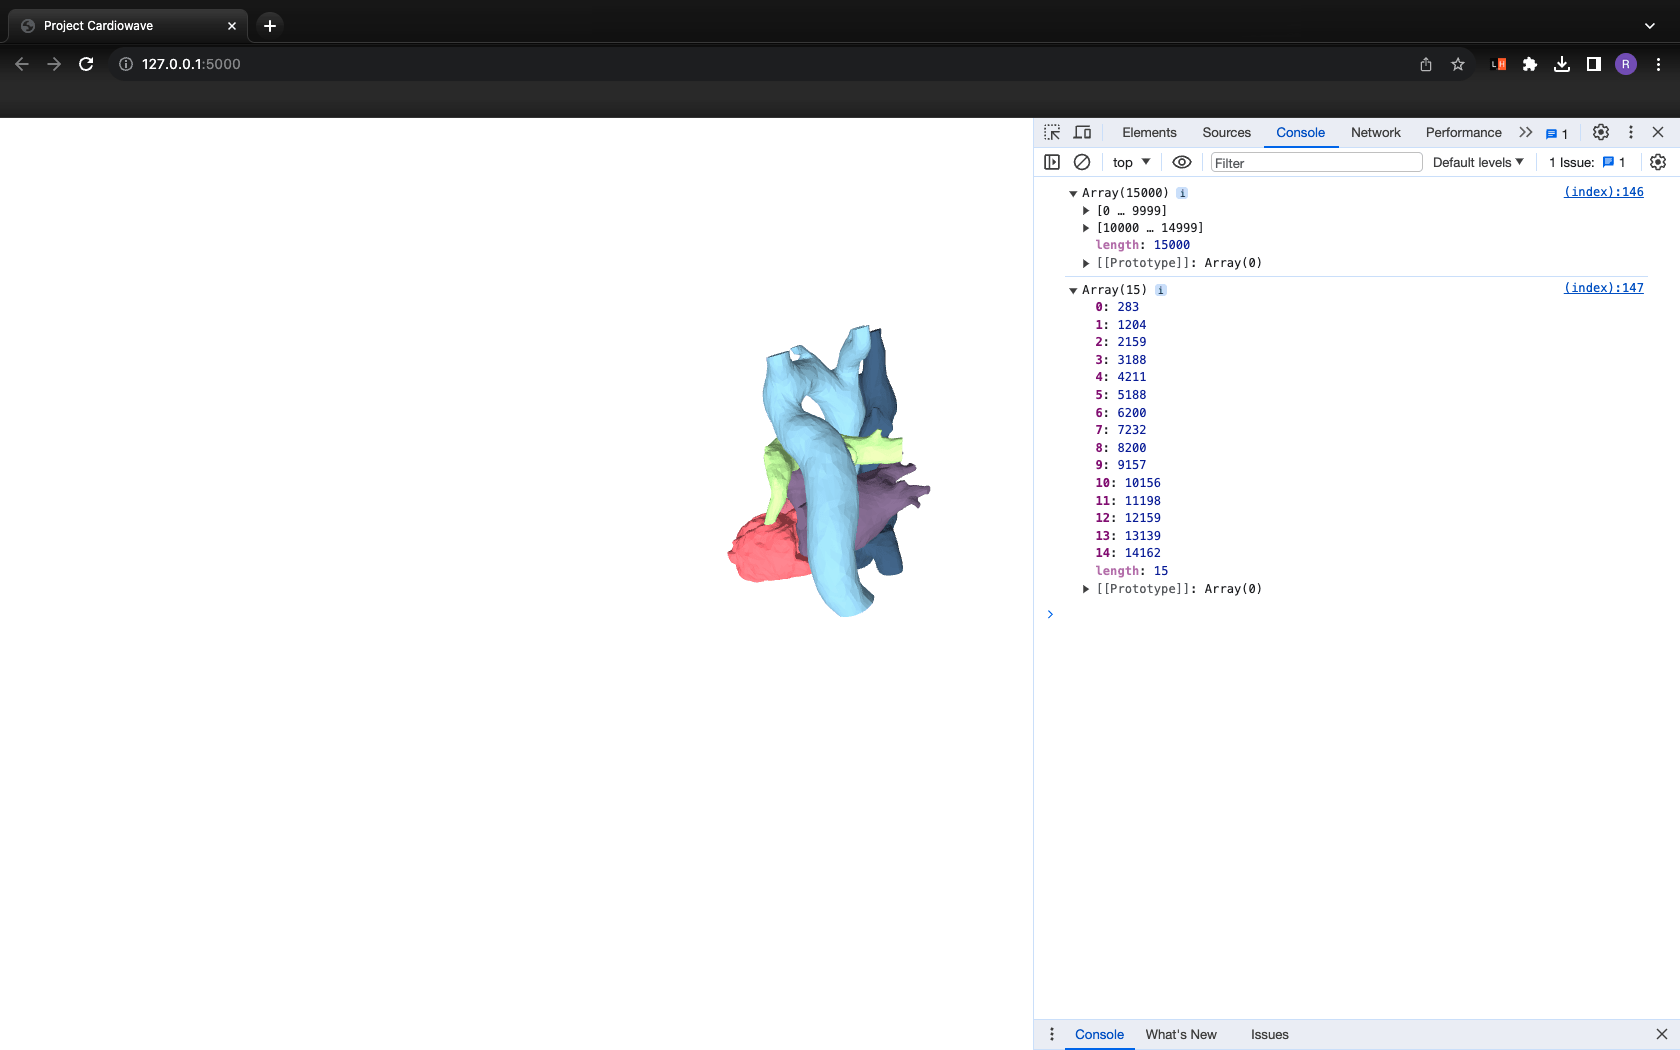
Step 1: Render 3D model on web
Downloaded the mesh from web
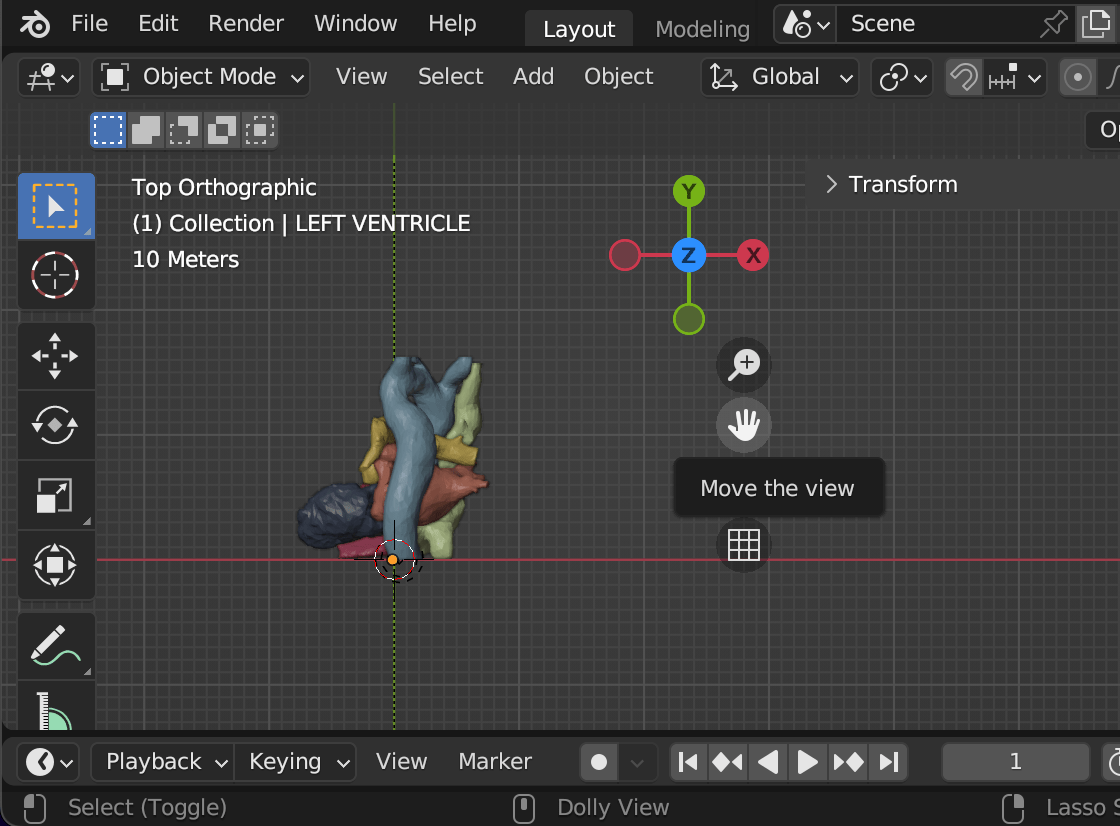
Edited using Blender
//display the 6 meshes atrium
      var loader = new GLTFLoader();
      loader.load('static/heart.glb', function (gltf) {

        const objectsInfo = [
          { name: 'RIGHT_ATRIUM', color: 0x355070 },
          { name: 'LEFT_ATRIUM', color: 0x6D597A },
          { name: 'RIGHT_VENTRICLE', color: 0xB56576 },
          { name: 'LEFT_VENTRICLE', color: 0xE56B6F },
          { name: 'AORTA', color: 0xEAAC8B },
          { name: 'PULMONARY_ARTERY', color: 0xB5E48C },
        ];

        for (const objInfo of objectsInfo) {
          const object = gltf.scene.getObjectByName(objInfo.name);
          object.scale.set(0.5, 0.5, 0.5);
          object.material = new THREE.MeshStandardMaterial({ color: objInfo.color });
          object.visible = true;
          scene.add(object);
        }


      });
Loaded the gltf file using Three.js
3D model on web
Step 2: Study related to Heart and ECG

6 primary meshes of the heart model
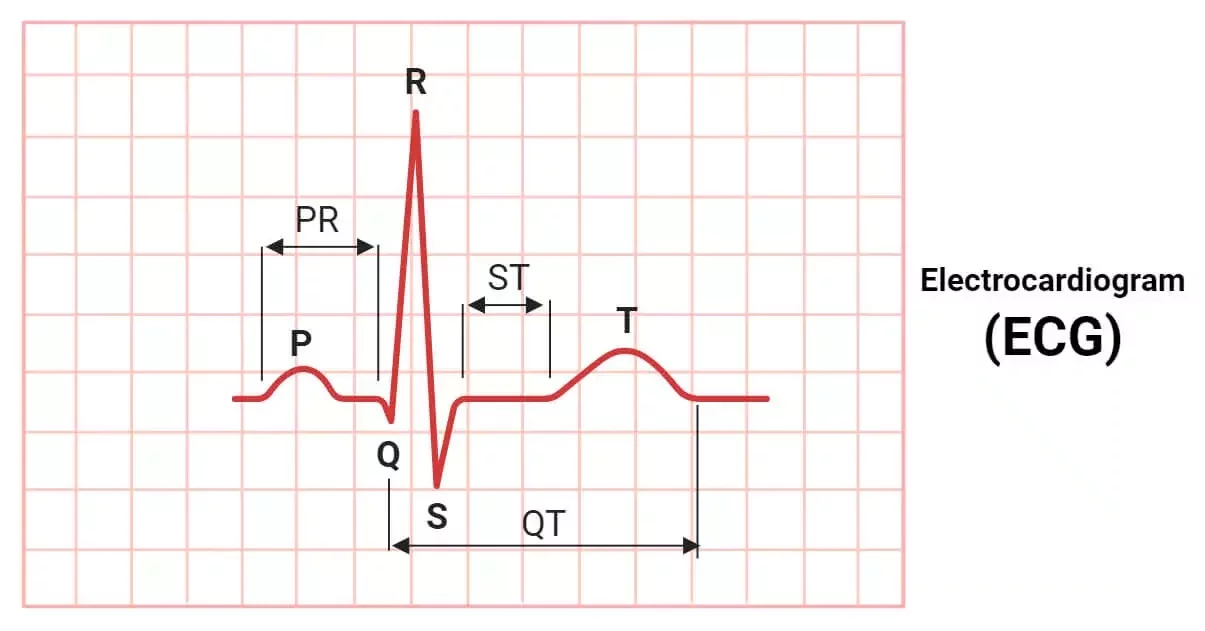
ECG signal
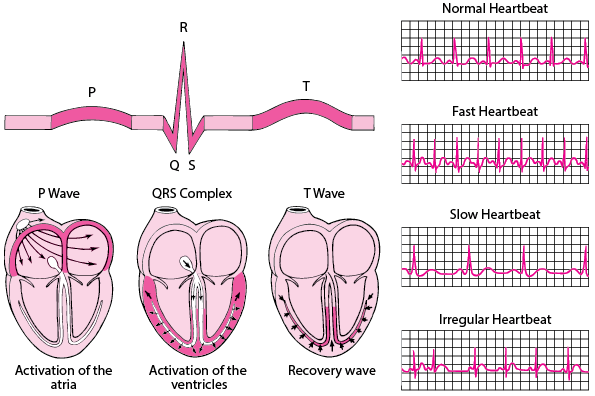
Activation of atria and ventricles depending upon the ECG signal
Step 3: Medical libraries used for data processing using python

import numpy as np
from biosppy.signals import ecg

# load raw ECG signal
signal = np.loadtxt('./examples/ecg.txt')

# process it and plot
out = ecg.ecg(signal=signal, sampling_rate=1000., show=True)
import neurokit2 as nk
# Download example data
data = nk.data("bio_eventrelated_100hz")
# Preprocess the data (filter, find peaks, etc.)
processed_data, info = nk.bio_process(ecg=data["ECG"], sampling_rate=100)
# Compute relevant features
results = nk.bio_analyze(processed_data, sampling_rate=100)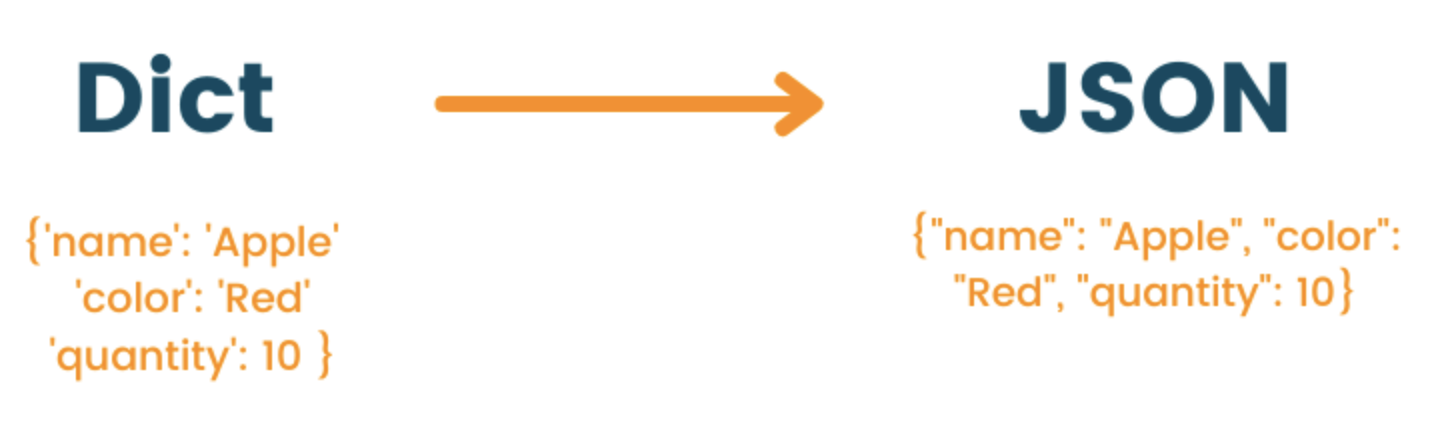
Step 4: Python Dict to JSON format
'jsonify()'
# Download the ECG data file
url = "https://cs666.org/data/ecg.txt"
r = requests.get(url, allow_redirects=True)
open("ecg.txt", "wb").write(r.content)  # Save the content in binary mode


# Load the dataset using biosppy library
from biosppy.signals import ecg
signal = np.loadtxt('ecg.txt')
out = ecg.ecg(signal=signal, sampling_rate=1000., show=False)


#jsonify
@app.route('/ecg_data')
def ecg_data_route():
    ecg_data = {
        "signal": out['filtered'].tolist(),  # Filtered ECG signal
        "rpeaks": out['rpeaks'].tolist(),   # R-peak

    }
    return jsonify(ecg_data)
Output
Step 5: Work in progress
- Parsing data using Neurokit for p, q, s, t wave
- Synchronizing heart frequency with the ECG data
Thank you!

PROJECT CARDIOWAVE
Interactive web-based 3D heart model that will visualize the pumping action of the atriums and ventricles in synchronization with ECG data.