Monitoring & Logging
Research Results
What
- Detect machines disappearing
- Detect containers disappearing
- Detect infrastructure resources disappearing
- Detect all of the above becoming unhealthy
- A record of what is "normal"
- Investigate cause of failures
- Correlate log messages
Why
- Moving away from monolithic solutions to ones comprised of cooperating services greatly increases operational complexity
- Having customers know when our systems are down before we do is unacceptable, negatively impacting our reputation
- A solution is only as fast as its least performing component
- Pro active response to stressed servers is more efficient than midnight fire fighting
- An Operations Database can help with sizing questions for both us and customers who want to self-host
How
- Use monitoring as a service (MaaS) providers to quickly get us running
- Use MaaS to monitor the boxes, including Docker daemons
- Use MaaS to monitor shared infrastructure, RabbitMQ, MySQL, MongoDB, etc.
- Use MaaS to monitor microservice health
- Use logging as a service (LaaS)to aggregate logs
The Simulation
- Virtual machine to run the Docker daemon
- Docker containers for all microservices and infrastructure
- Client that continually stimulates the cooperating set of services
- Enable/disable services and infrastructure to simulate network partitions and dead hardware
- Use specially crafted messages from the client to introduce latency into the system and simulate ailing components
- See how quickly failures are detected
- See how quickly the system failure can be isolated
Simulated System
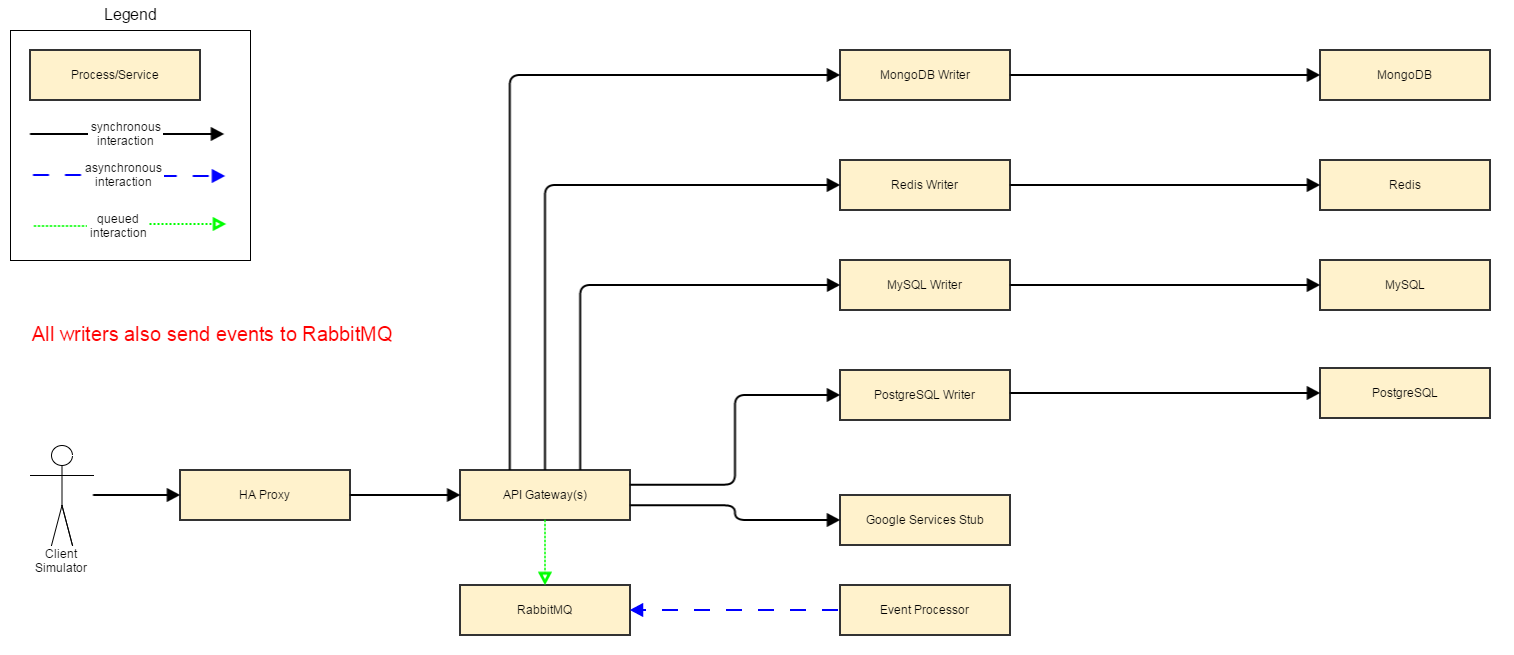
Simulation Environment
- Amazon EC2 based
- All components available on GitHub
- All components Docker 1.8.2 based
- All provisioning is automated via Ansible, Docker Compose and Terraform
- t2.large instance
- 2 CPUs
- 8GB RAM
- 8GB disk
- relaxed network rules -- all traffic allowed
- simulate 10 active machines making calls every half-second
How We Tested Monitoring
- Install necessary monitoring software
- Set alerts in console
- Monitor both dashboard and e-mail for alerts
- Pump requests through the system
- Turn individual containers on and off to simulate network partitions and dead hardware
- Note the latency between the actual event and when the alert is registered in the dashboard and in e-mail
- Note how difficult it is to configure the components to be monitor-ready
The Candidates
| Attribute | New Relic | Datadog | Sysdig Cloud |
|---|---|---|---|
| Agent Based | [x] | [x] | |
| Docker Support | [x] | [x] | |
| Free Tier Available | [x] * | [x] ^ | |
| Infrastructure Plug-ins | [x] | [x] | |
| Web Dashboard | [x] | [x] | |
| Mobile Application | [x] | [ ] |
* 24-hour data retention, unlimited hosts
^ 24-hour data retention, 5 hosts
Host Monitoring
| Scenario | New Relic | Datadog |
|---|---|---|
| Dead Instance | [x] | [x] |
| 90% CPU | [x] | [x] |
| 90% Disk Space | [x] | [x] |
| 90% RAM | [N/A ] | [ N/A] |
| 90% Disk I/O | [N/A ] | [ N/A] |
| 90% Network I/O | [N/A] | [N/A] |
N/A: not attempted
New Relic Server

Data Dog Server
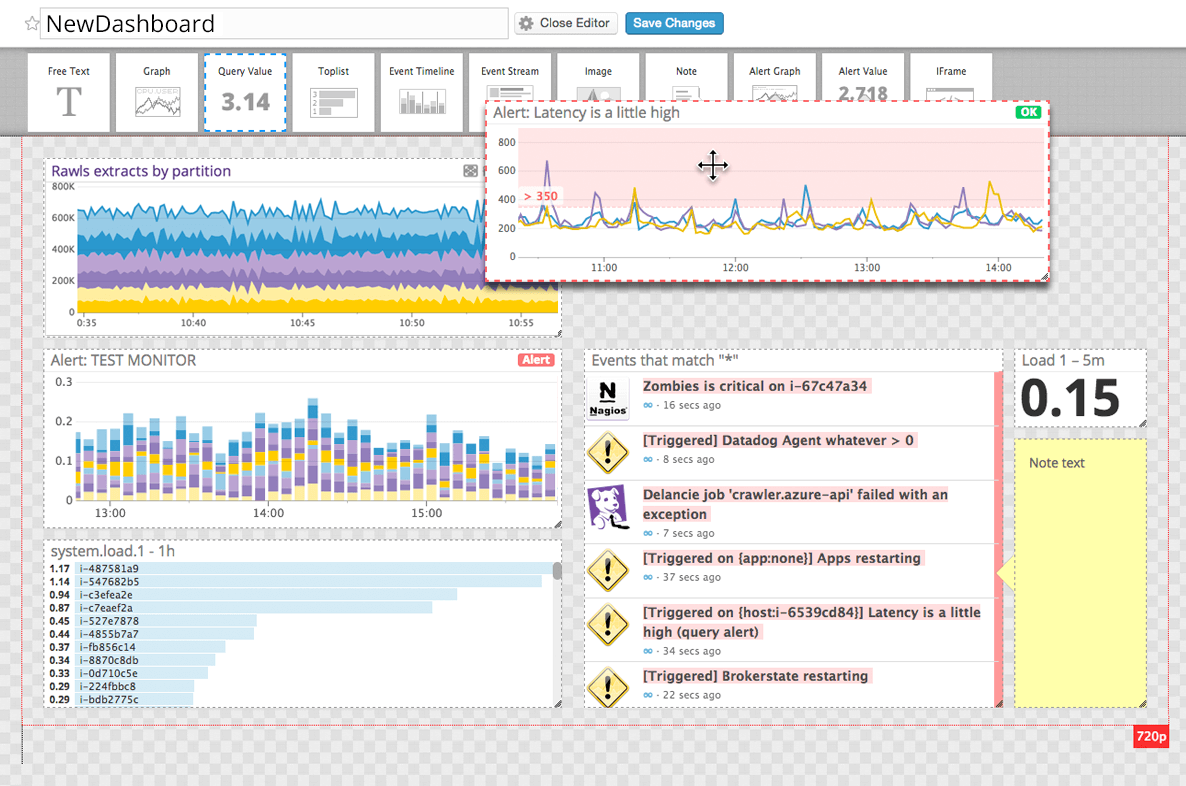
Data Dog Correlation

Container Monitoring
| Scenario | New Relic | Datadog |
|---|---|---|
| CPU Usage | [x] | [x] |
| RAM Usage | [x] | [x] |
| Disk Usage | [ ] | [ ] |
| Network Usage | [ ] | [ ] |
| Container Events | [ ] | [x] |
New Relic Docker
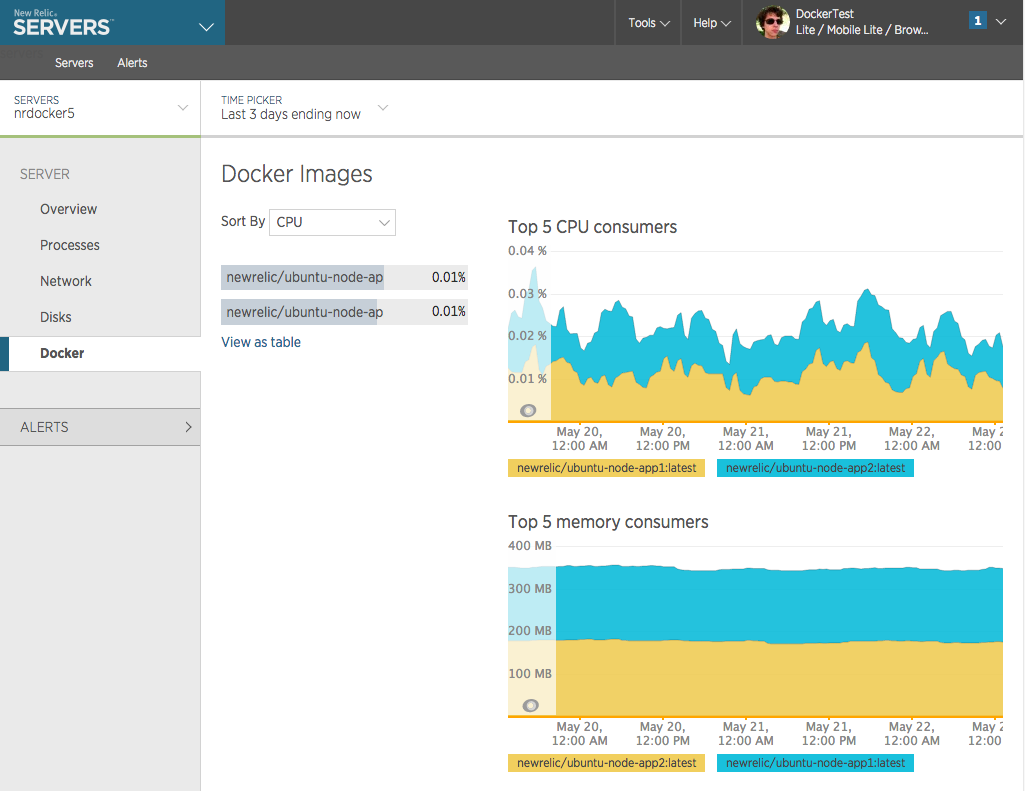
Application Monitoring
| Scenario | New Relic | Datadog |
|---|---|---|
| Available | [x] | [x] |
| Getting Slow | [^] | [*] |
| Too Many Errors | [x] | [*] |
| Record Response Times | [^] | [*] |
* possible but not tested
^ requires premium tier
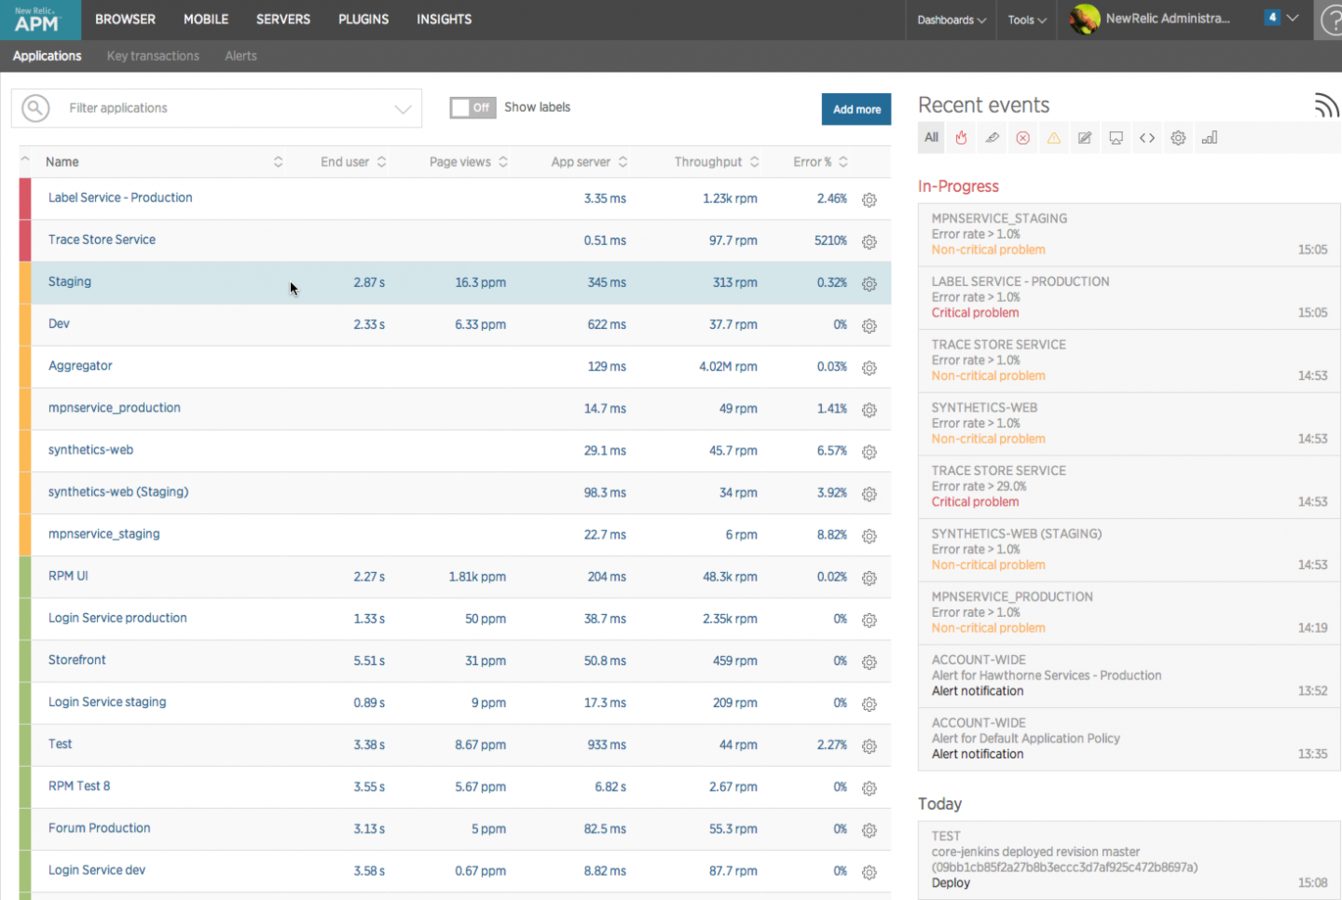
New Relic Application
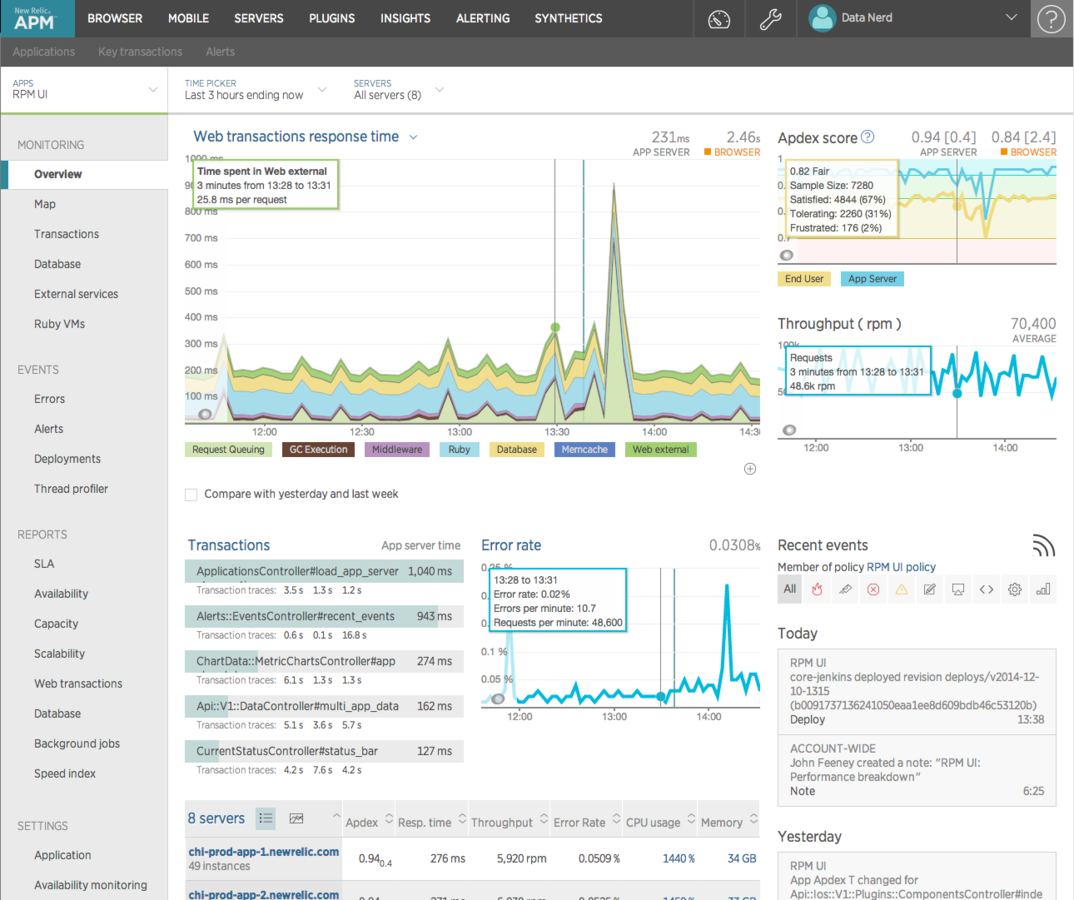
New Relic Application
Infrastructure Monitoring
| Scenario | New Relic | Datadog |
|---|---|---|
| Redis down | [x] | [*] |
| MySQL down | [x] | [*] |
| PostgreSLQ down | [x] | [*] |
| RabbitMQ down | [x] | [x] |
| Queue Growing | [ ] | [x] |
* possible but not tested
- New Relic relies on our health checks
New Relic Notes
- agent is easy to install
- host monitoring is very good
- Docker monitoring is very good
- application monitoring requires extra library *
- plug-ins are craptaculous
- can write our own easy enough
- not possible to alert via plug-in attributes
- alerting options are very good
- Android application helps with mobile monitorinng
- set up is manually done at the dashboard
* only tested JVM applications
Datadog Notes
- agent is easy to install
- host monitoring is very good
- Docker monitoring is excellent
- application monitoring requires extra library *
- plug-ins are excellent
- can alert on infrastructure attributes, like queue length
- alerting options are very good
- availability checks are done from the agent ^
- set up can be automated via REST API (not verified)
* only tested JVM applications
^ New Relic checks from their data center
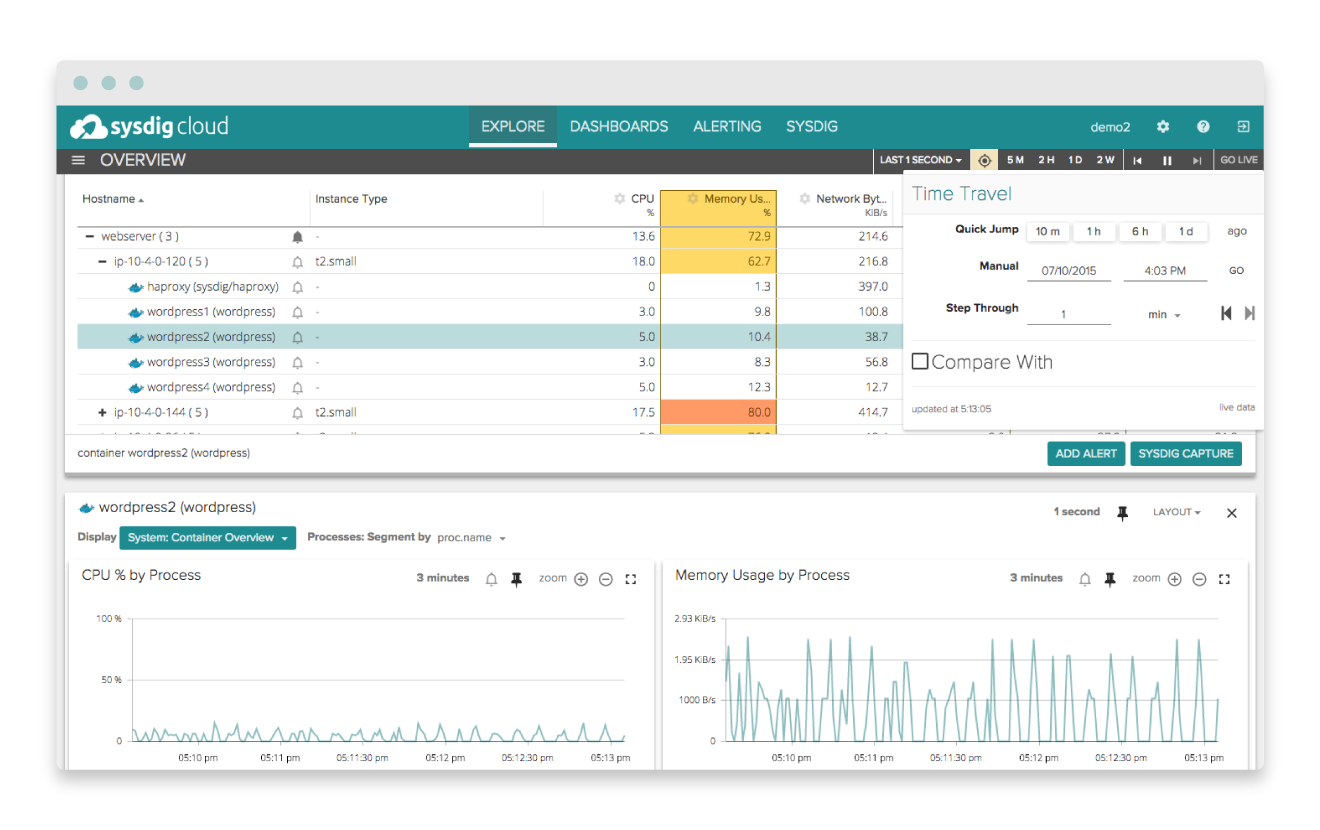
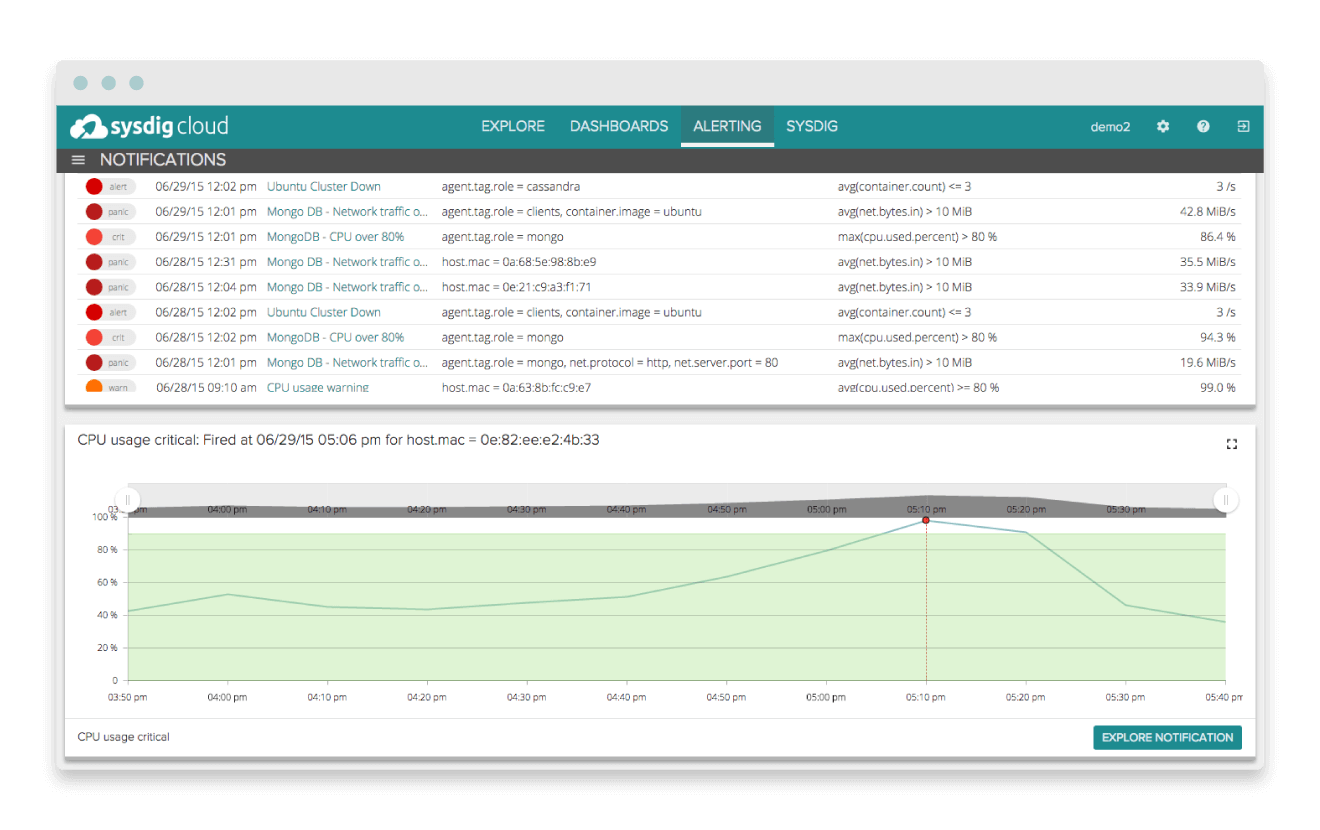
Sysdig Notes
- two forms: open source CLI tool and cloud monitoring
- tracks relationships between components
- appears to have deep insight into containers
- appears to integrate with our technology stack
- pricing is $20 per host per month
- probably worth digging into at some point
Sysdig Historical
Sysdig Alerting
Monitoring Conclusion
- if all you want is 'are you alive?', then either solution works
- if you want to alert on infrastructure attributes, then Datadog is the choice
- Datadog is $15/host, New Relic is $150/host (monthly)
- New Relic has more features but is more expensive
- Both systems feed into other systems, like Pager Duty and Hip Chat so a hybrid solution is possible
- Generating an Operations Database is a higher end feature and was not investigated
- Datadog probably makes sense to focus on right now
How We Tested Logging
- applications were configured to write to stdout and stderror
- message format modified to spit out JSON
- Docker was instructed to forward console streams to the LaaS provider
- messages were examined to see if they could be used to help troubleshoot down or dying servers
- rudimentary searching capabilities were tested
- message correlation searches
The Candidates
| Attribute | Loggly | Found | ELK |
|---|---|---|---|
| Message Format | syslog | multiple | multiple |
| Free Tier | [x] | [ ] | [x] |
| Alerting | [*] | [^] | [^] |
| Automatic Parsing | [*] | [#] | [x] |
| Integrations | [*] | [#] | [#] |
* available but not tested
^ coming soon
# hand configured
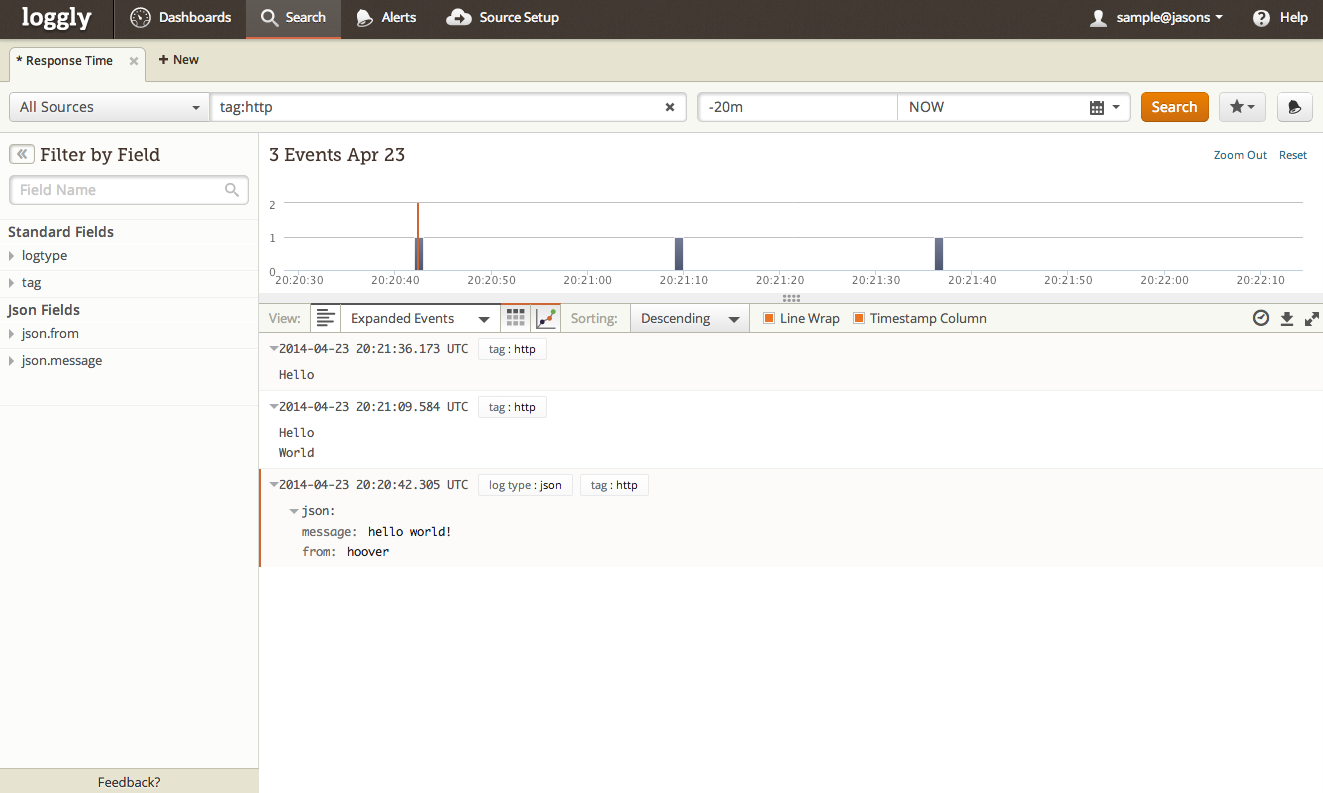
Loggly
- containers configured to use syslog driver
- rsyslog configured updated via automation
- messages began flowing almost immediately
- both application and infrastructure messages sent
- consumes JSON format extremely well
- plenty of power available but requires investment to learn the system
- logs on disk need to be accounted for on a case-by-case basis
- logging via HTTP also supported
- emission of JSON messages is highly recommended
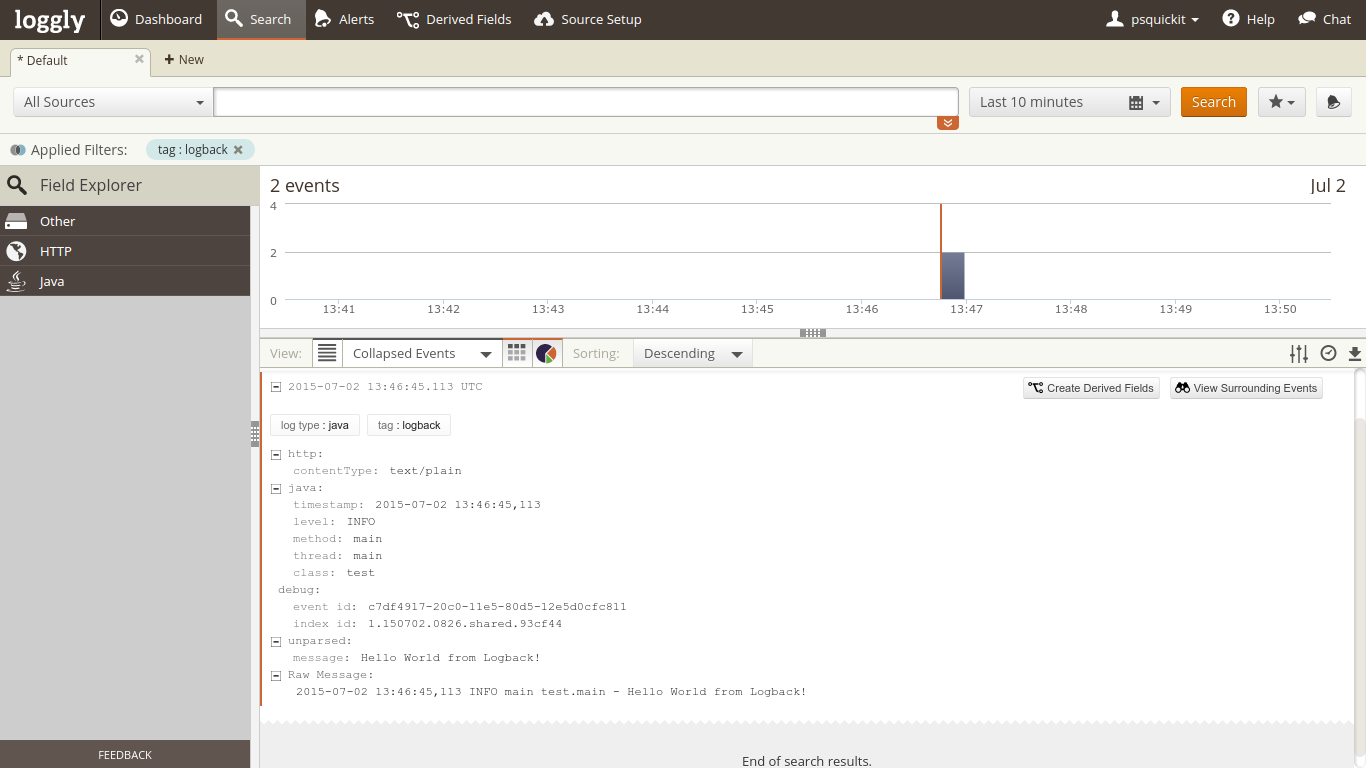
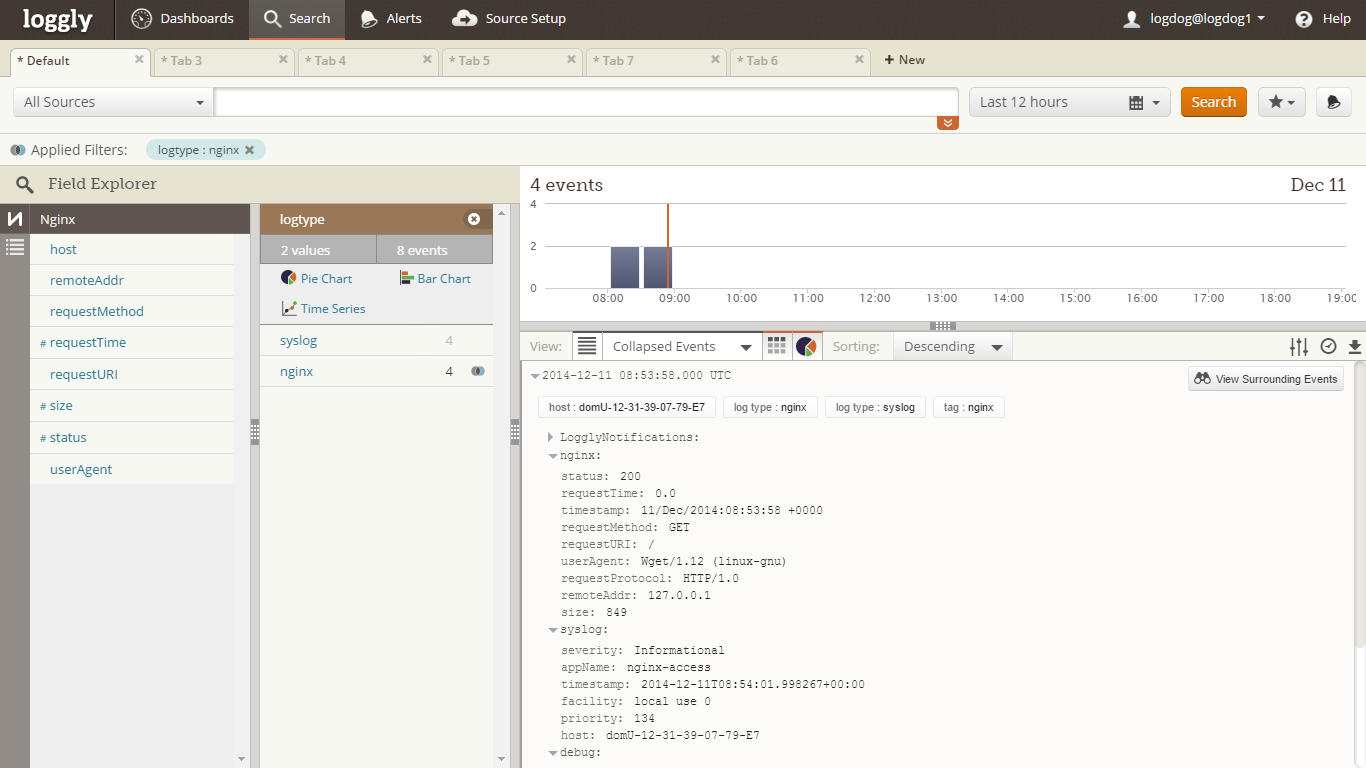
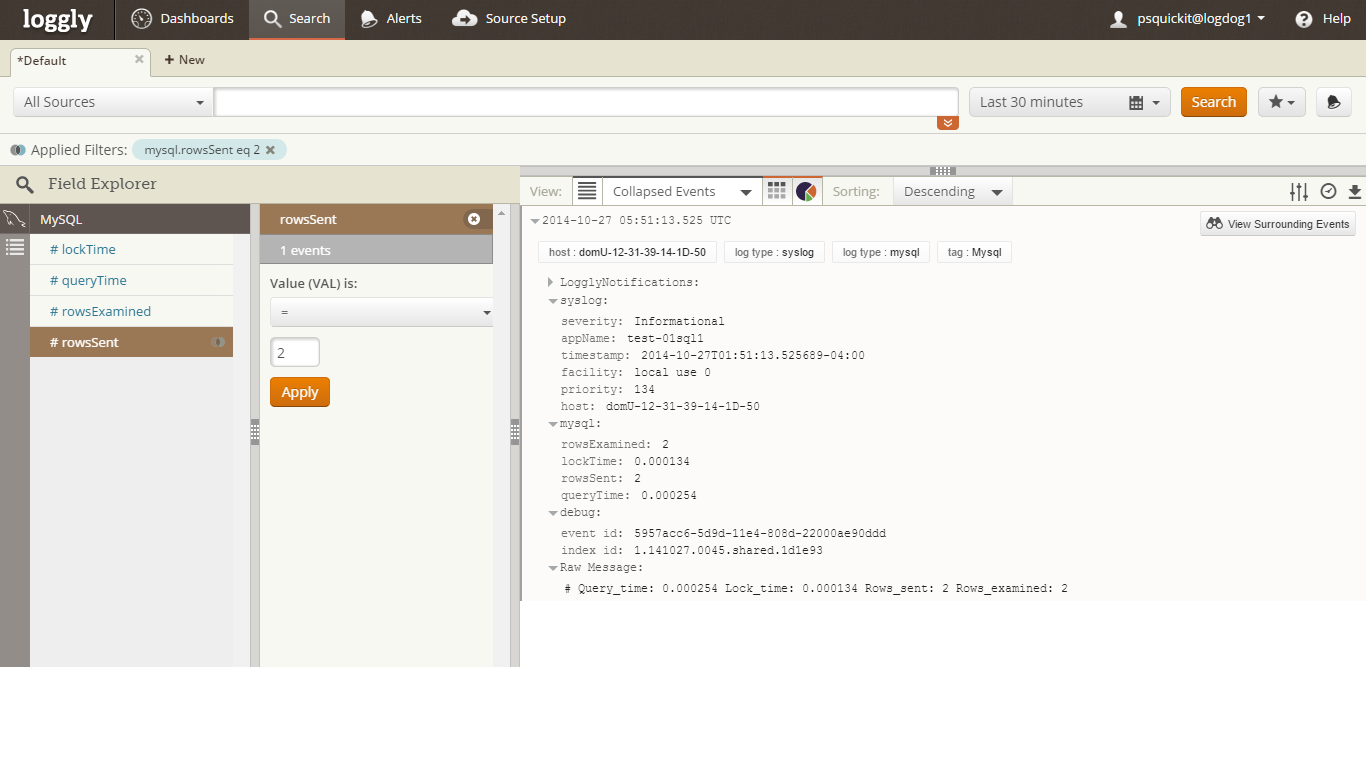
Loggly Console
Loggly Console
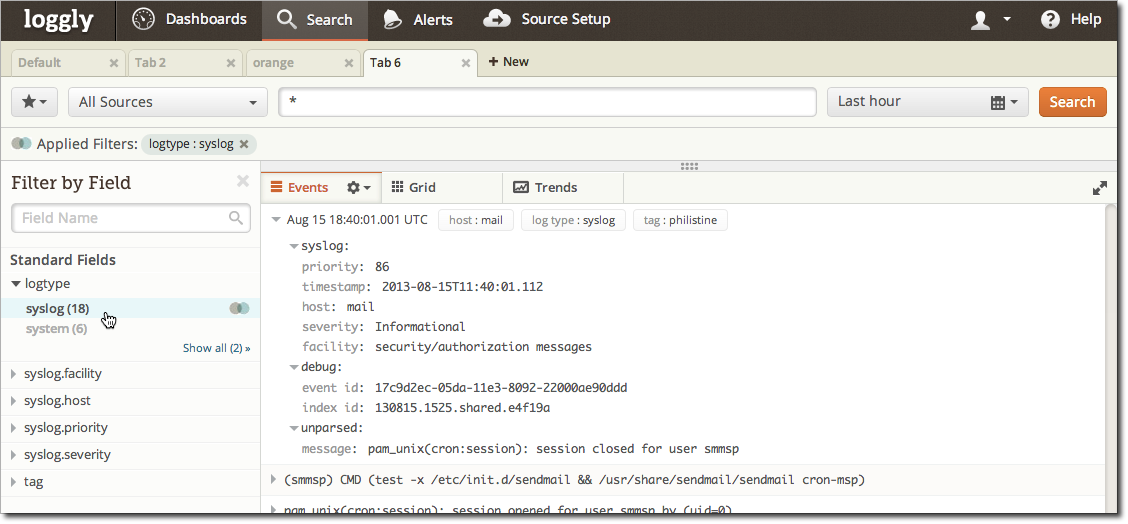
Loggly Console (Java)
Loggly Console (Nginx)
Loggly Console (MySQL)
Loggly Correlation
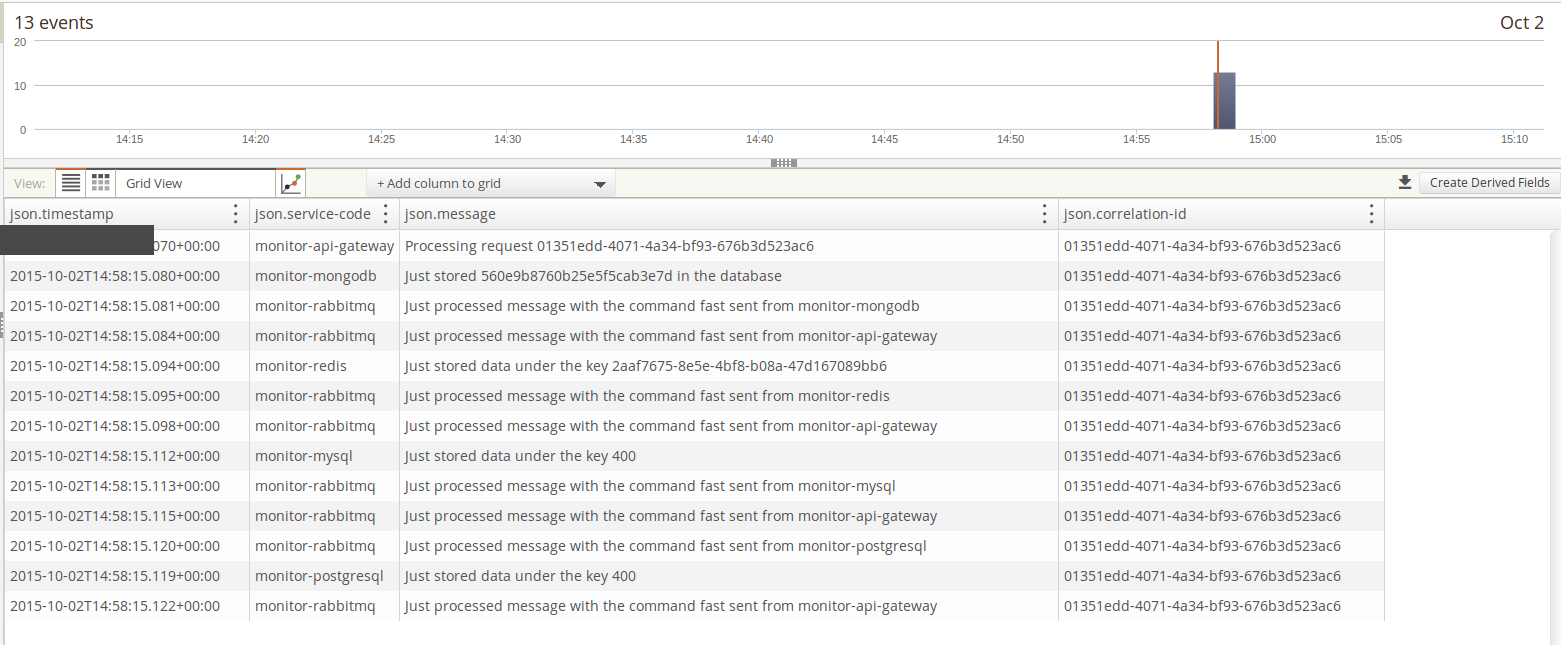
Found
- 14 day trial
- documentation poor
- probably assumes expertise with Logstash
- focus on availability (AWS-based ?)
ELK
- components are deployed via containers
- requires investment to build out infrastructure
- requires expertise with Logstash
- multi-format handling is powerful
- probably requires standardizing on message formats to ease configuration
- Docker helps to normalize logging but services that log to disk need to be addressed individually
- might provide a growth path to Found, if needed
{
  "timestamp": "2015-10-02T15:02:12.455+00:00",
  "message": "Just processed message with the command fast sent from monitor-api-gateway",
  "component": "org.kurron.example.rest.inbound.MessageProcessor",
  "level": "WARN",
  "service-code": "monitor-rabbitmq",
  "realm": "Nashua Endurance Lab",
  "service-instance": "1",
  "message-code": "2008",
  "correlation-id": "54356aa8-ea9a-4dc8-946c-73b3b26b33f6",
  "tags": [
    "QA"
  ]
}
Normalized Message Format (JSON)
{
  "log": "2015-09-30 19:36:45 16 [Note] InnoDB: The InnoDB memory heap is disabled\n",
  "stream": "stderr",
  "time": "2015-09-30T19:36:45.033111964Z"
}
Docker JSON Log Format
{
    "timestamp": "2013-10-11T22:14:15.003123Z",
    "travel": {
        "airplane": "jumbo",
        "mileage": 2034
    }
}
Loggly JSON Log Format
Logging Conclusion
- all solutions require investment in configuration
- normalizing on application message formats required to reduce the configuration burden
- use of side-car containers can keep logging concerns out of the application/service container
- all solutions have decent web consoles
- Loggly ranges between $45 and $350 a month
- Found ranges based on configuration, $85 a month appears to be the minimum
- ELK is free but requires investment in personnel and resources
- Loggly looks promising so we should focus our attention here and trial it on a project or two