Customer Service


18+ years of


A Brief History
Call Volume History
In 2013 we answered 41,901 emails, calls, and chats*
In 2014 we answered 59,337 emails, calls, and chats - an increase of 17,436 inquiries
29% increase from 2013
In 2015 we answered 70,949 emails, calls, and chats - an increase of 11,612 inquiries
16% increase from 2014
In 2016, we answered 78,421 emails, calls, and chats - an increase of 7,472 inquiries
10% increase from 2015
In 2017, we answered 71,556 emails, calls, and chats - a decrease of 6,865 inquiries
-9% decrease from 2016
*No % increase since call tracking started in Q4 2012.
App Launch History
- 2018: Launched 5 apps, 13 upgrades (so far...)
- 2017: Launched 12 apps, 15 upgrades
- 2016: Launched 14 apps, 22 upgrades
-
2015: Launched 16 apps, 15 upgrades
-
2014: Launched 11 apps, 17 upgrades
-
2013: Launched 21 apps, 22 upgrades
So Far This Year...
- From January 1 to June 30, 2018, we handled 40,701 inquiries, an increase of 5% compared to the same period in 2017.
Stats
- So far in 2018 we're averaging 6,700 interactions per month:
- Phone calls ~2,625 (39%)
- Chats ~2,329 (34%)
- Emails ~1,829 (27%)
- Our average first response time is 1 hour and 27 minutes.
- Our average resolution is 24 hours and 15 minutes.
- Our first contact resolution is 92%.
- Our first response SLA and our resolution SLA is 100%.
Question Time
Which of our services generates the most calls?
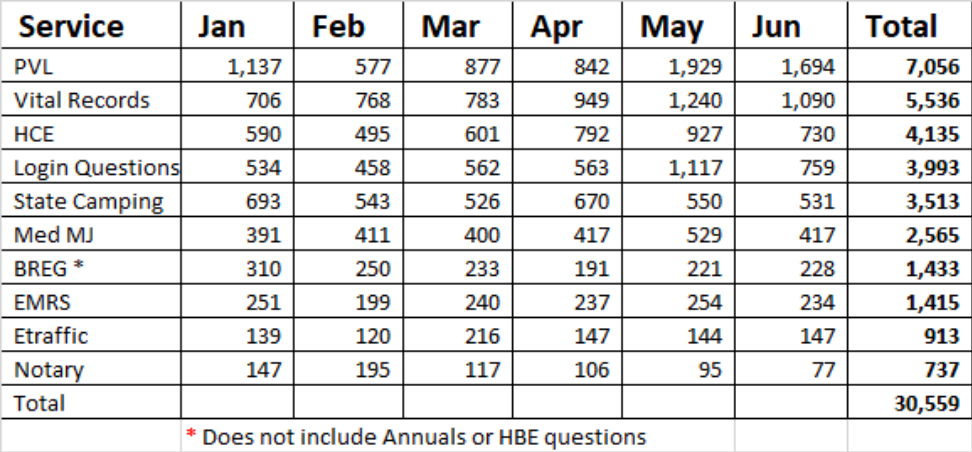
Top 10 Calls of 2018
Did You Know...
- That we also accommodate walk in customers?
- That we have a 'partners@ehawaii.gov' email that PM/PLs can use for partners to get help while they are on vacation?
- We have a 'help@ehawaii.gov' email that can be used instead of info@ehawaii.gov?
- That FIVE of our existing staff all started here as part of the CS team?
CS Hall of Fame!


Our estimated value is...
Equation 4 FTE x 2,080 hours (52 weeks x 40 hours per week) = 8,320 hours provided to the State per year
- 8,320 x $100/hour (HIC blended rate) = $832,000 provided to the State Portal Program per year
- 8,320 x $75/hour (HIC blended rate) = $624,000 provided to the State Portal Program per year
- 8,320 x $50/hour (HIC blended rate) = $416,000 provided to the State Portal Program per year
BONUS: Funniest Moments

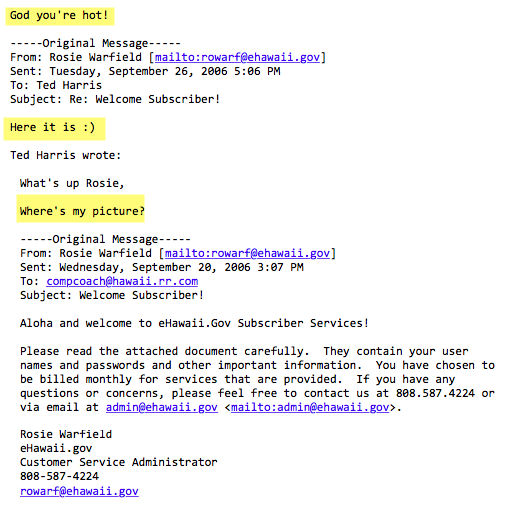
BONUS: Funniest Moments
BONUS: Funniest Moments
BONUS: Funniest Moments
BONUS: Funniest Moments
BONUS: Funniest Moments
Questions?
Thank you for your phenomenal work and contributions to customer service!
- Bobby
- Norman
- Ron
- Jamie
- Rosie