Westbrook Glaucoma
Results -- Figures
-
Scotoma Simulation MS
-
Effect of Glaucoma on Gaze Behavior
-
Ophthalmic Measures and VR Paradigm
-
Local and Global Gaze Behavior
-
The Effect of Visual Function on Gaze Behavior
Scotoma Simulation MS
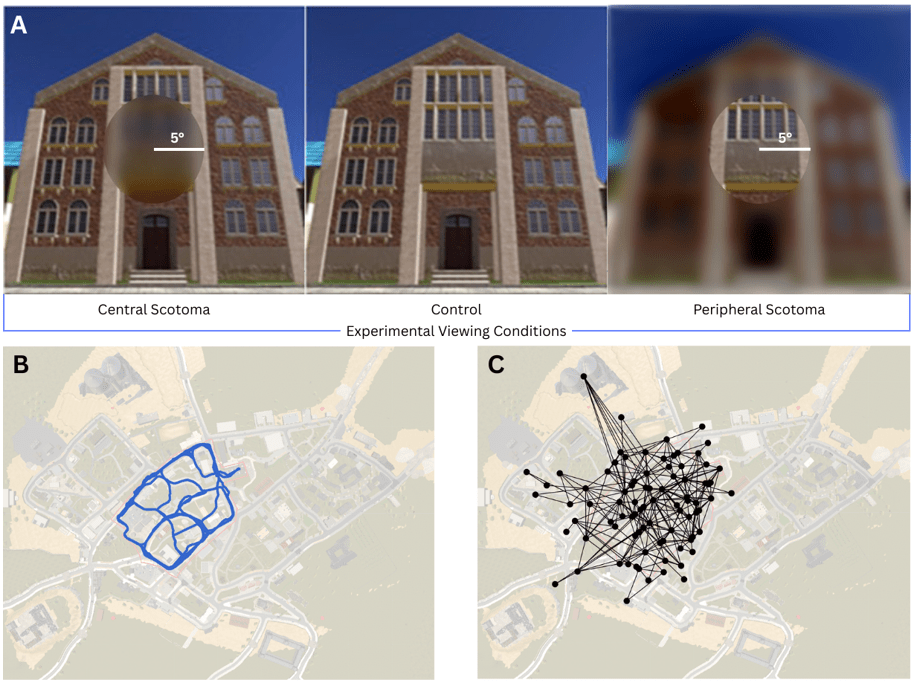
Scotoma Simulation MS
8 participants for each condition
Scotoma Simulation MS
8 participants for each condition
30 minutes
Scotoma Simulation MS
8 participants for each condition
Gaze Graph
30 minutes
Scotoma Simulation MS
8 participants for each condition
Gaze Graph
30 minutes
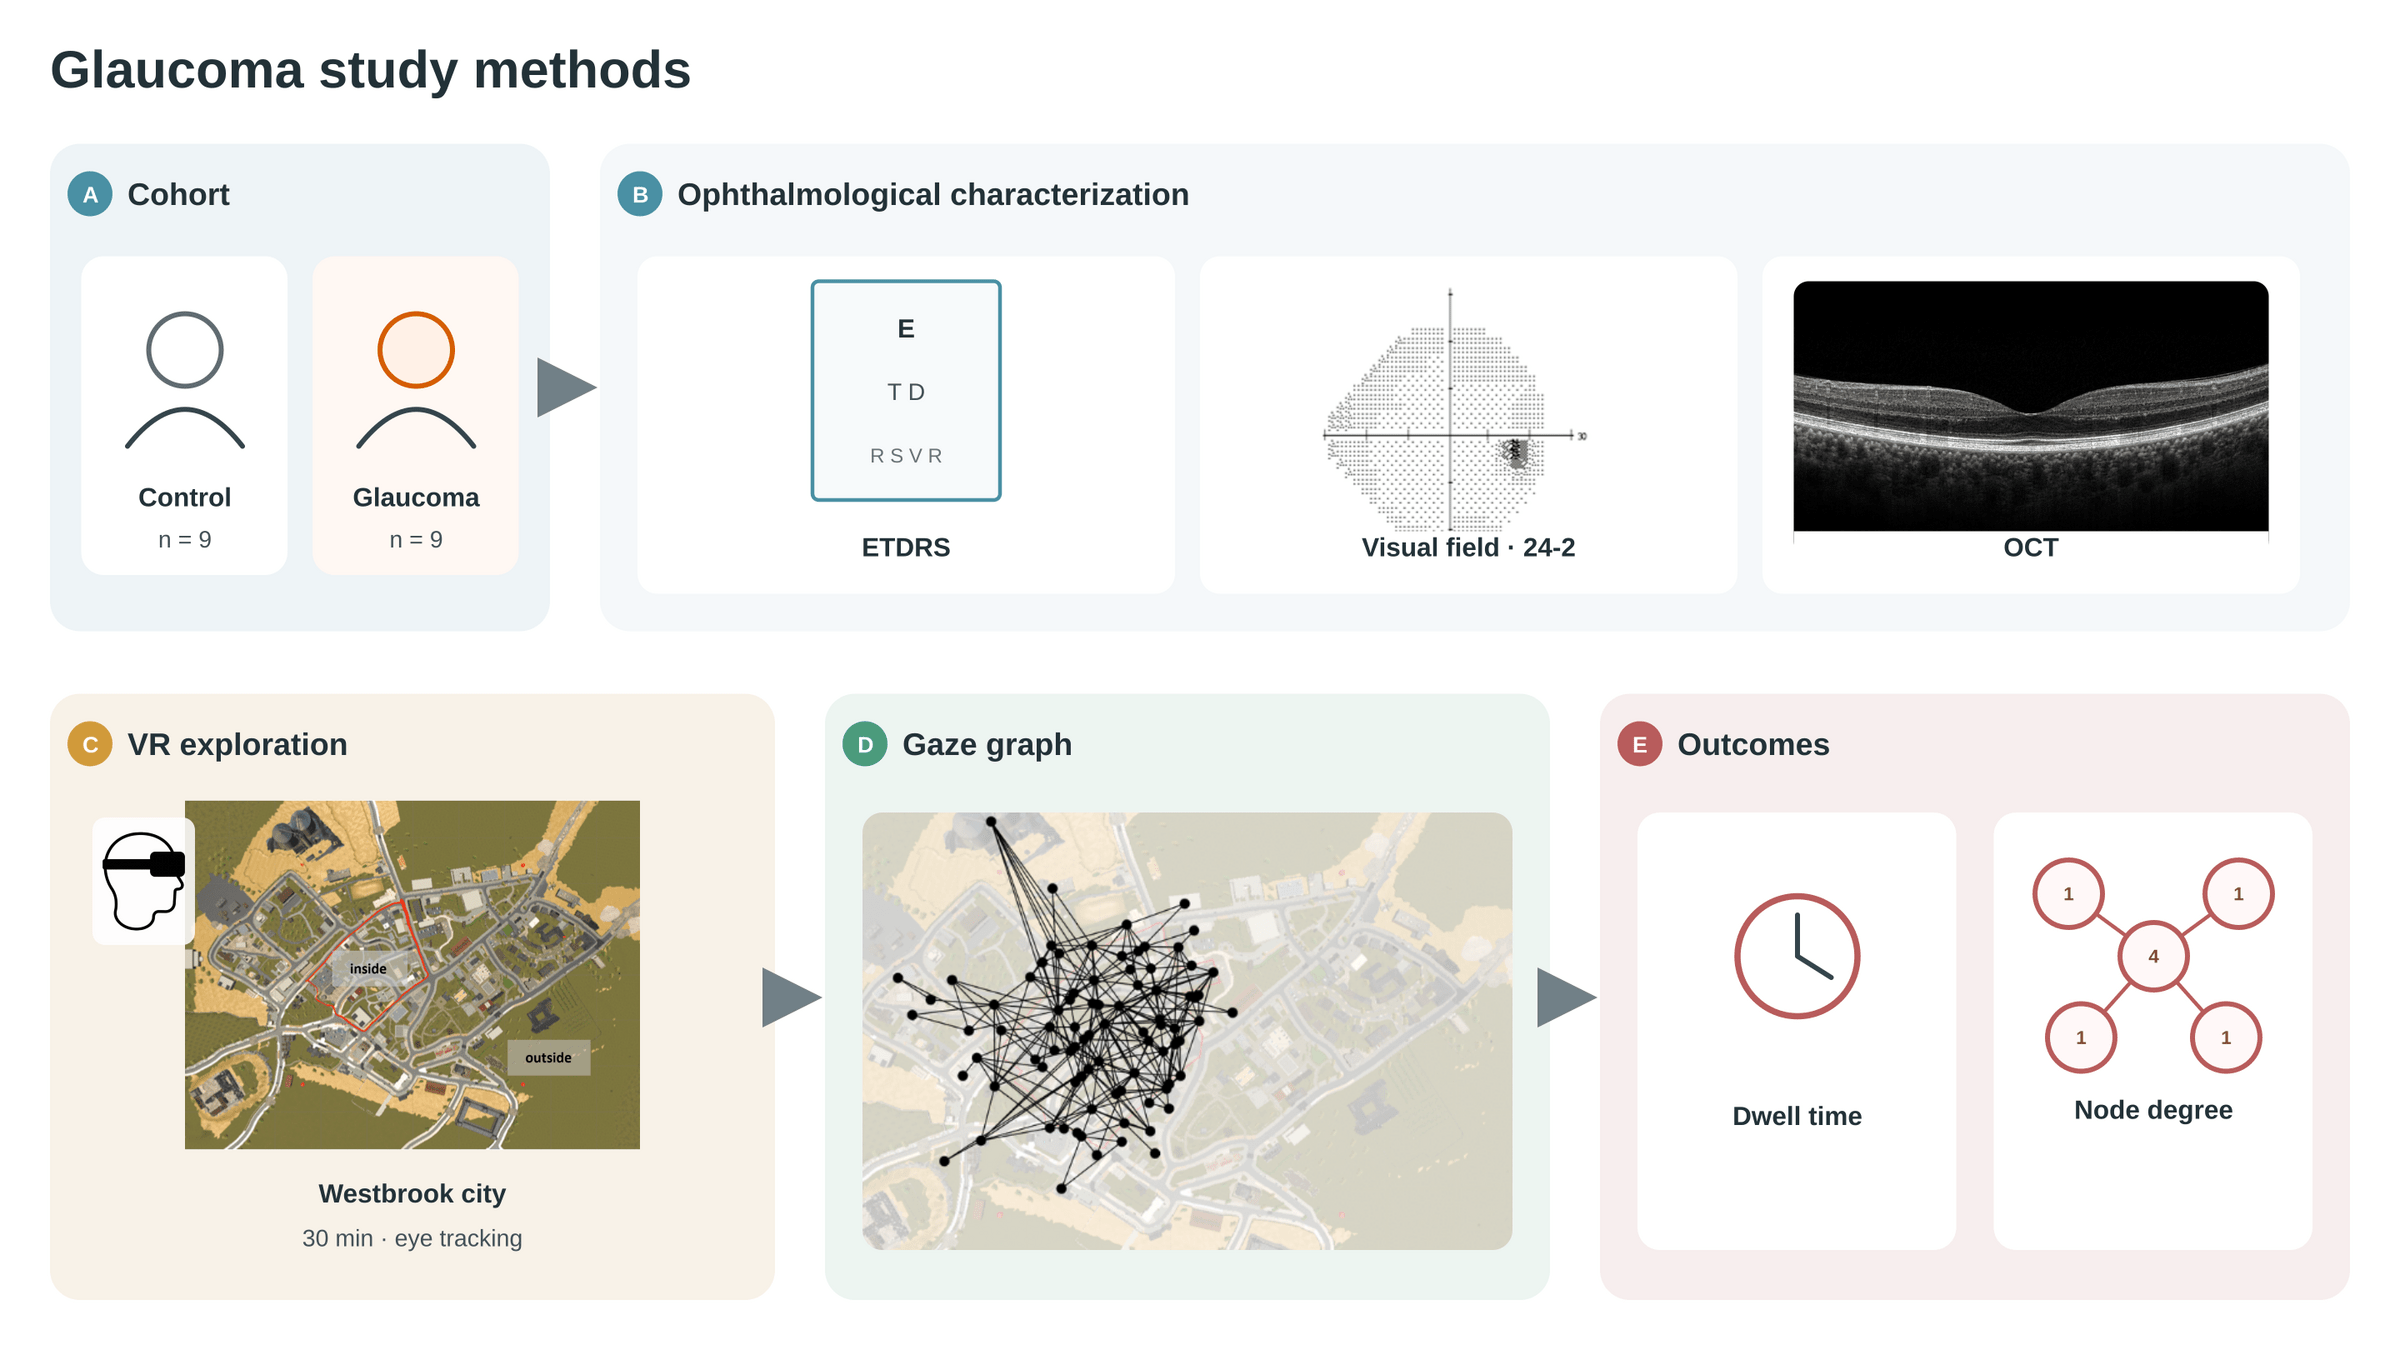
Outcome Measures:
Dwell Time (local)
Node Degree Centrality (global)
Scotoma Simulation MS
Gaze Graph
30 minutes
Scotoma Simulation MS
Gaze Graph
30 minutes
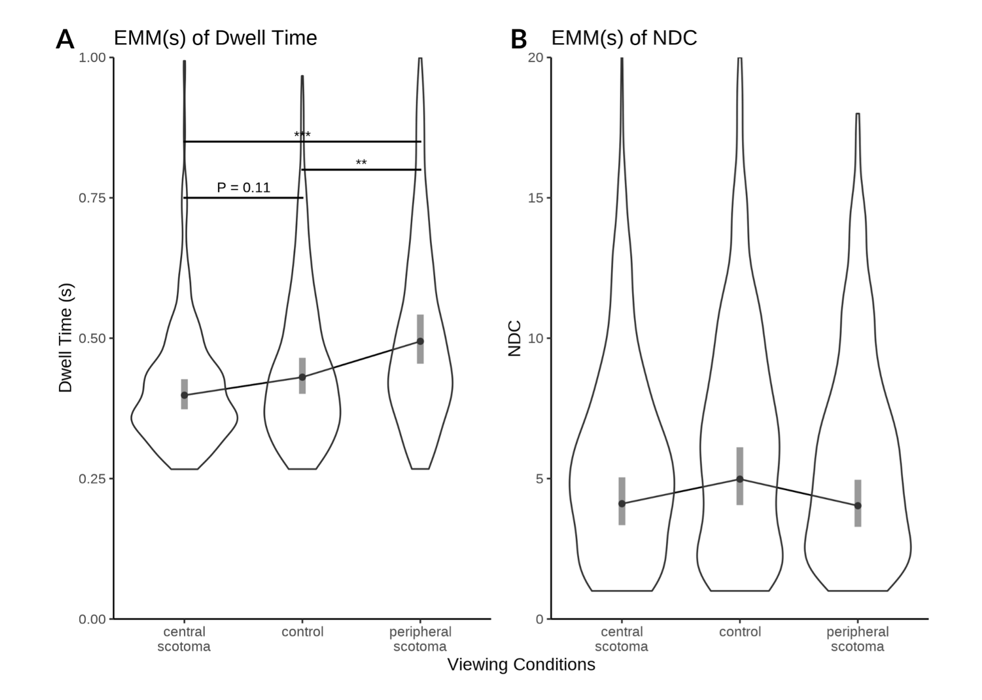
Dwell time differs but not NDC
Scotoma Simulation MS
Gaze Graph
30 minutes
Dwell time differs but not NDC
Scotoma Simulation MS
Gaze Graph
30 minutes
Dwell time differs but not NDC
Scotoma Simulation MS
Gaze Graph
30 minutes
Dwell time differs but not NDC
Hypotheses
H1 · local gaze
- Glaucoma-related dwell-time change
- Peripheral-field compensation
H2 · global gaze
- Lower building connectivity
- Weaker landmark-hub structure
Paradigm · Figure 1
(NDC)
(C)
(GL)
Results · Figure 2 Outcome Measures
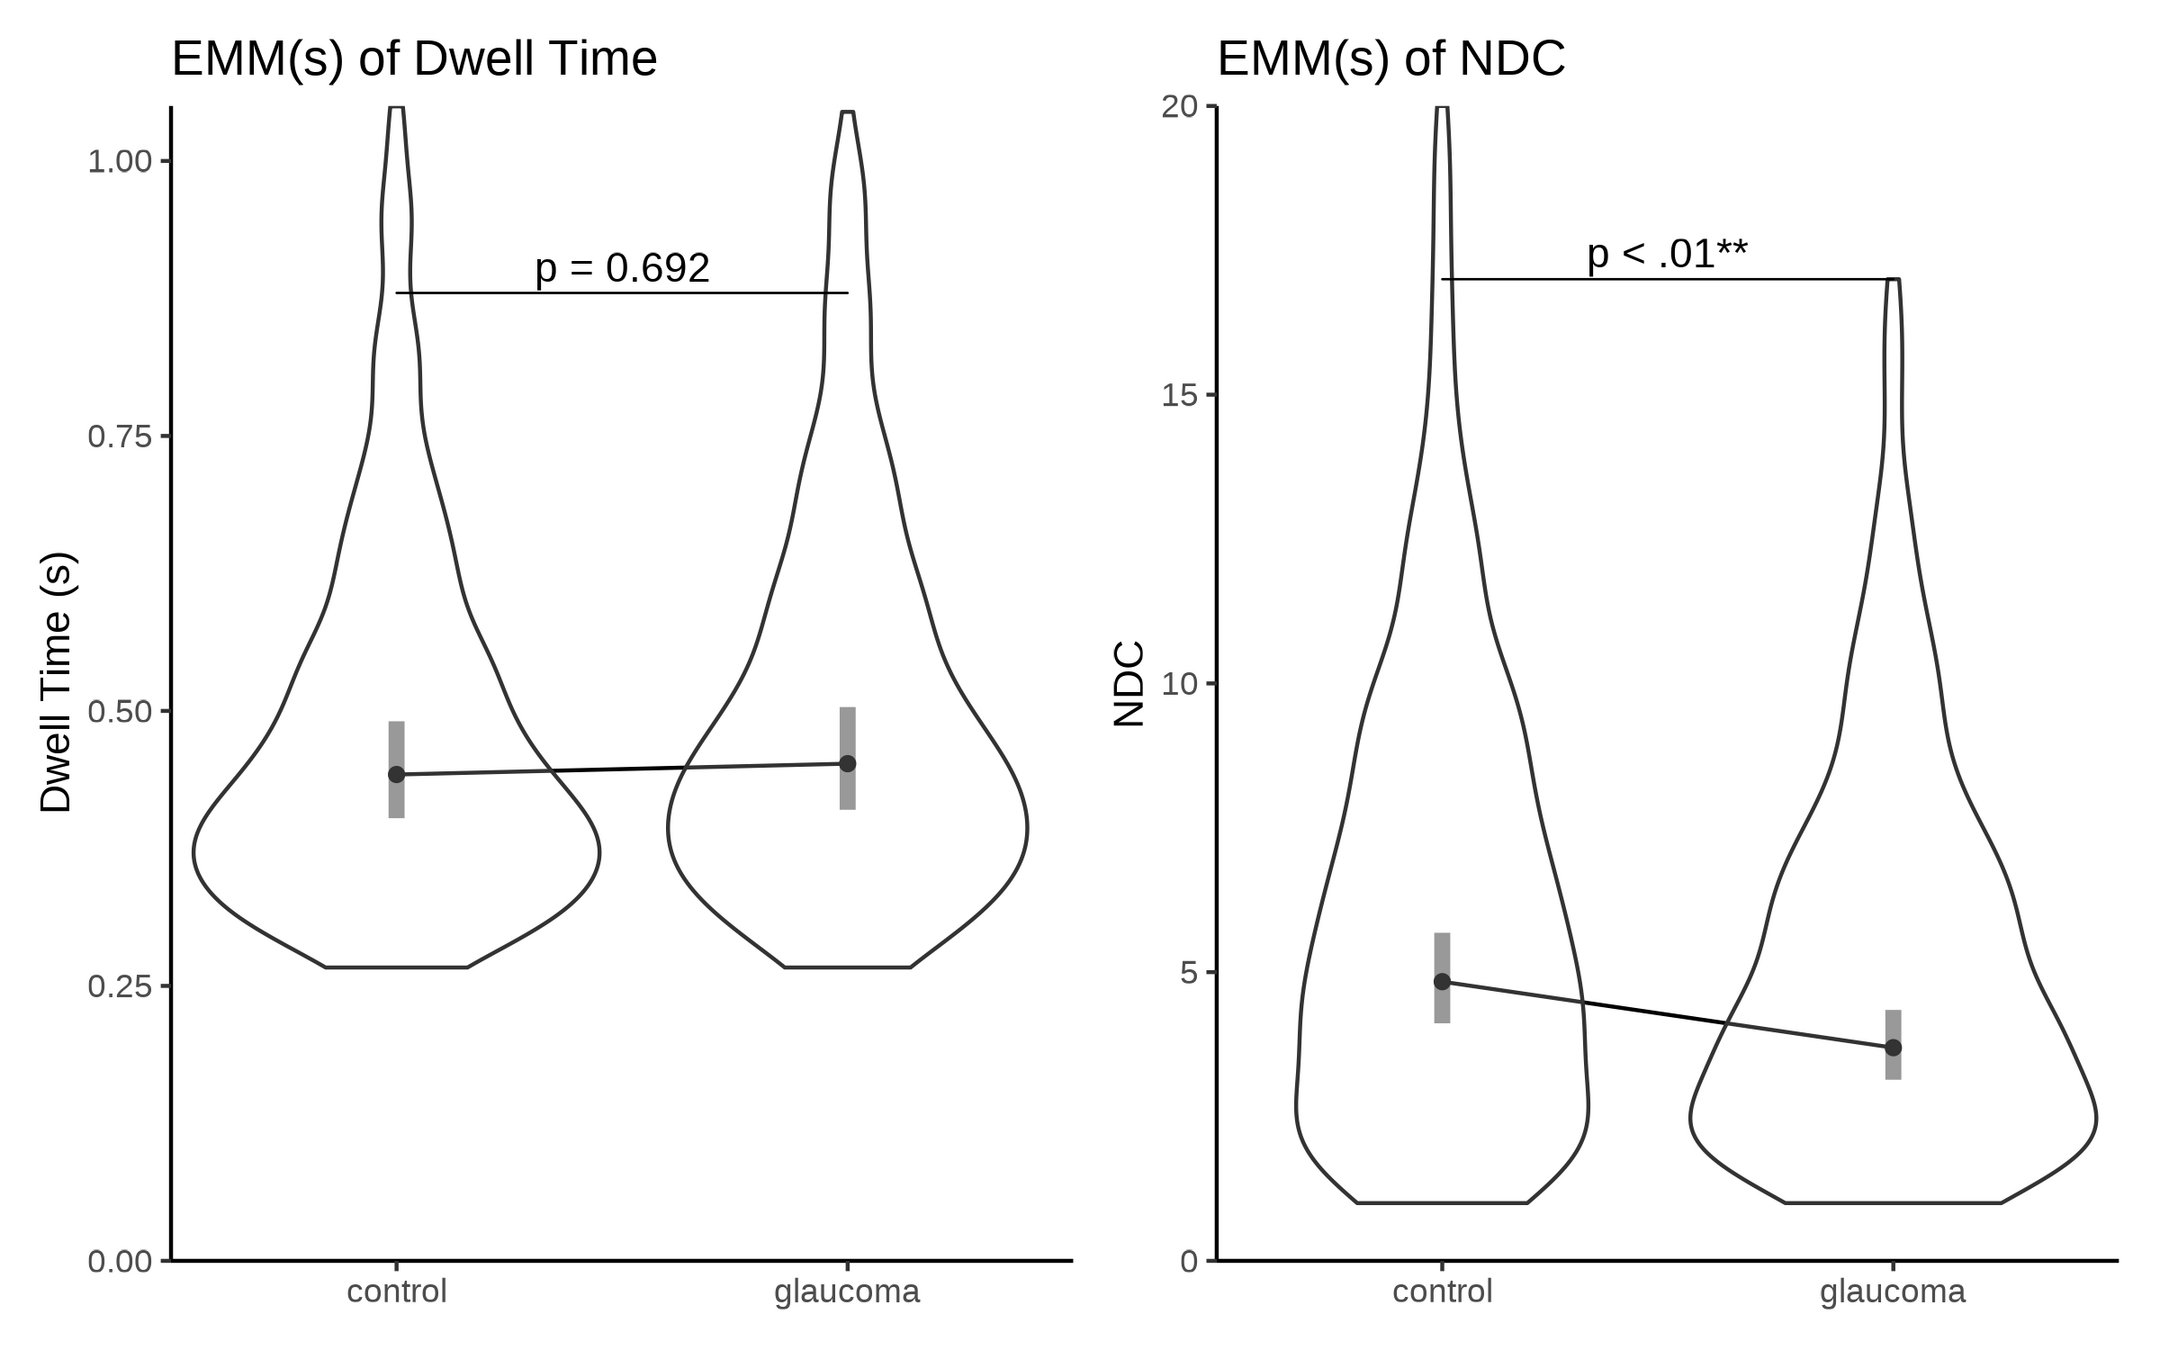
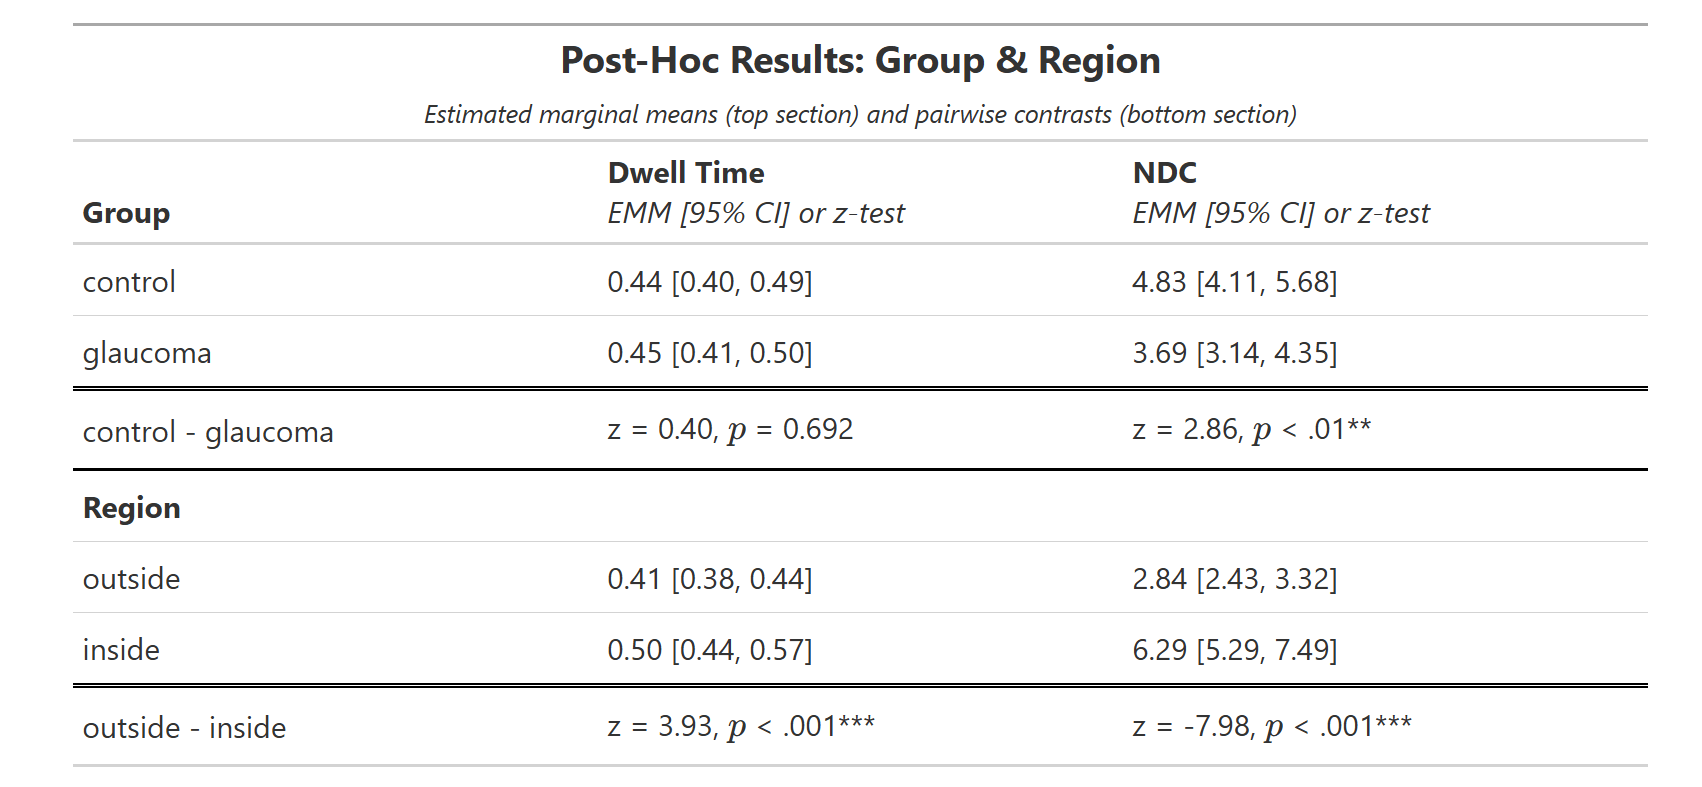
No difference
lower NDC in GL
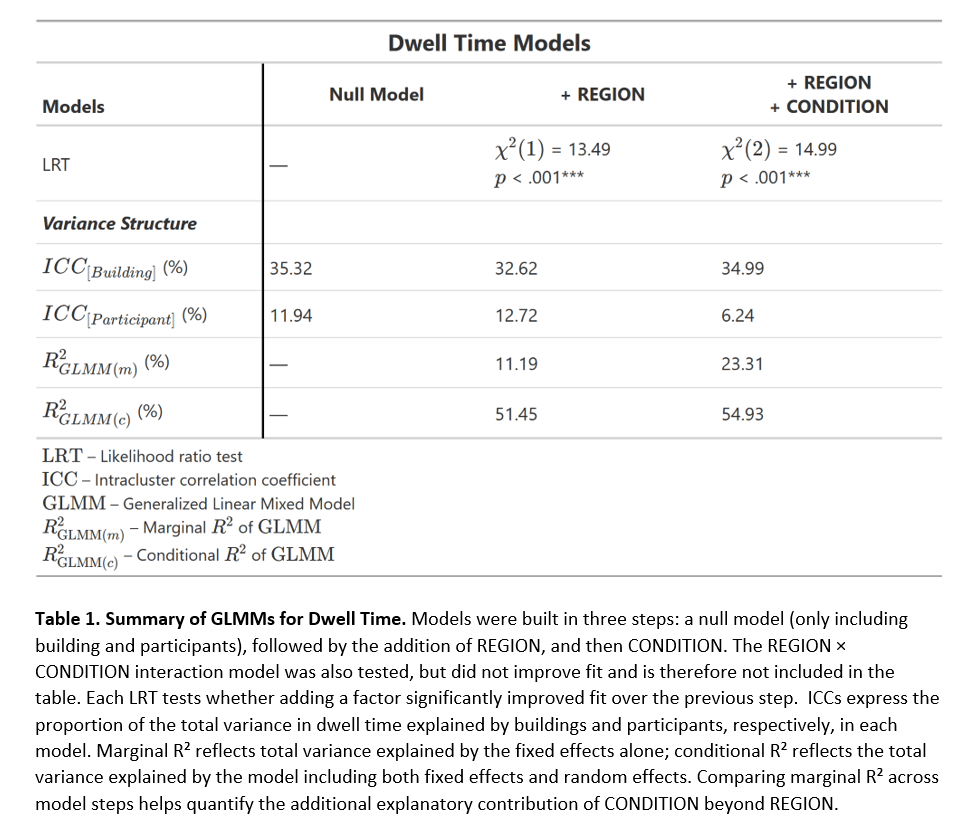
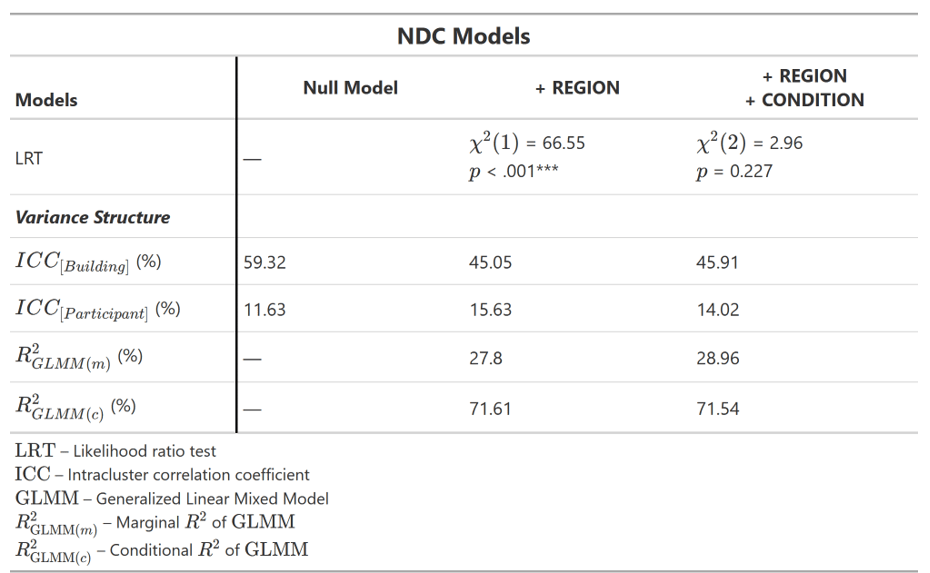
Results · Table 1 Dwell Time
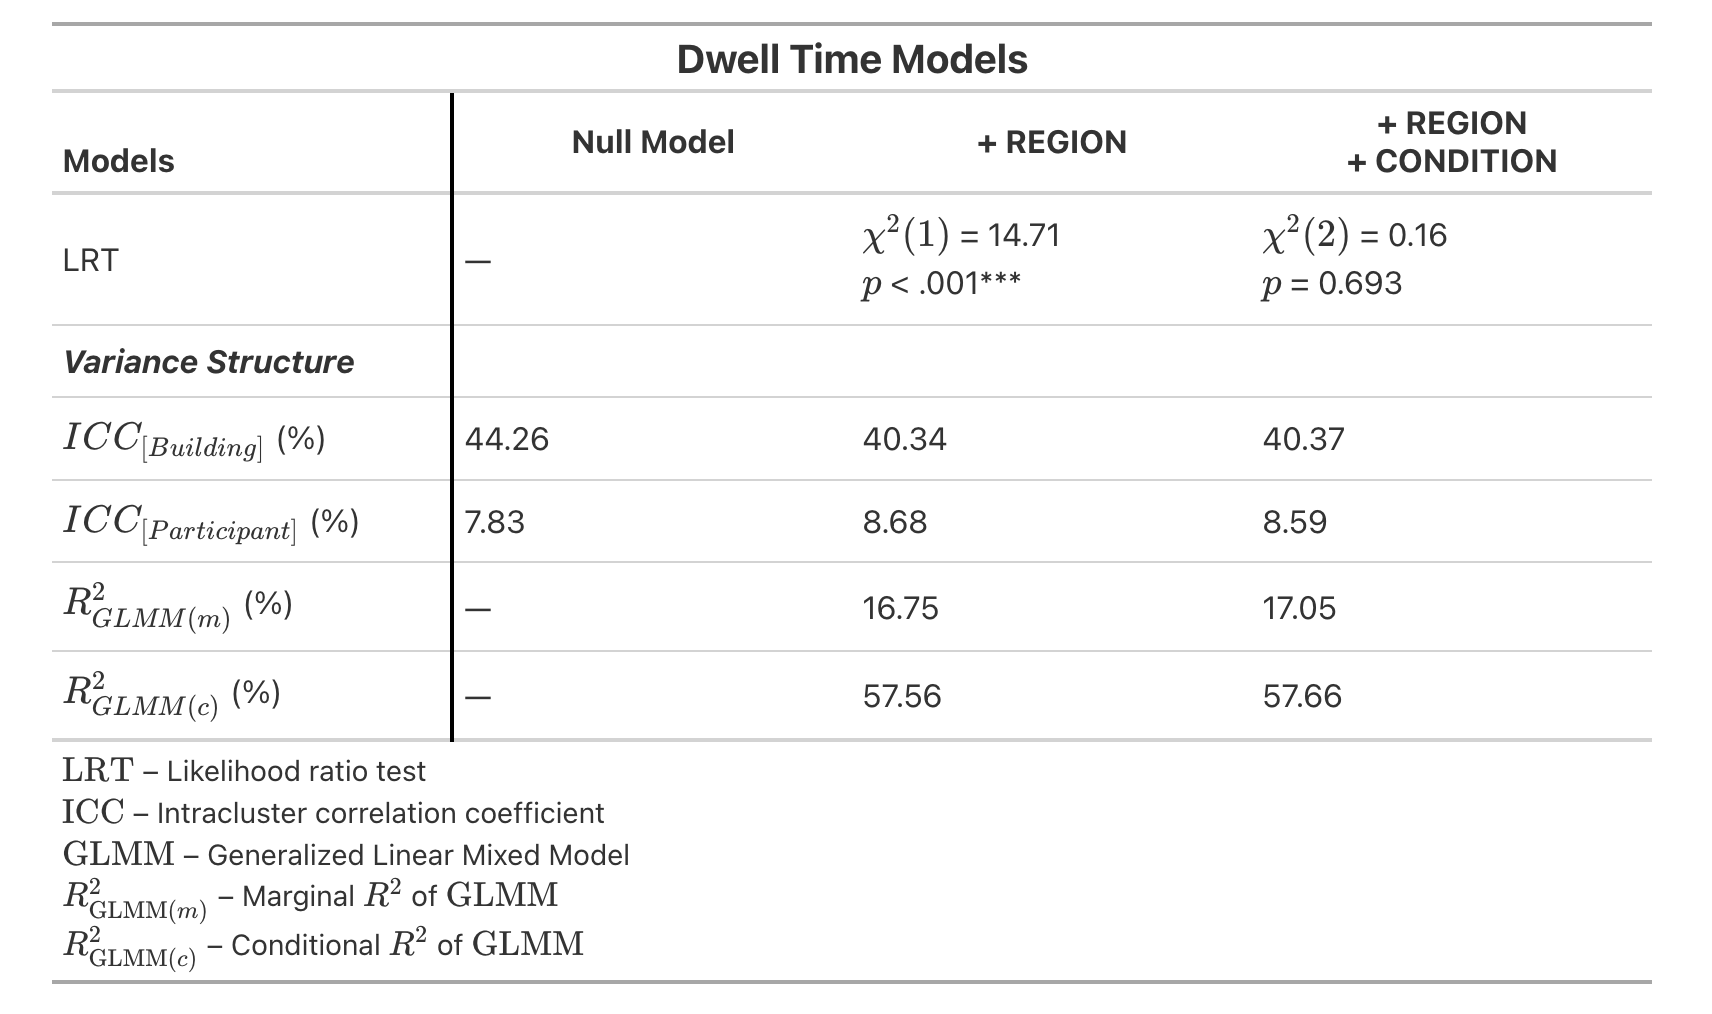
No difference in Dwell Time
Results · Table 2 NDC
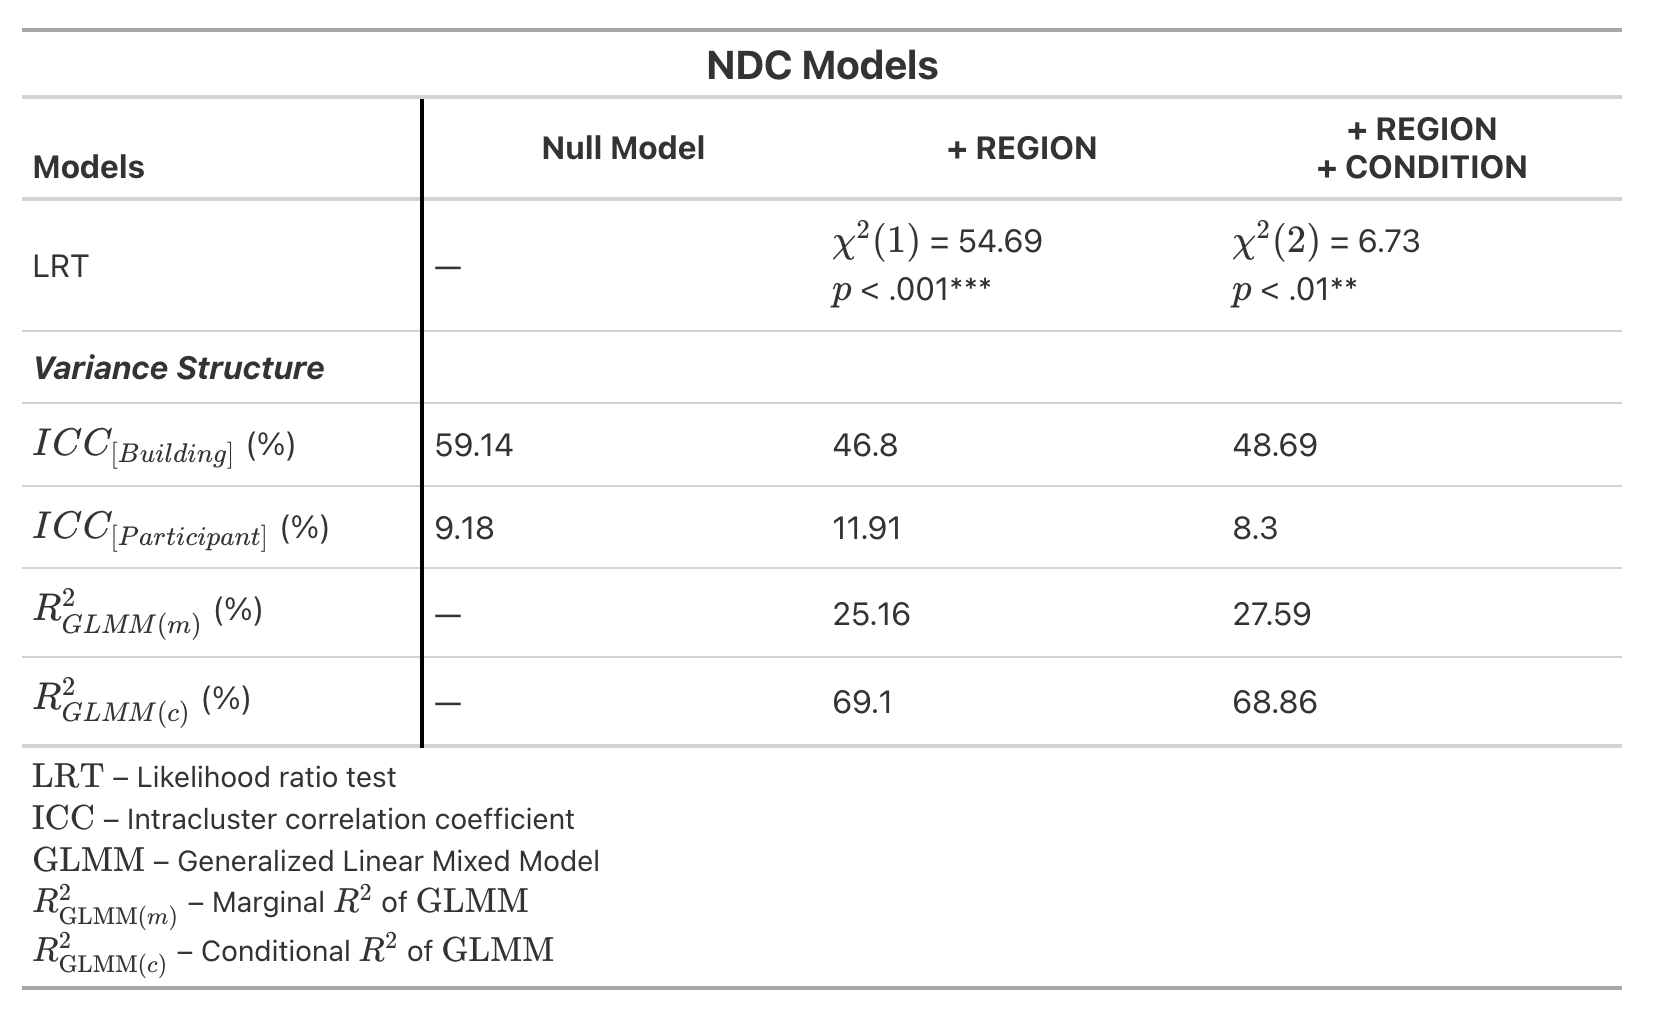
NDC differs between Glaucoma and Control
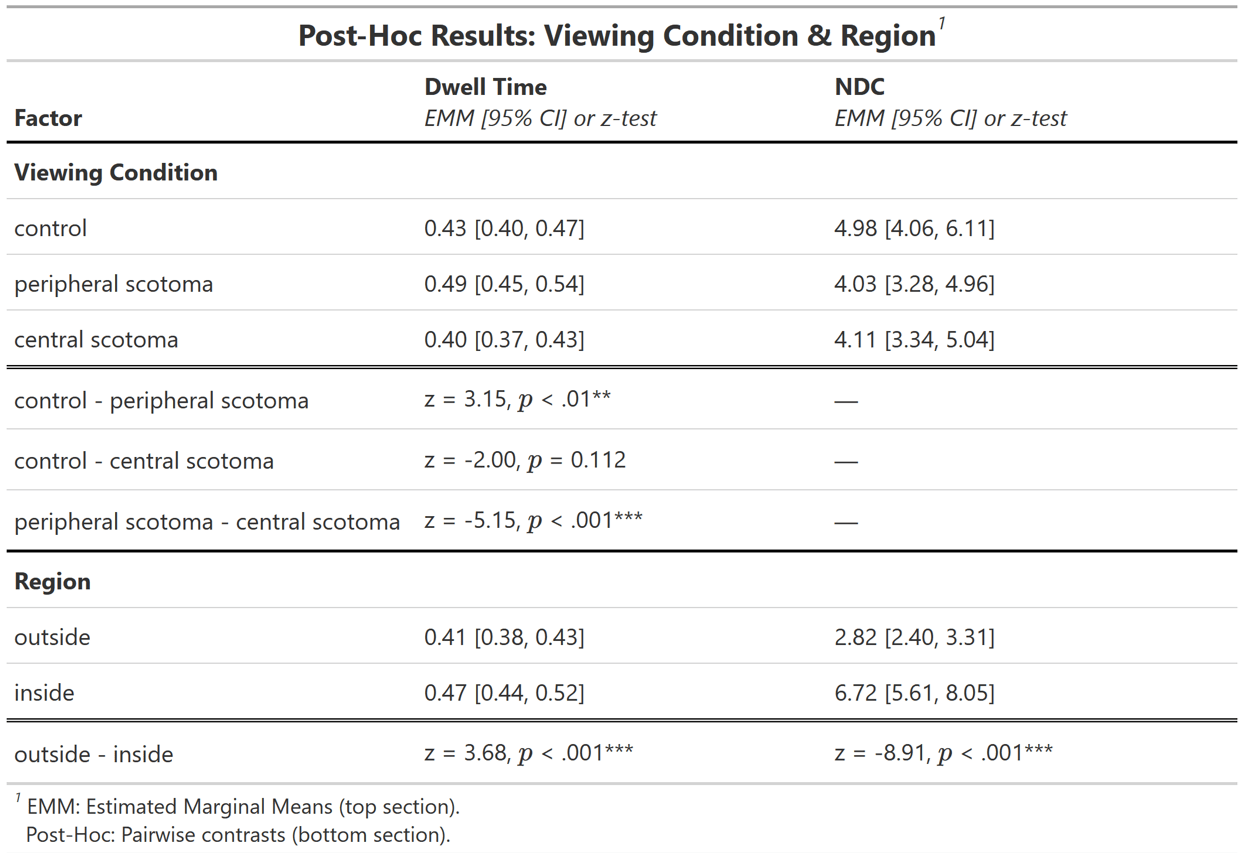
Results · Table 3 Post-hoc
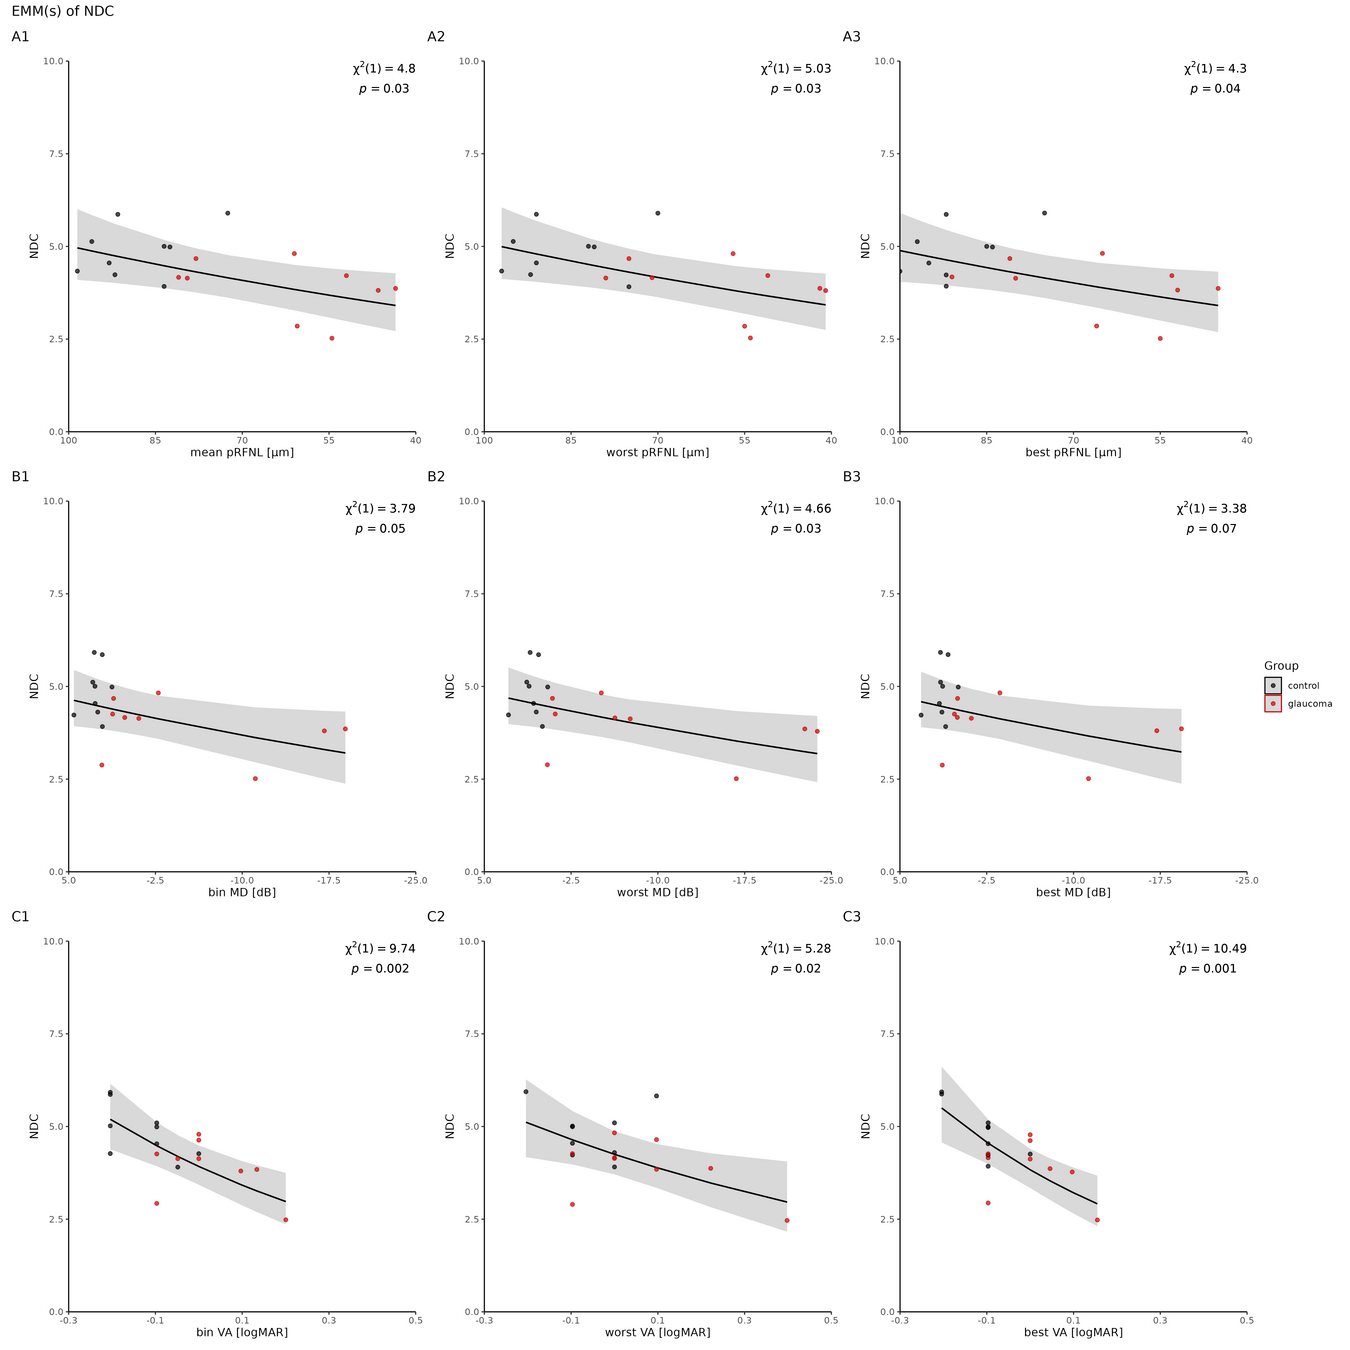
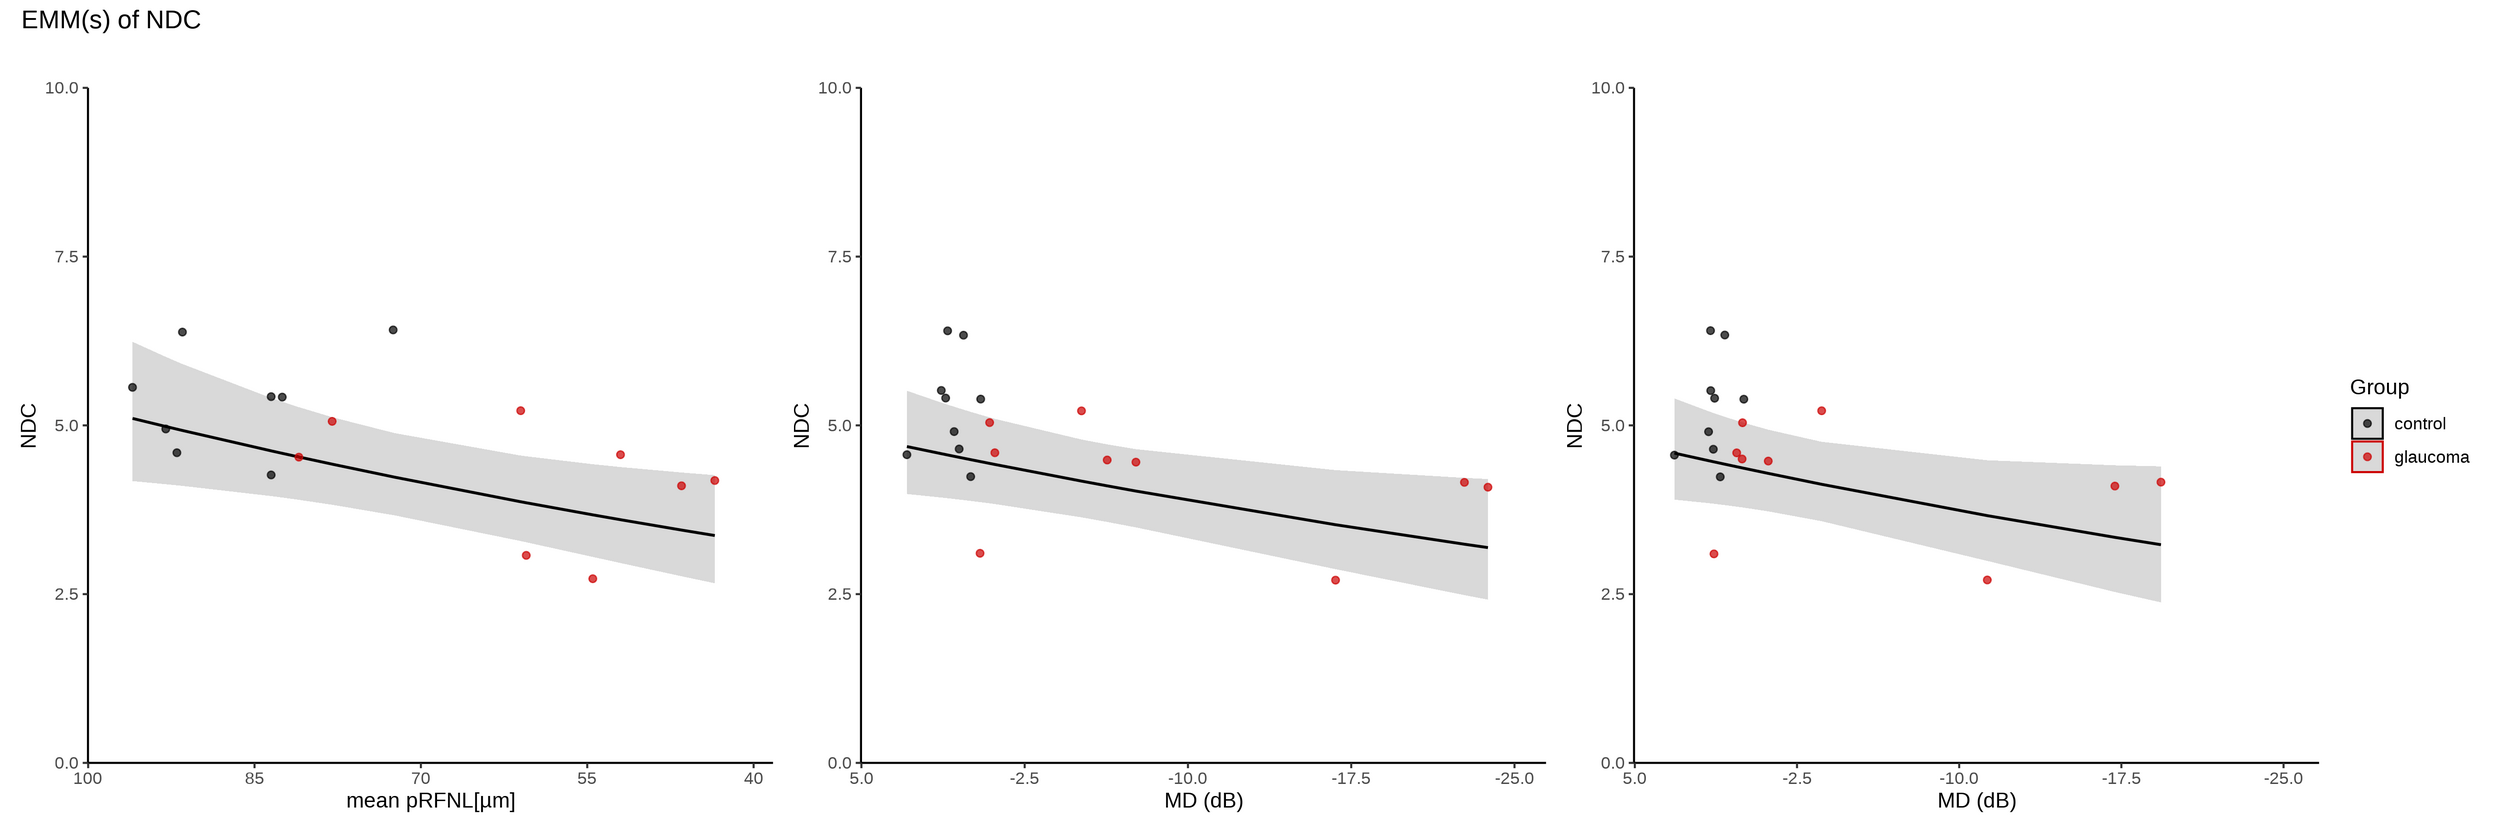
Results · Figure 3 Visual Function Effect on NDC
worst
best
Relation of NDC with retinal thickness and visual field defect*
Main Message
- Preserved local processing — similar building dwell times
- Reduced global visual exploration — lower gaze-network connectivity
- Consistency with reduced scanning
- pRNFL–NDC relationship — retinal damage linked to gaze organization
- Extension from laboratory visual search to naturalistic VR navigation
Supplementary Table S1
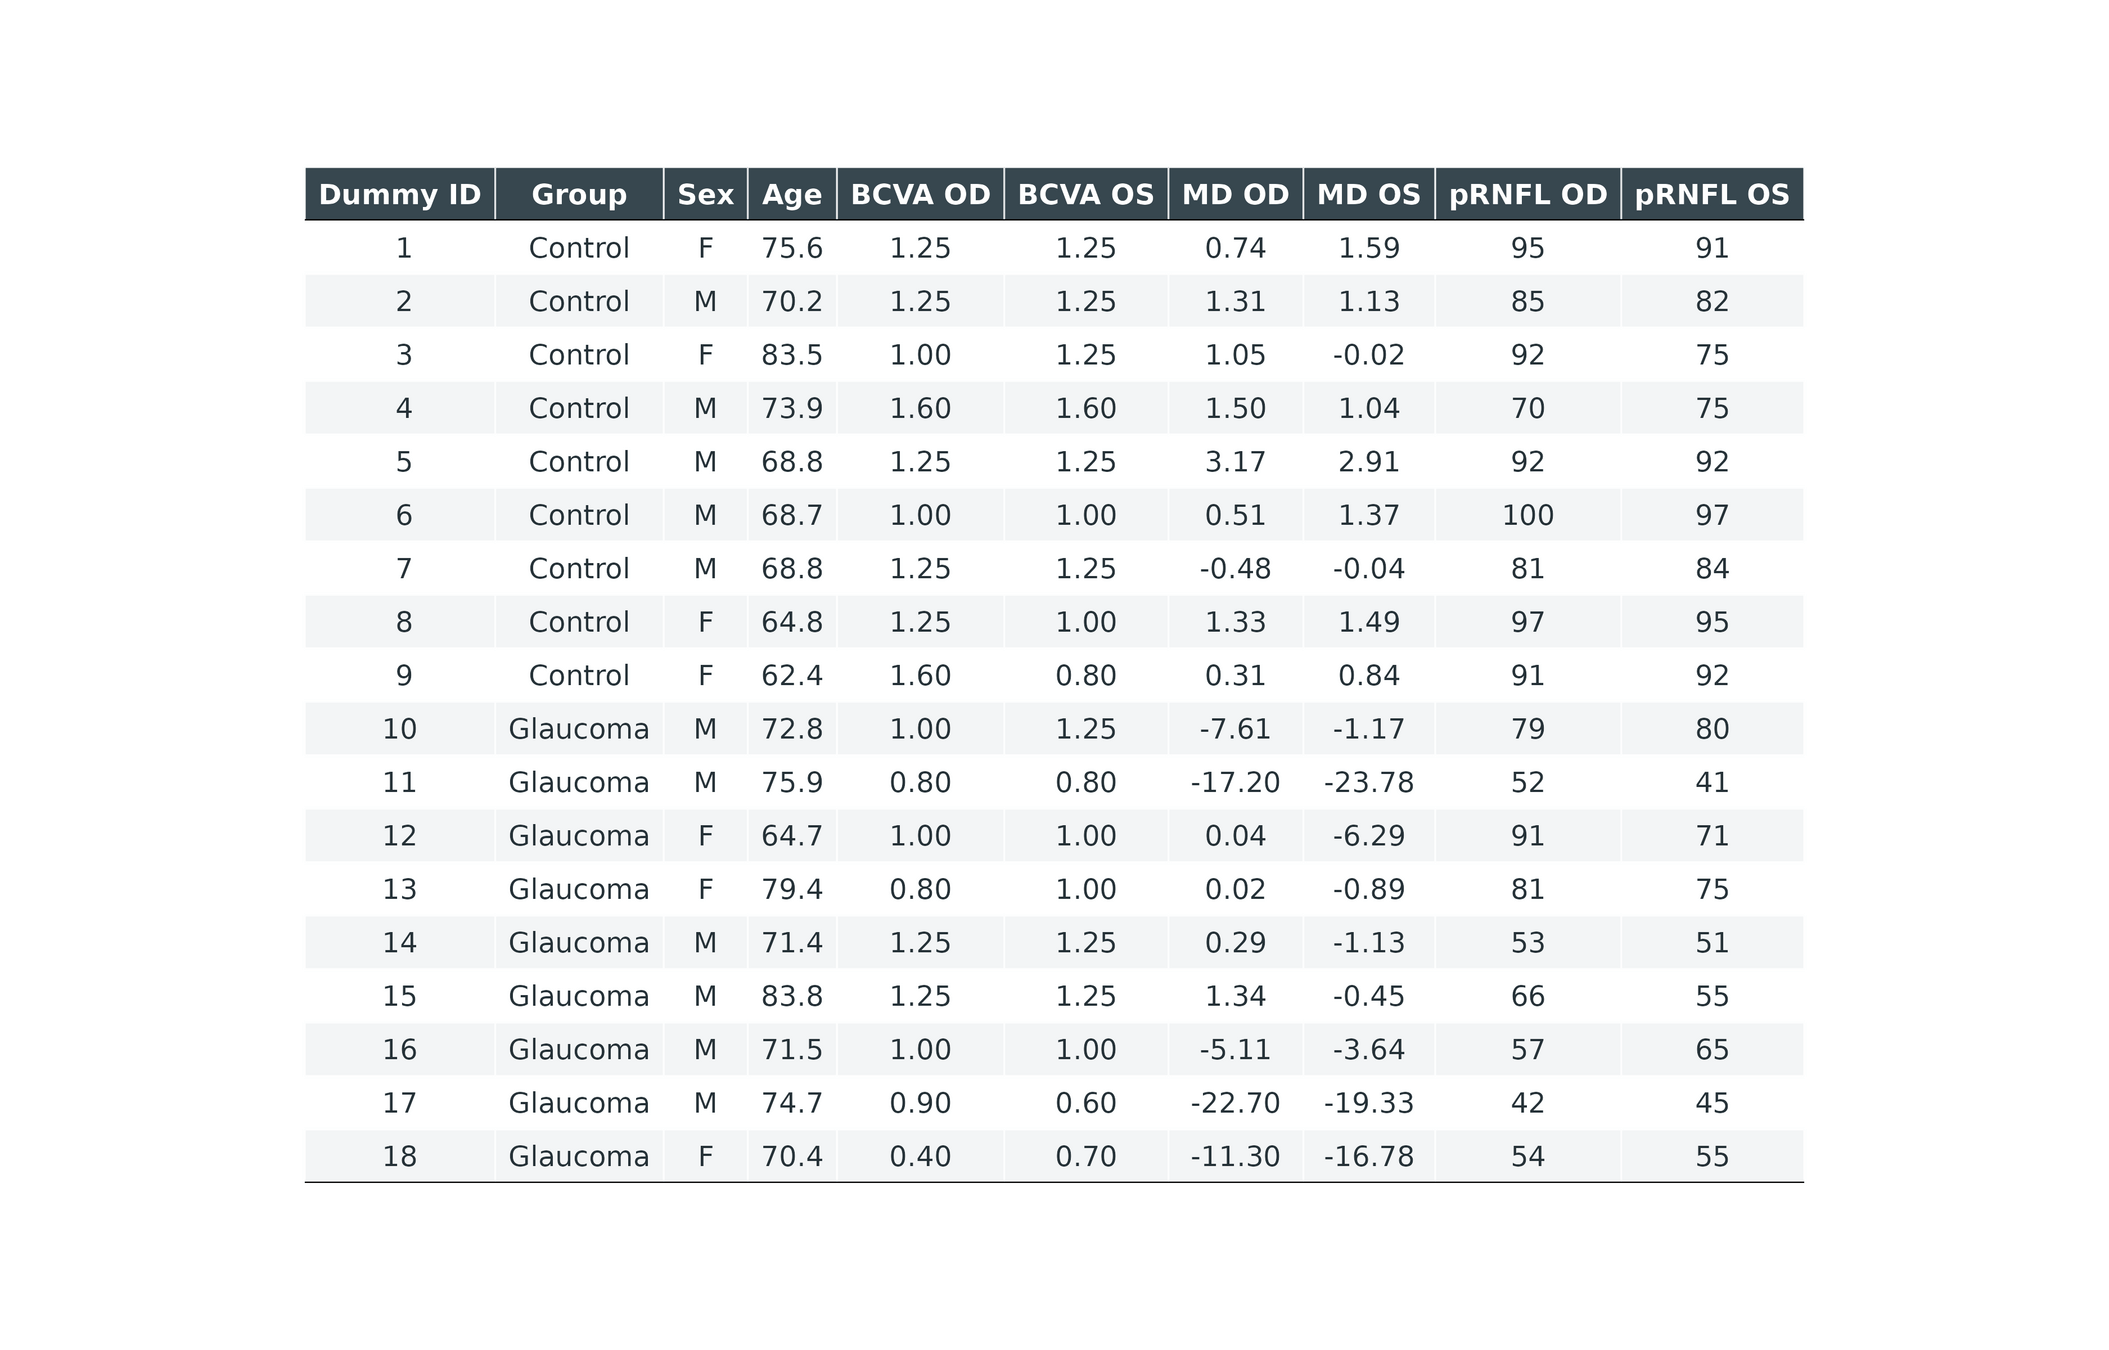
Participant Characteristics
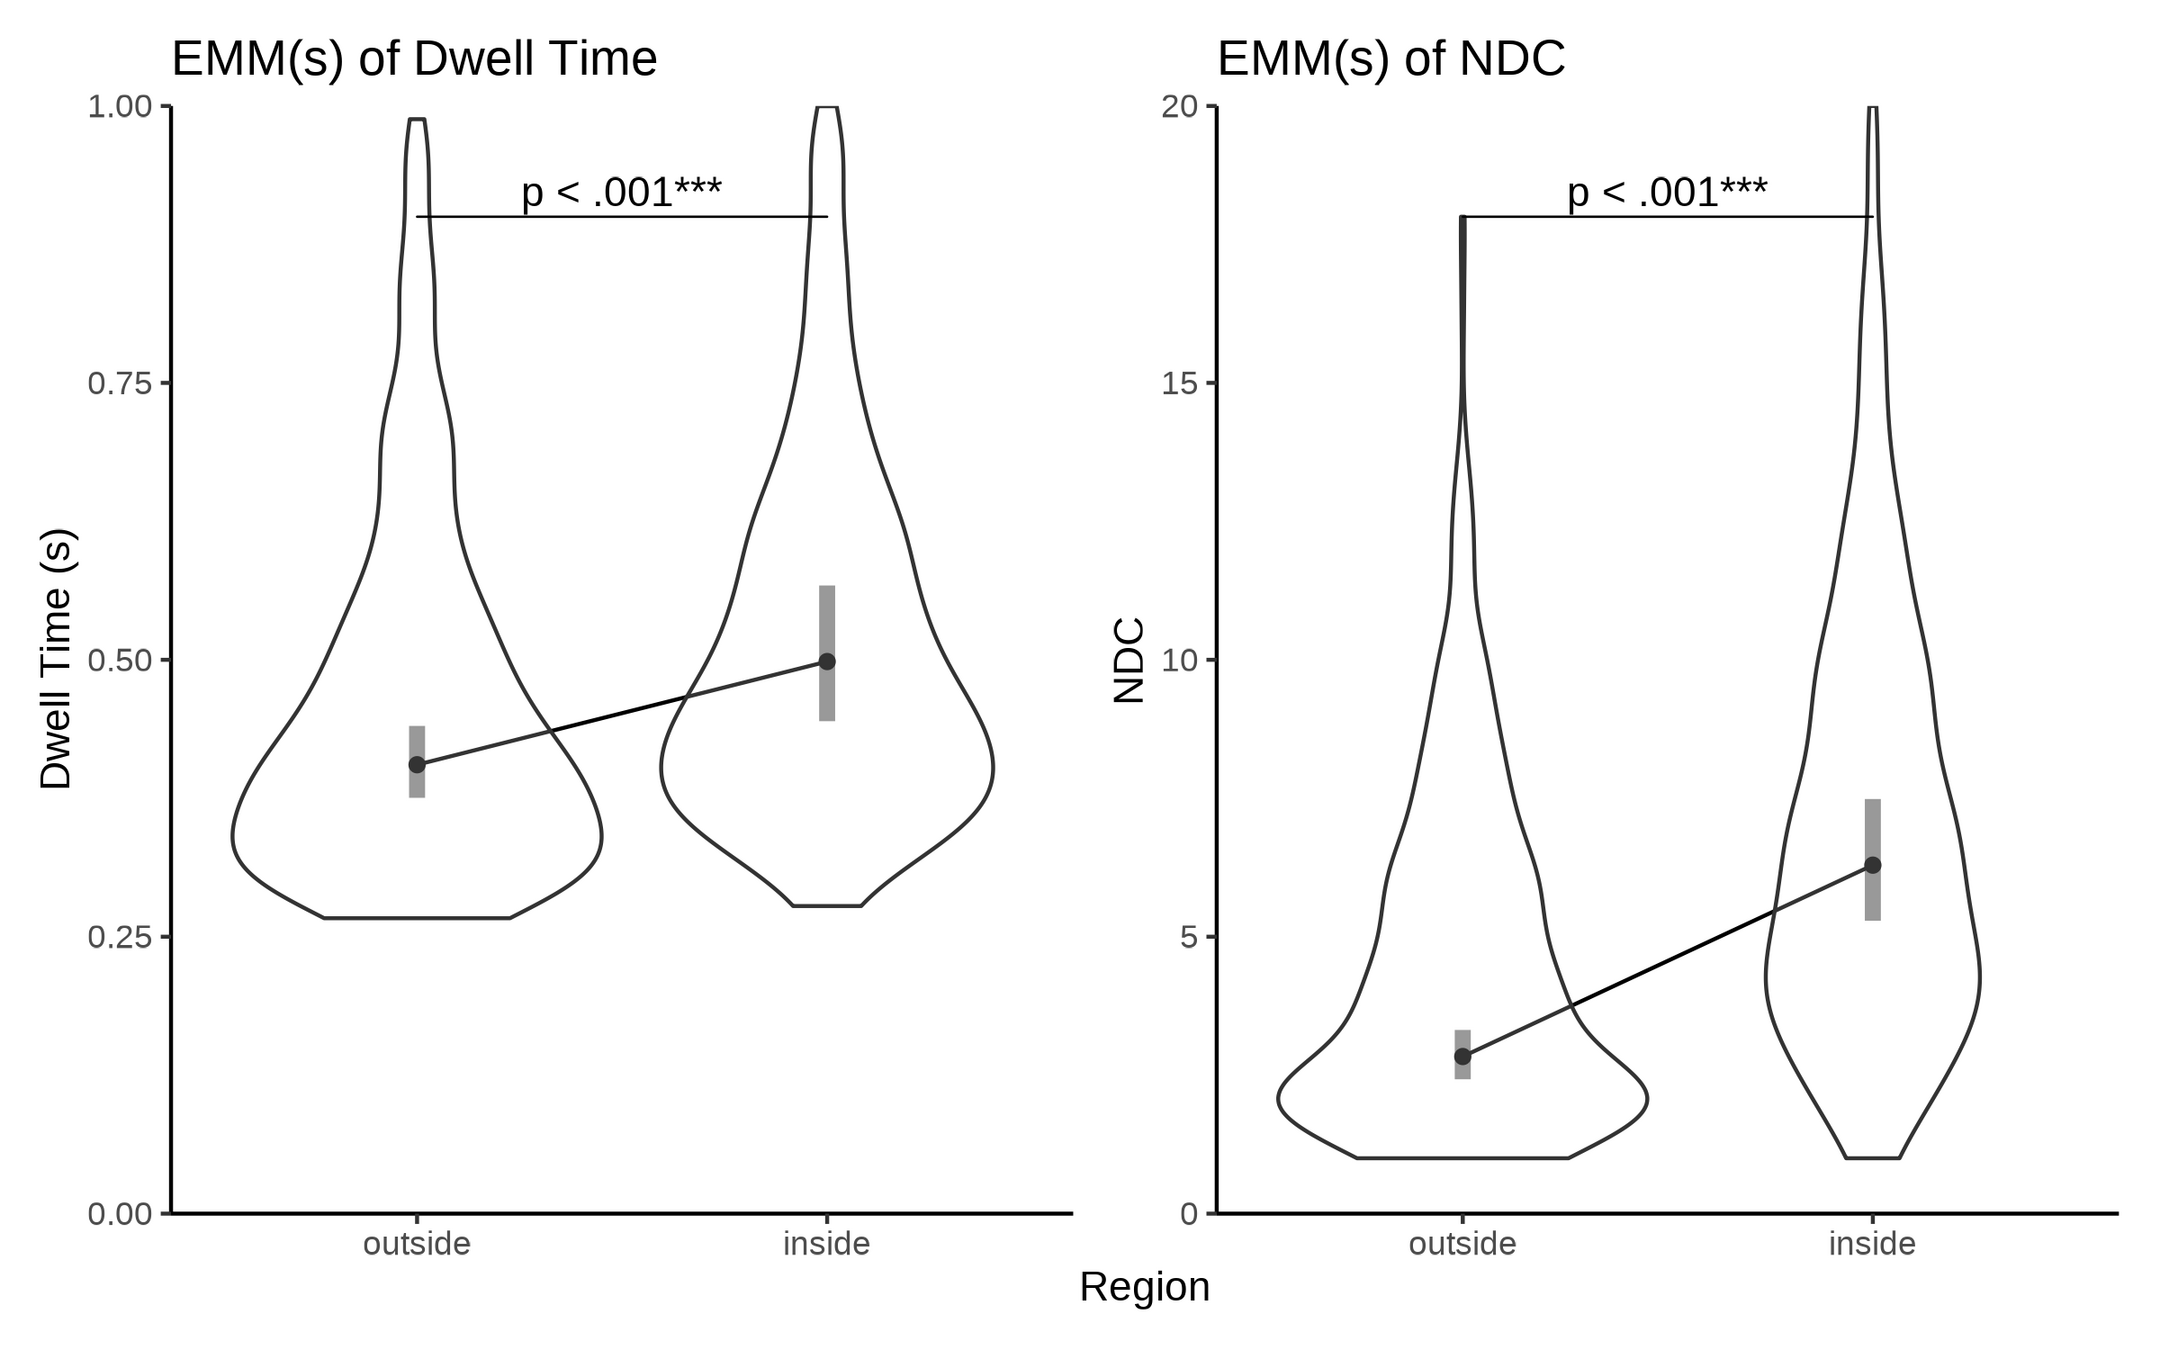
Supplementary Figure S1
Region Effect
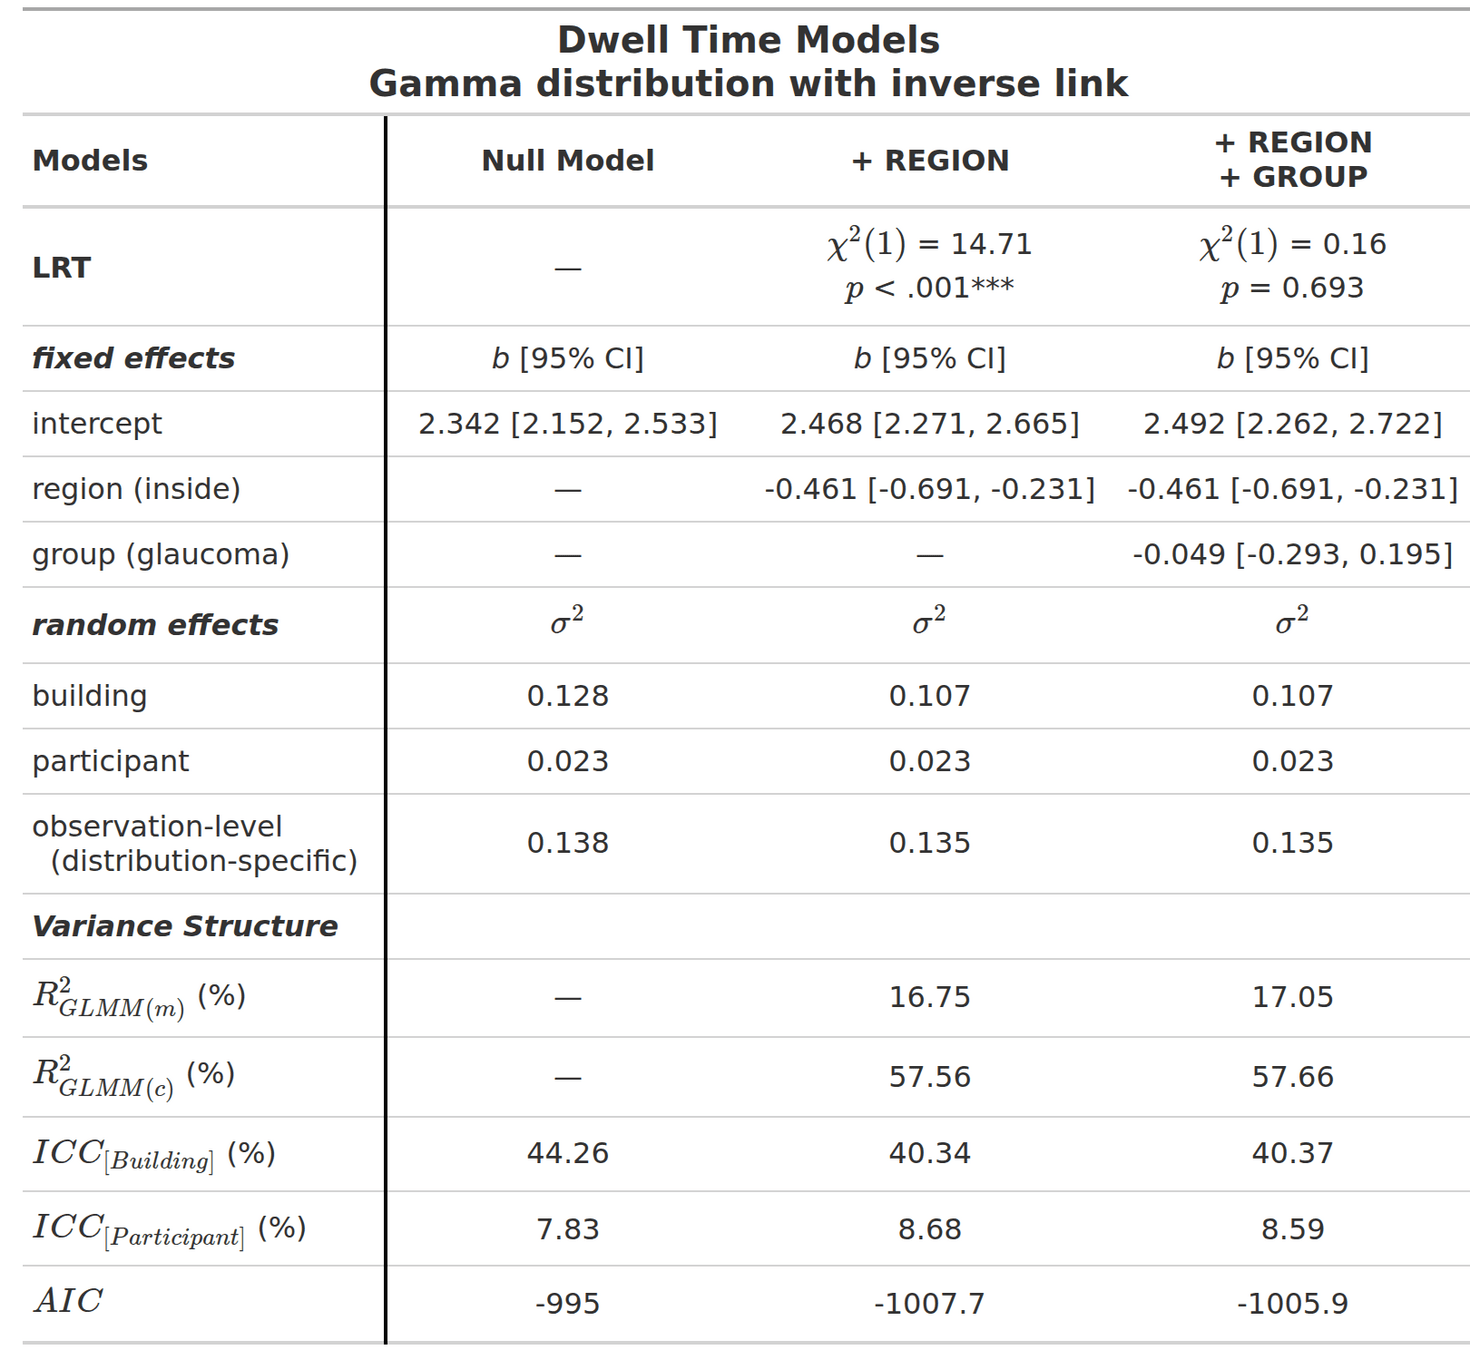
Supplementary Table S2
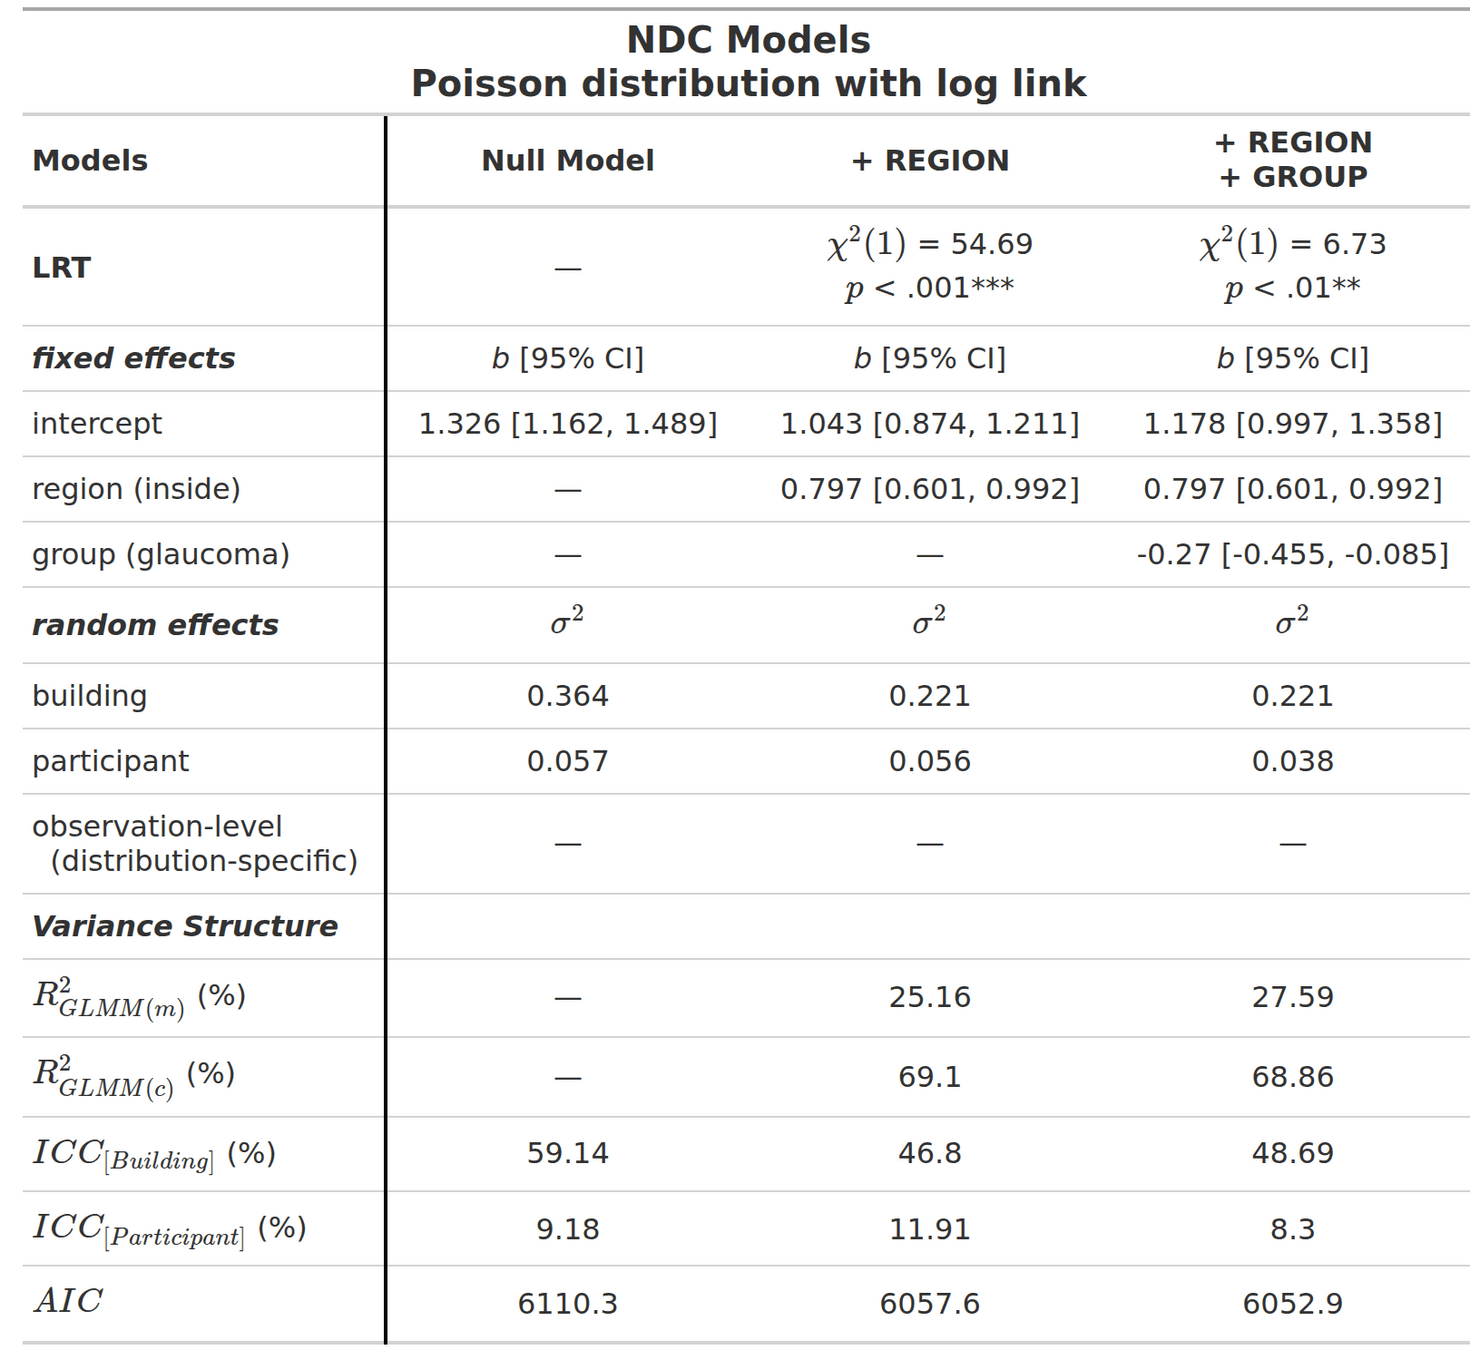
Supplementary Table S3
Supplementary Figure S2
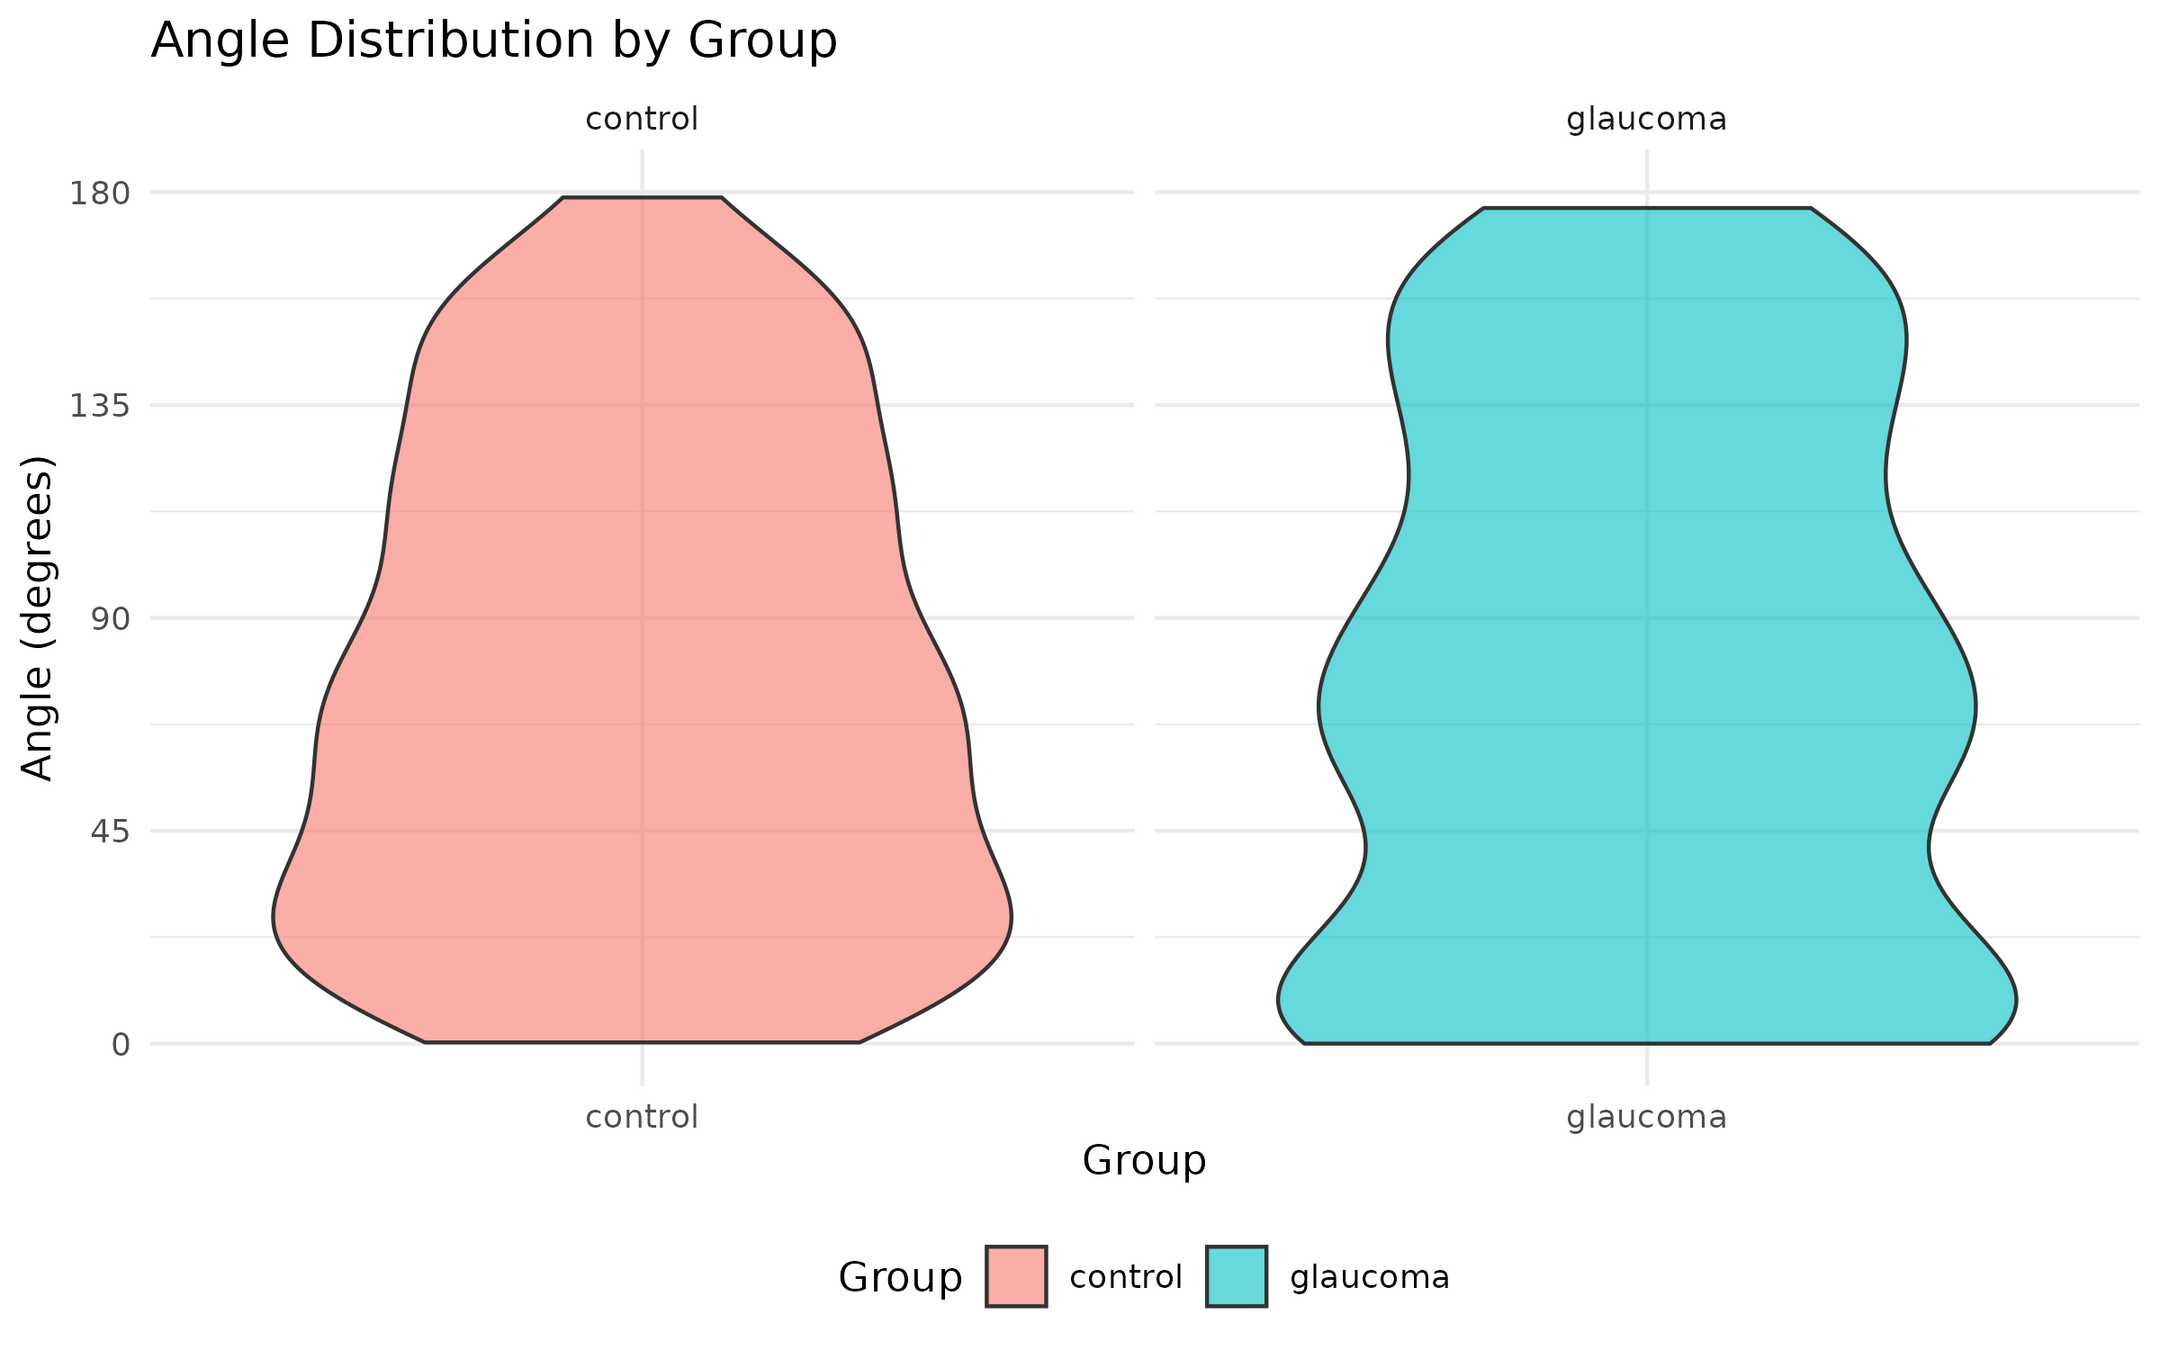
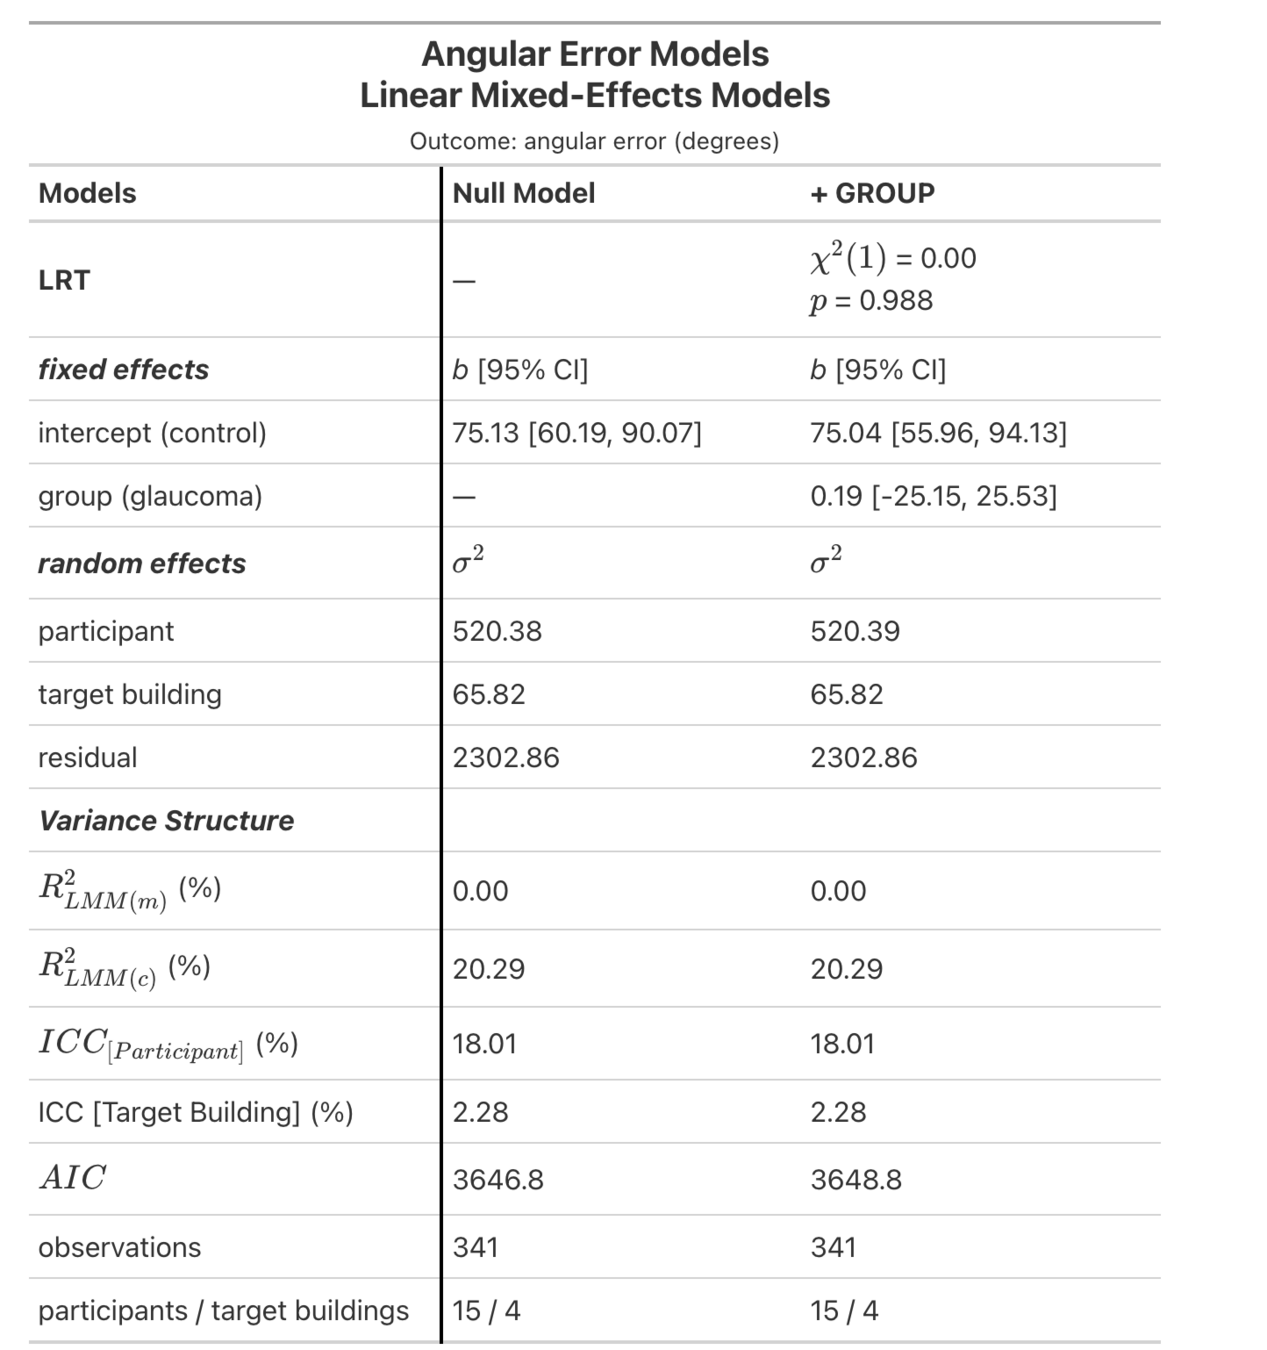
Angular Error in PTB Task
Supplementary Table S4
Supplementary Figure S3
pRNFL vs Visual Function