WESTBRÜCK FIGURES
Simulation Figures
Glaucoma Figures
SIMULATION FIGURES
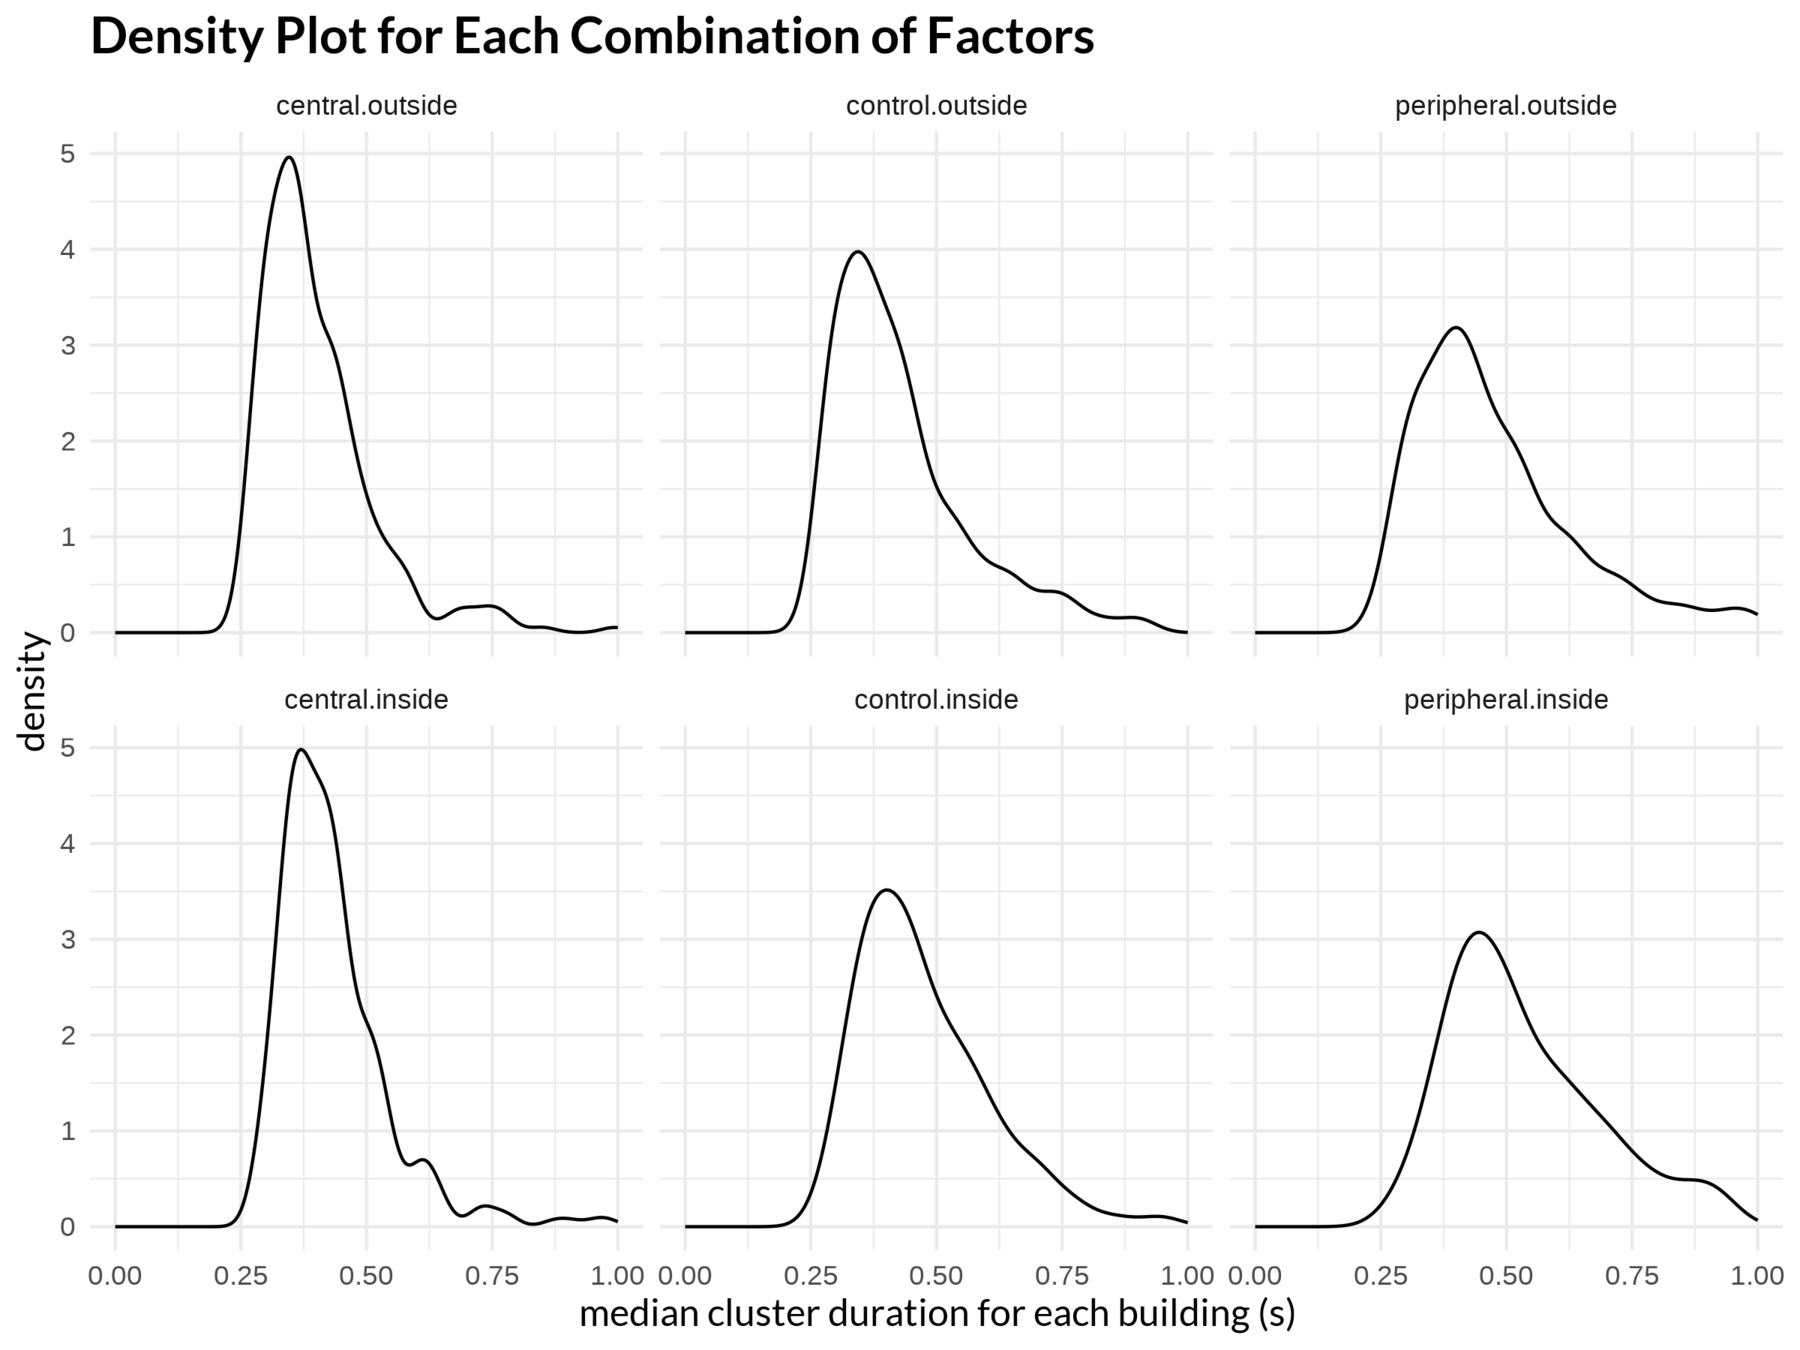
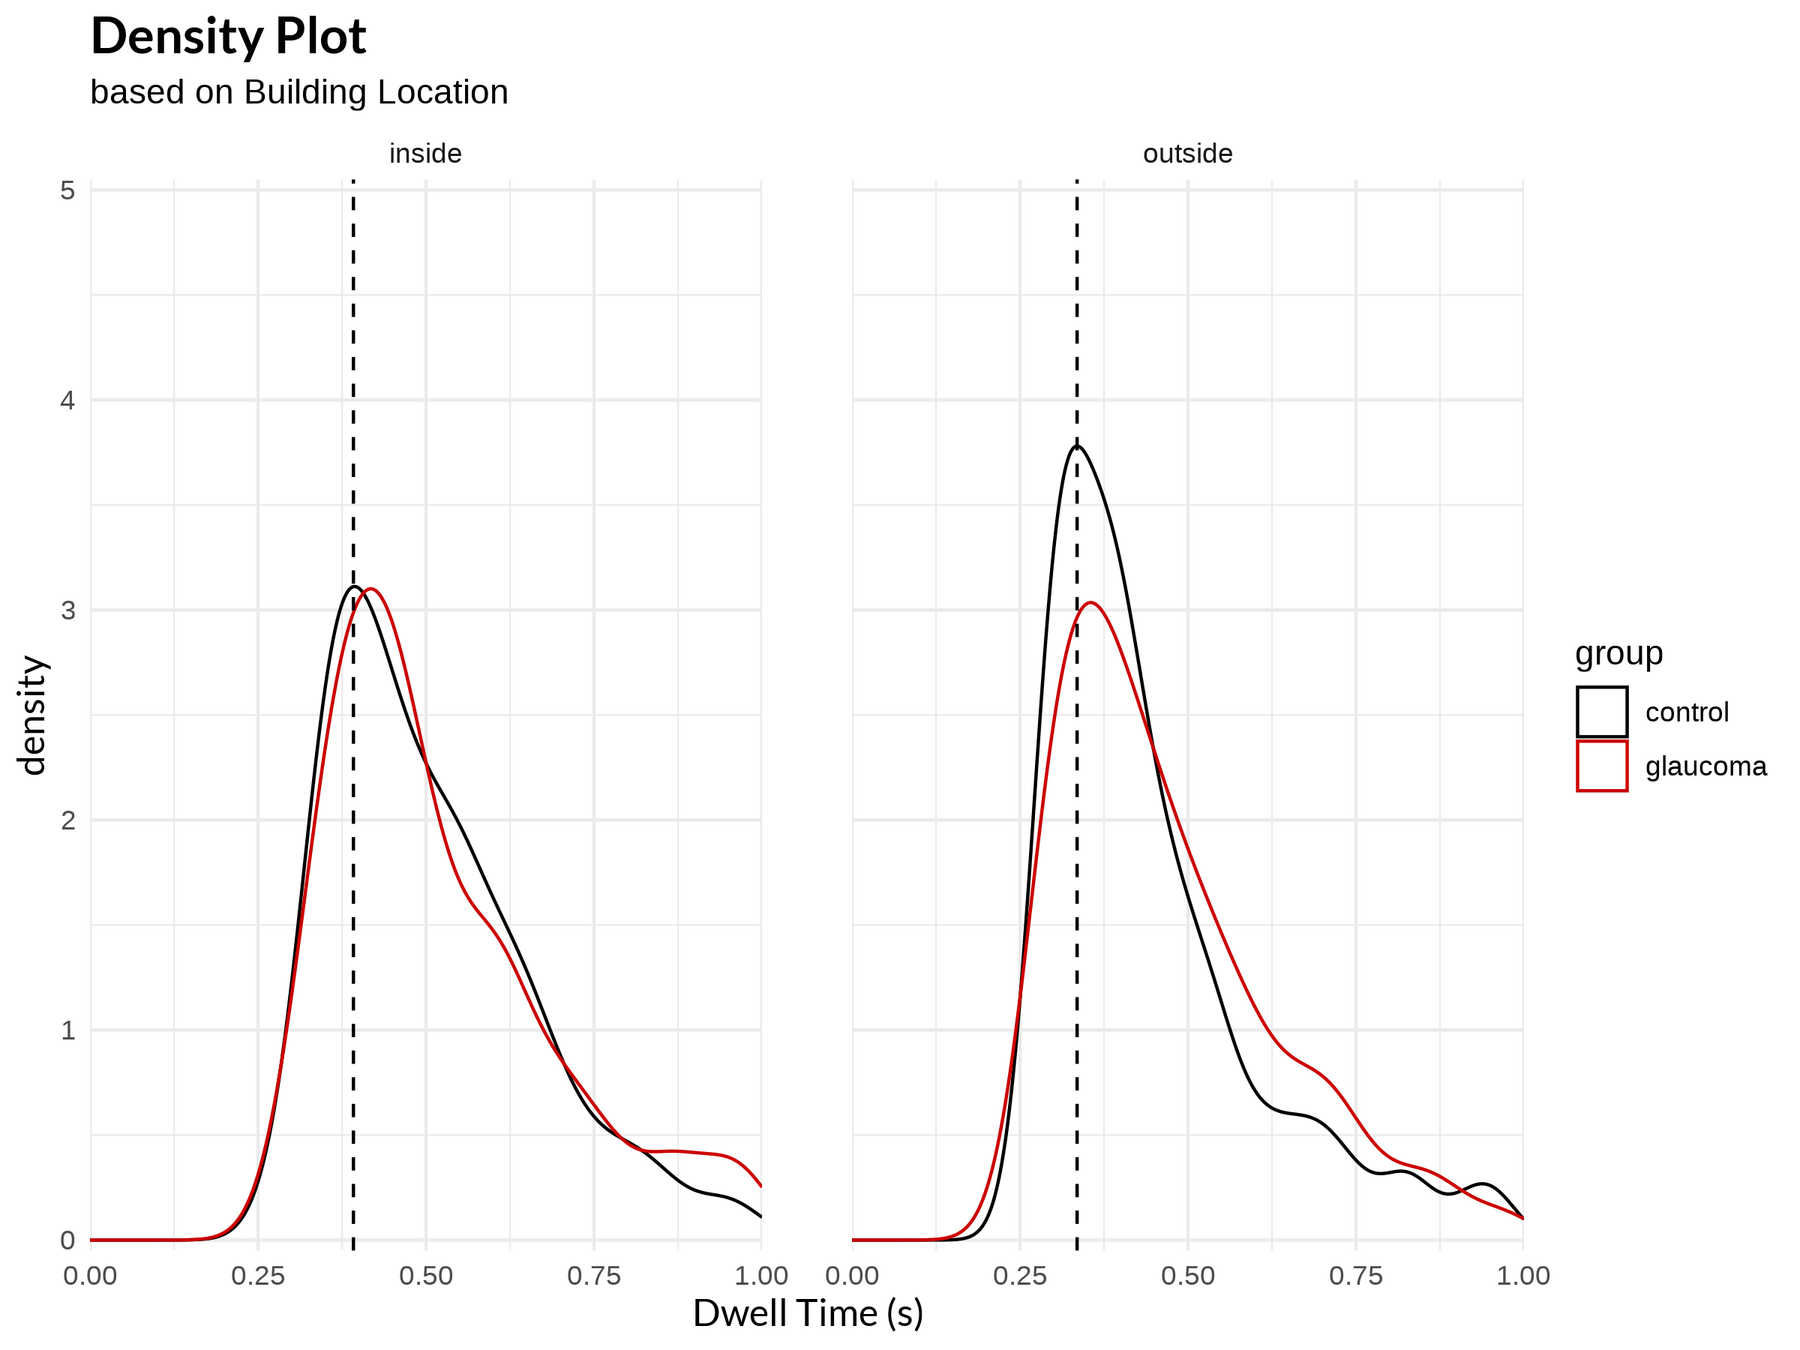
Dwell Time Density Plot for Cross Factor (Group x Location)
Dwell Time(s)
SIMULATION FIGURES
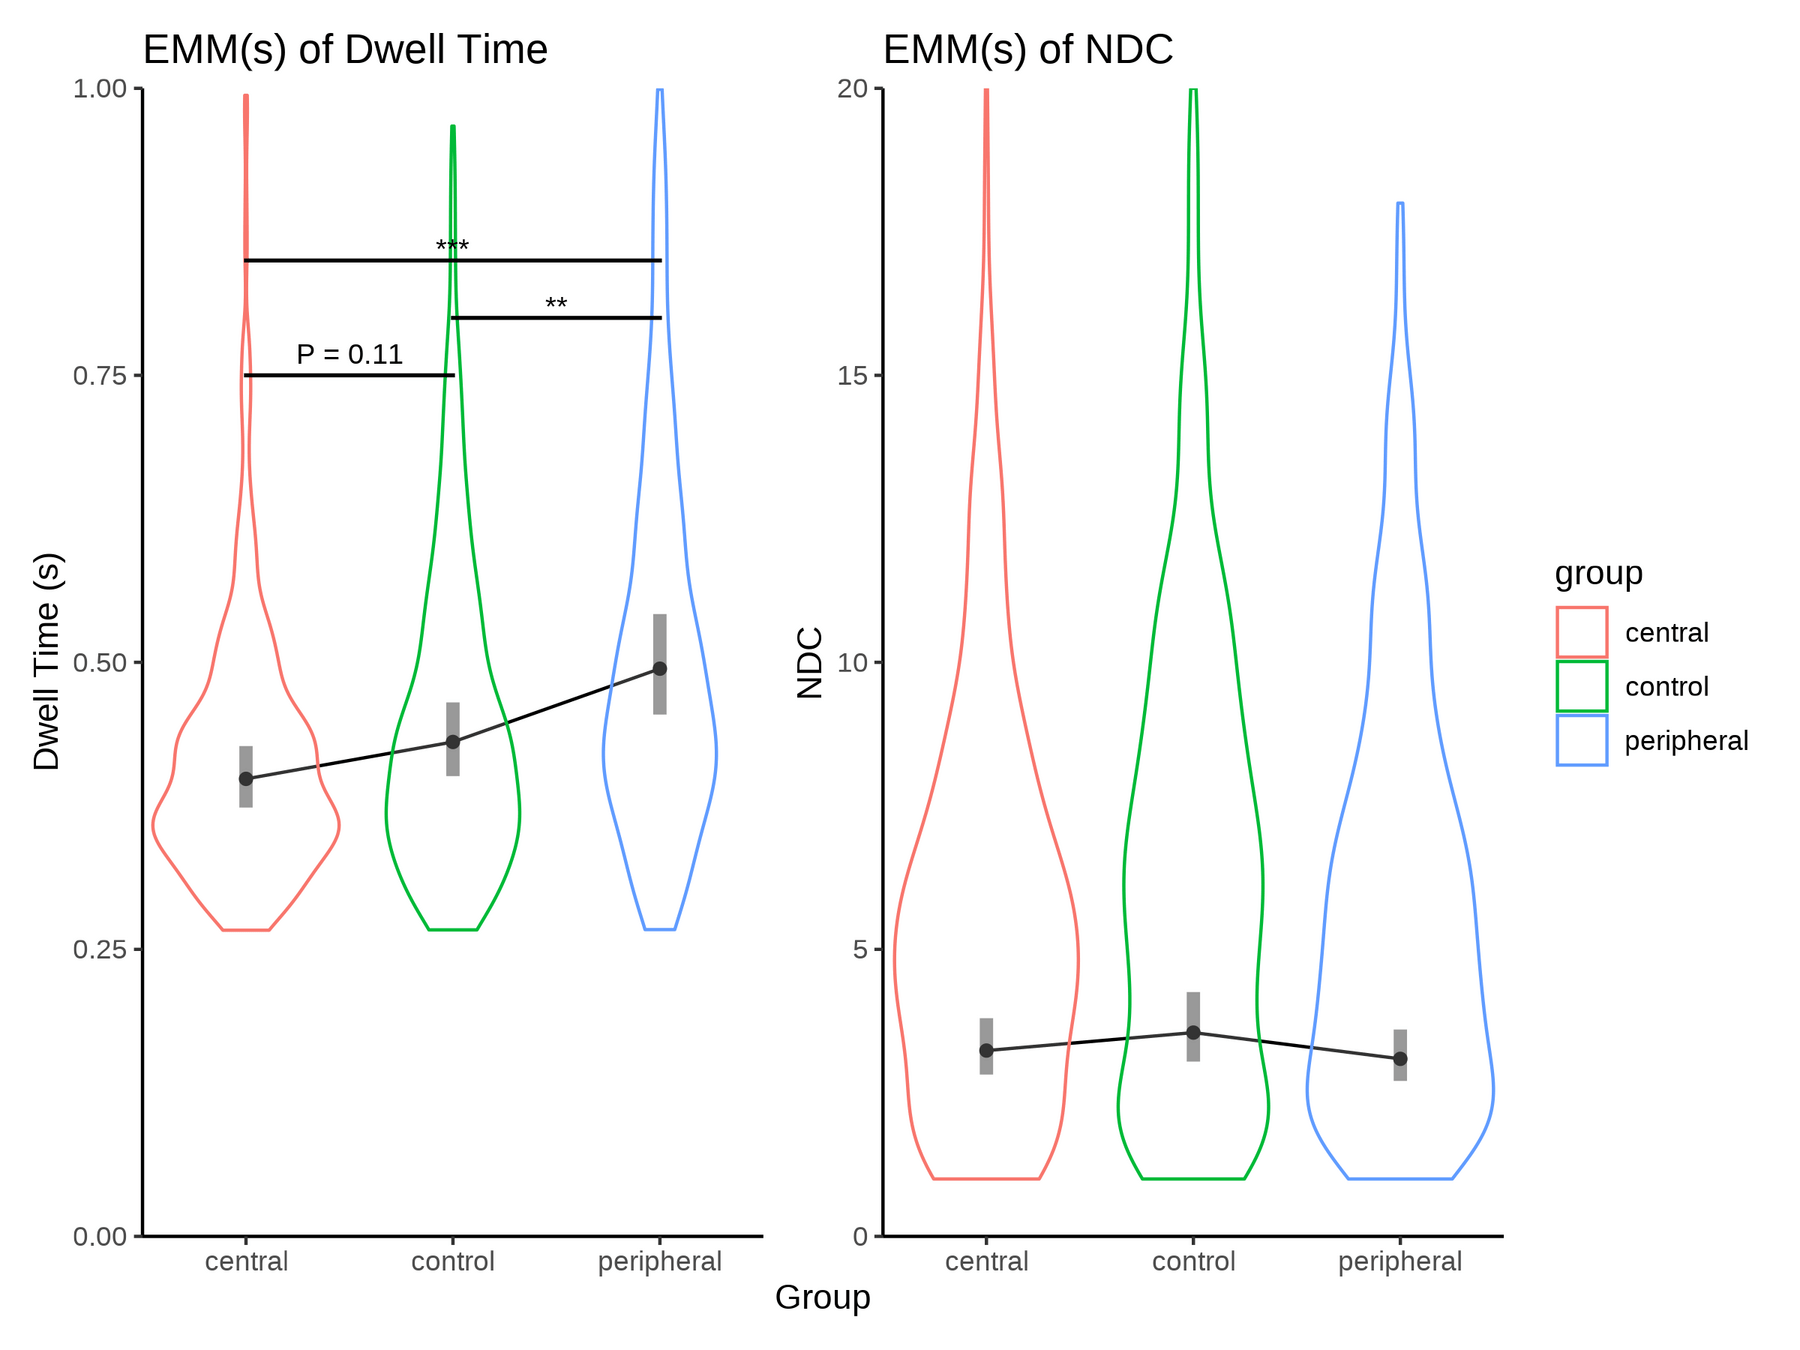
Peripheral group looks longer than other two*
No difference in the NDC
SIMULATION FIGURES
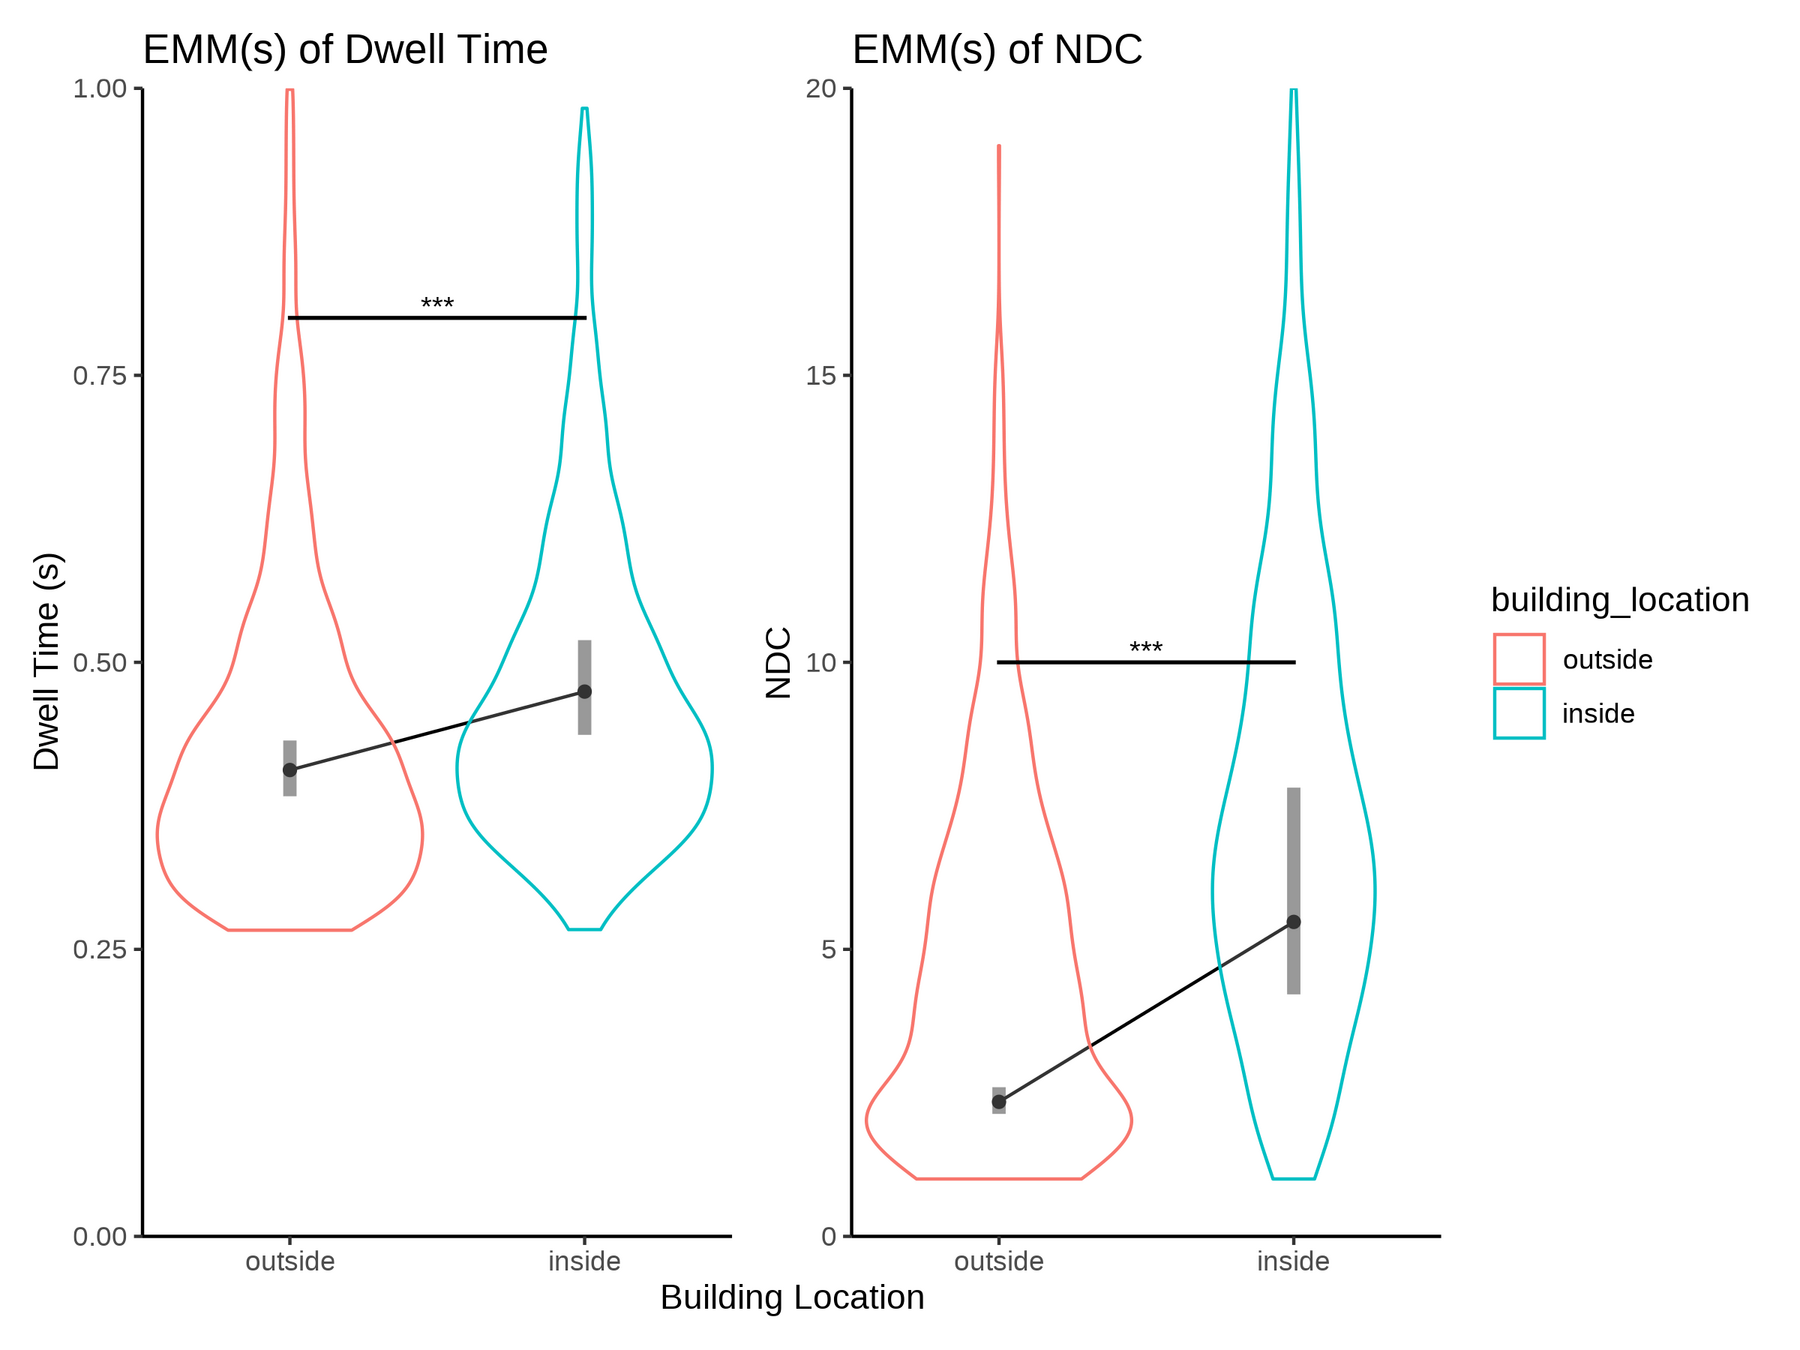
People look at buildings inside longer. (confound?)
Inside buildings end up having more connections. (confound?)
SIMULATION FIGURES
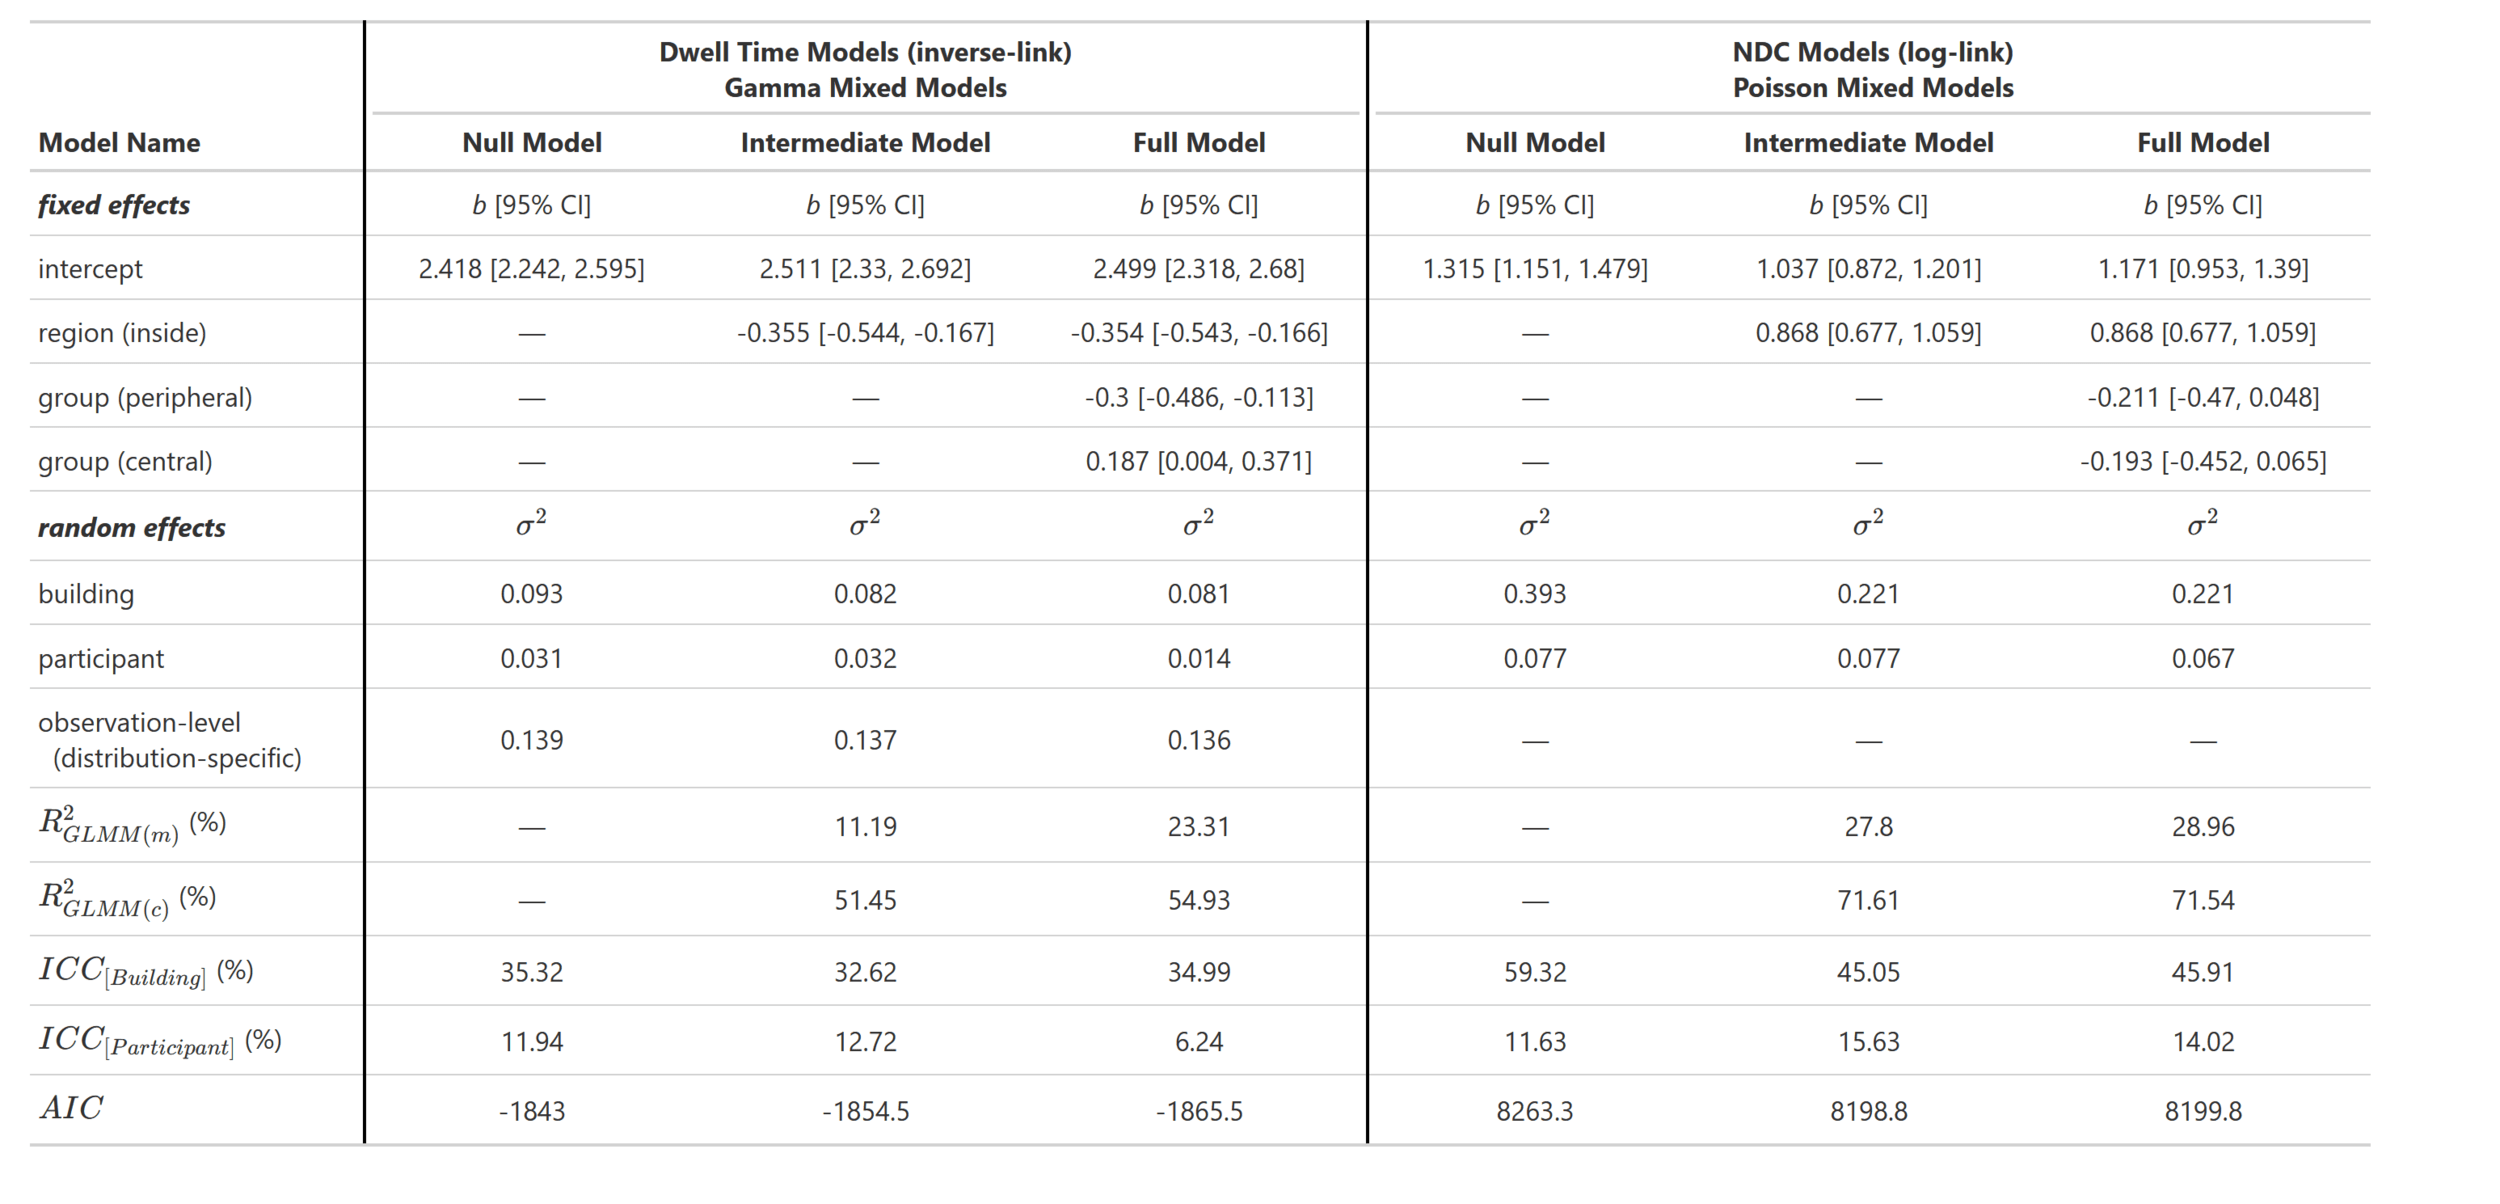
Models Summary Table
GLAUCOMA FIGURES
Dwell Time
GLAUCOMA FIGURES
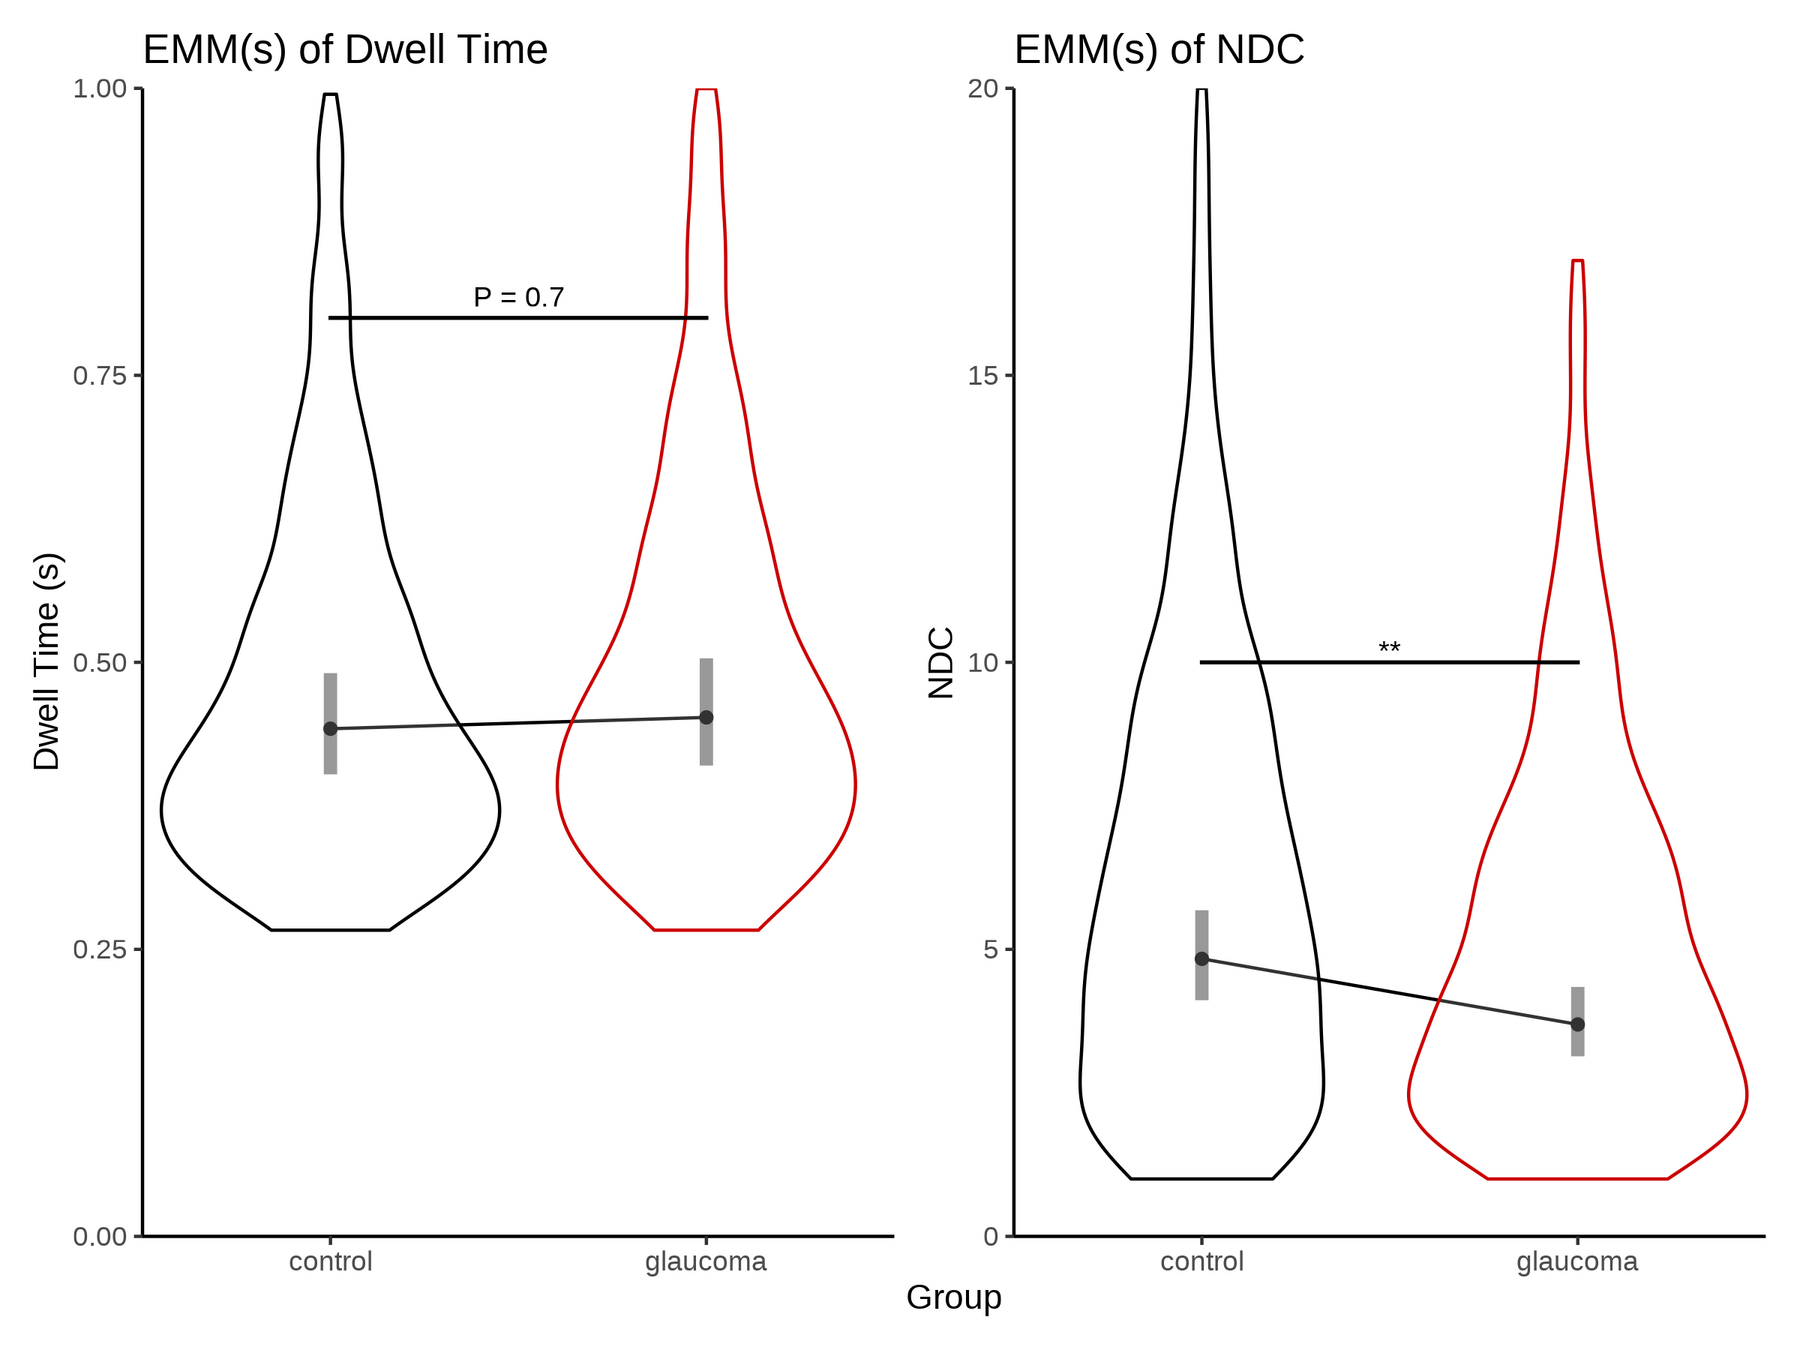
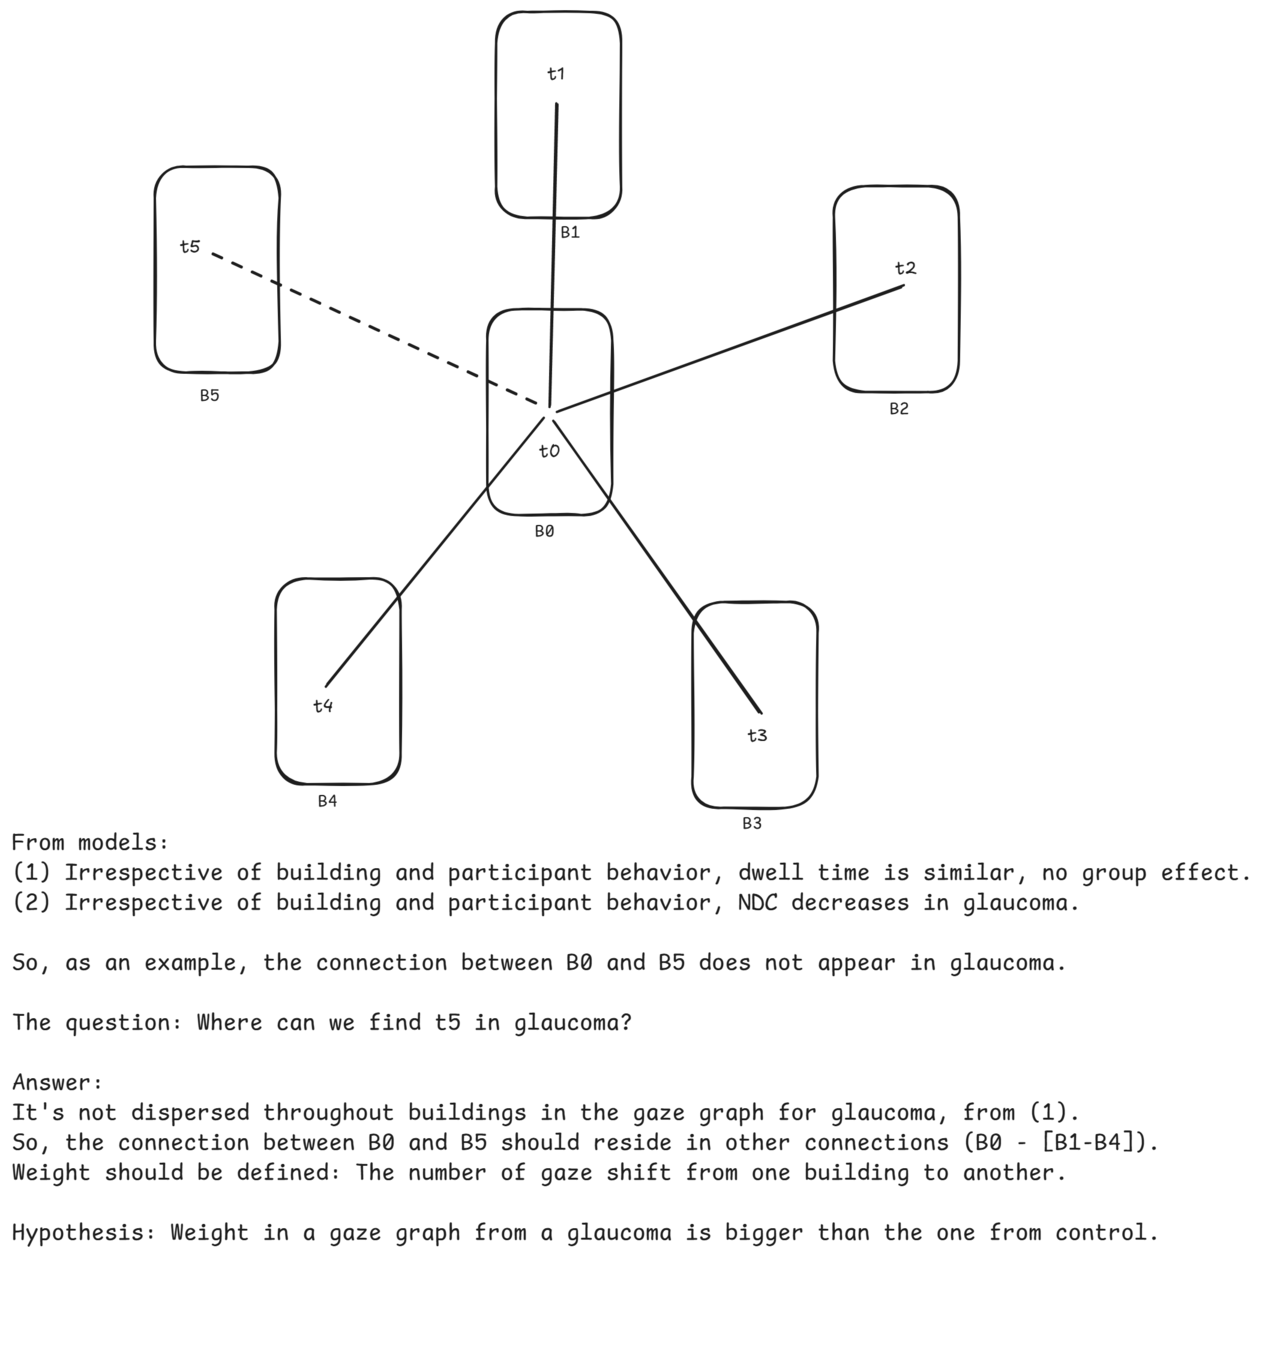
The time to look at one building is similar
Gaze shift from one building to another decreases*
GLAUCOMA FIGURES
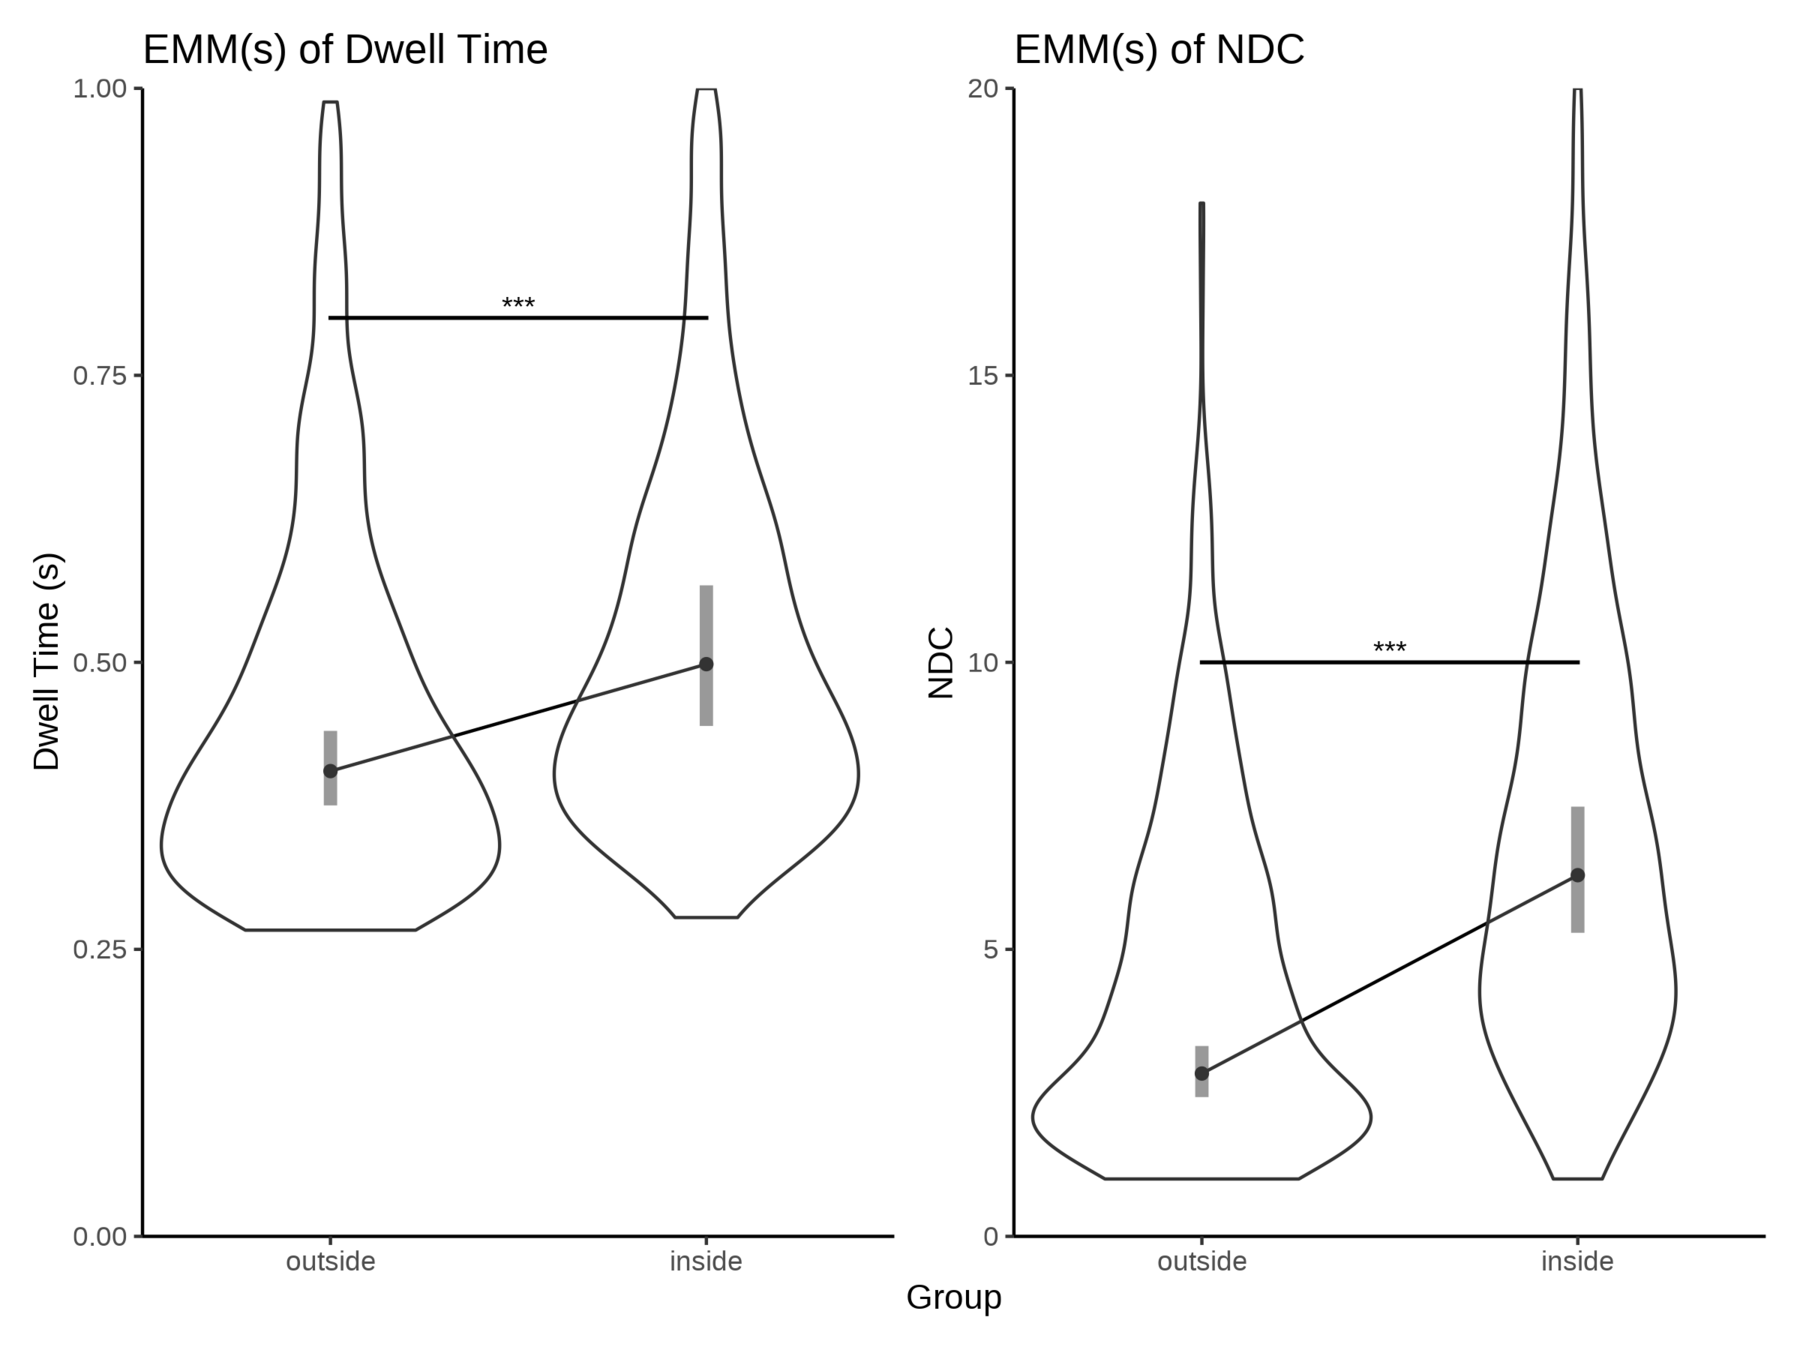
People look at buildings inside longer. (confound?)
Inside buildings end up having more connections. (confound?)
GLAUCOMA FIGURES (WIP)
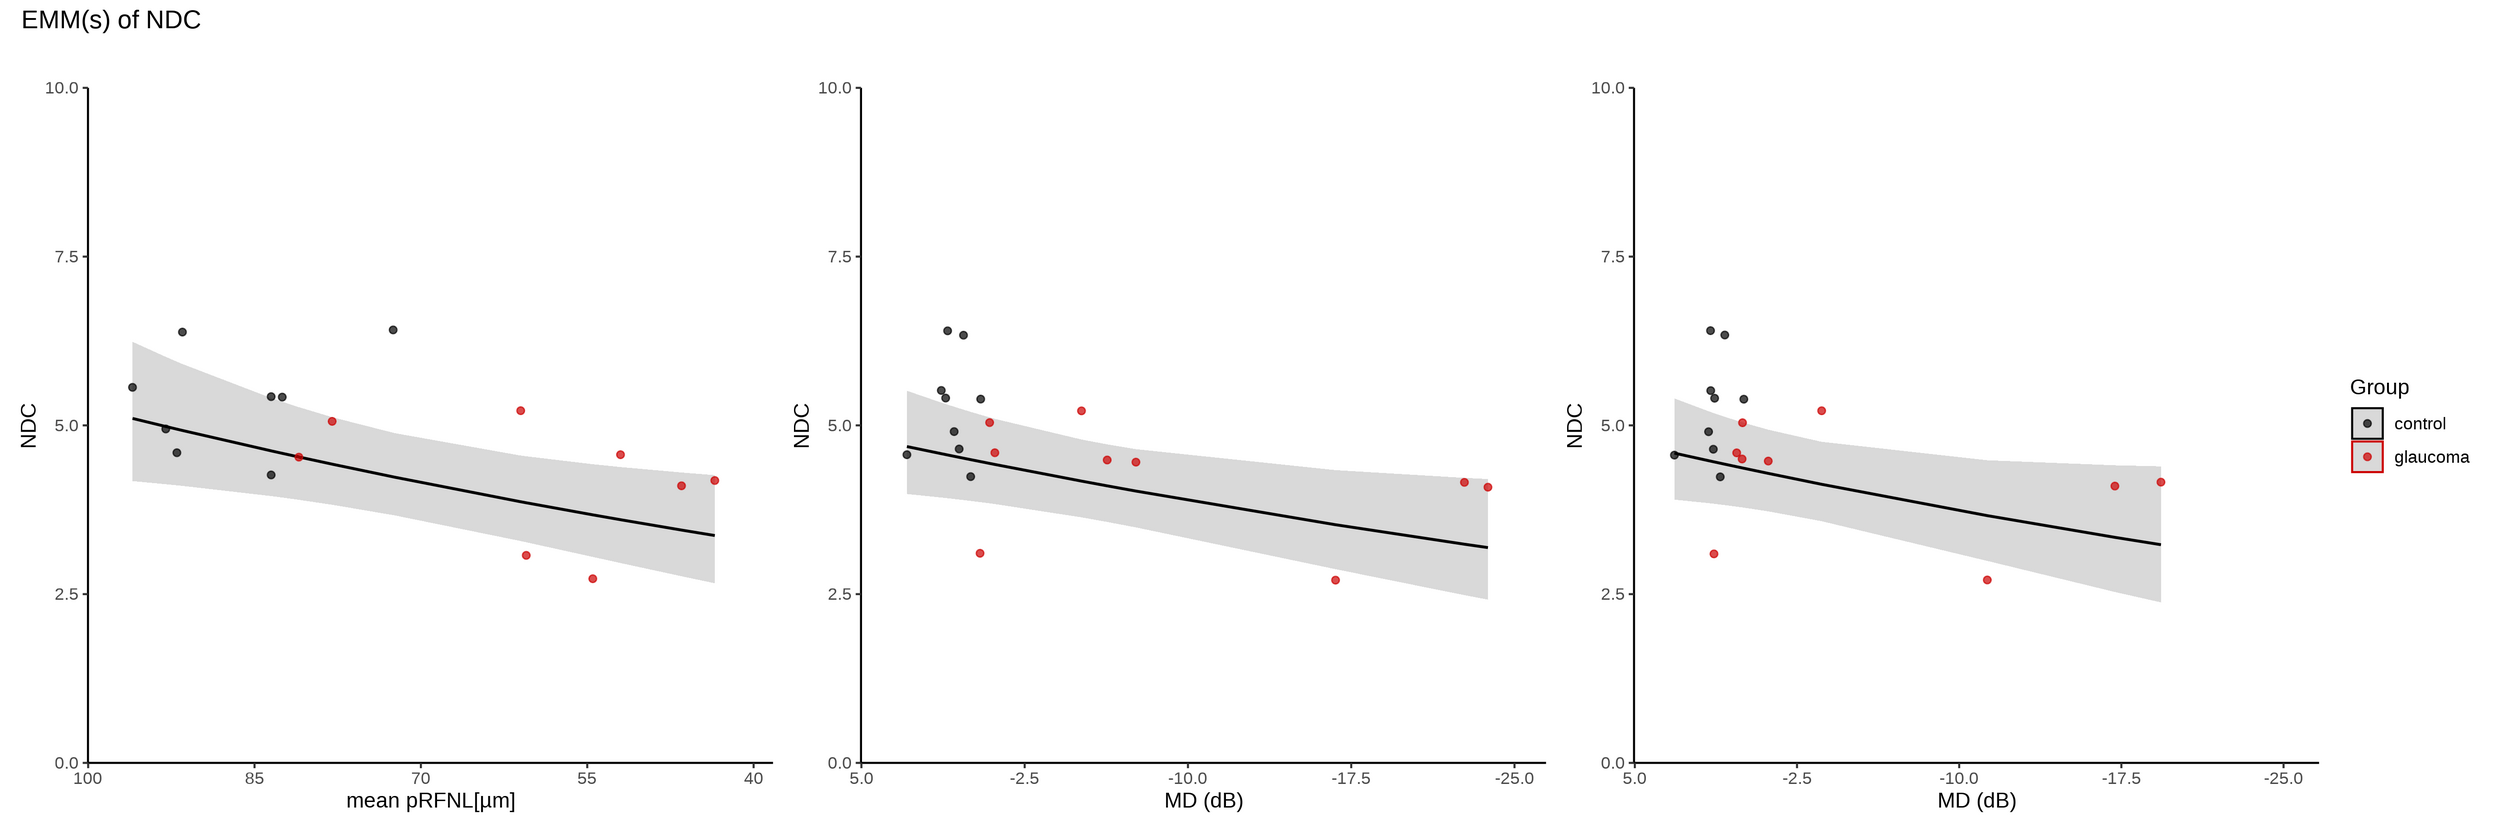
Relationship between visual function and NDC
worst
best
Relation found in NDC with retinal thickness and visual field defect*
GLAUCOMA SUP FIGURES
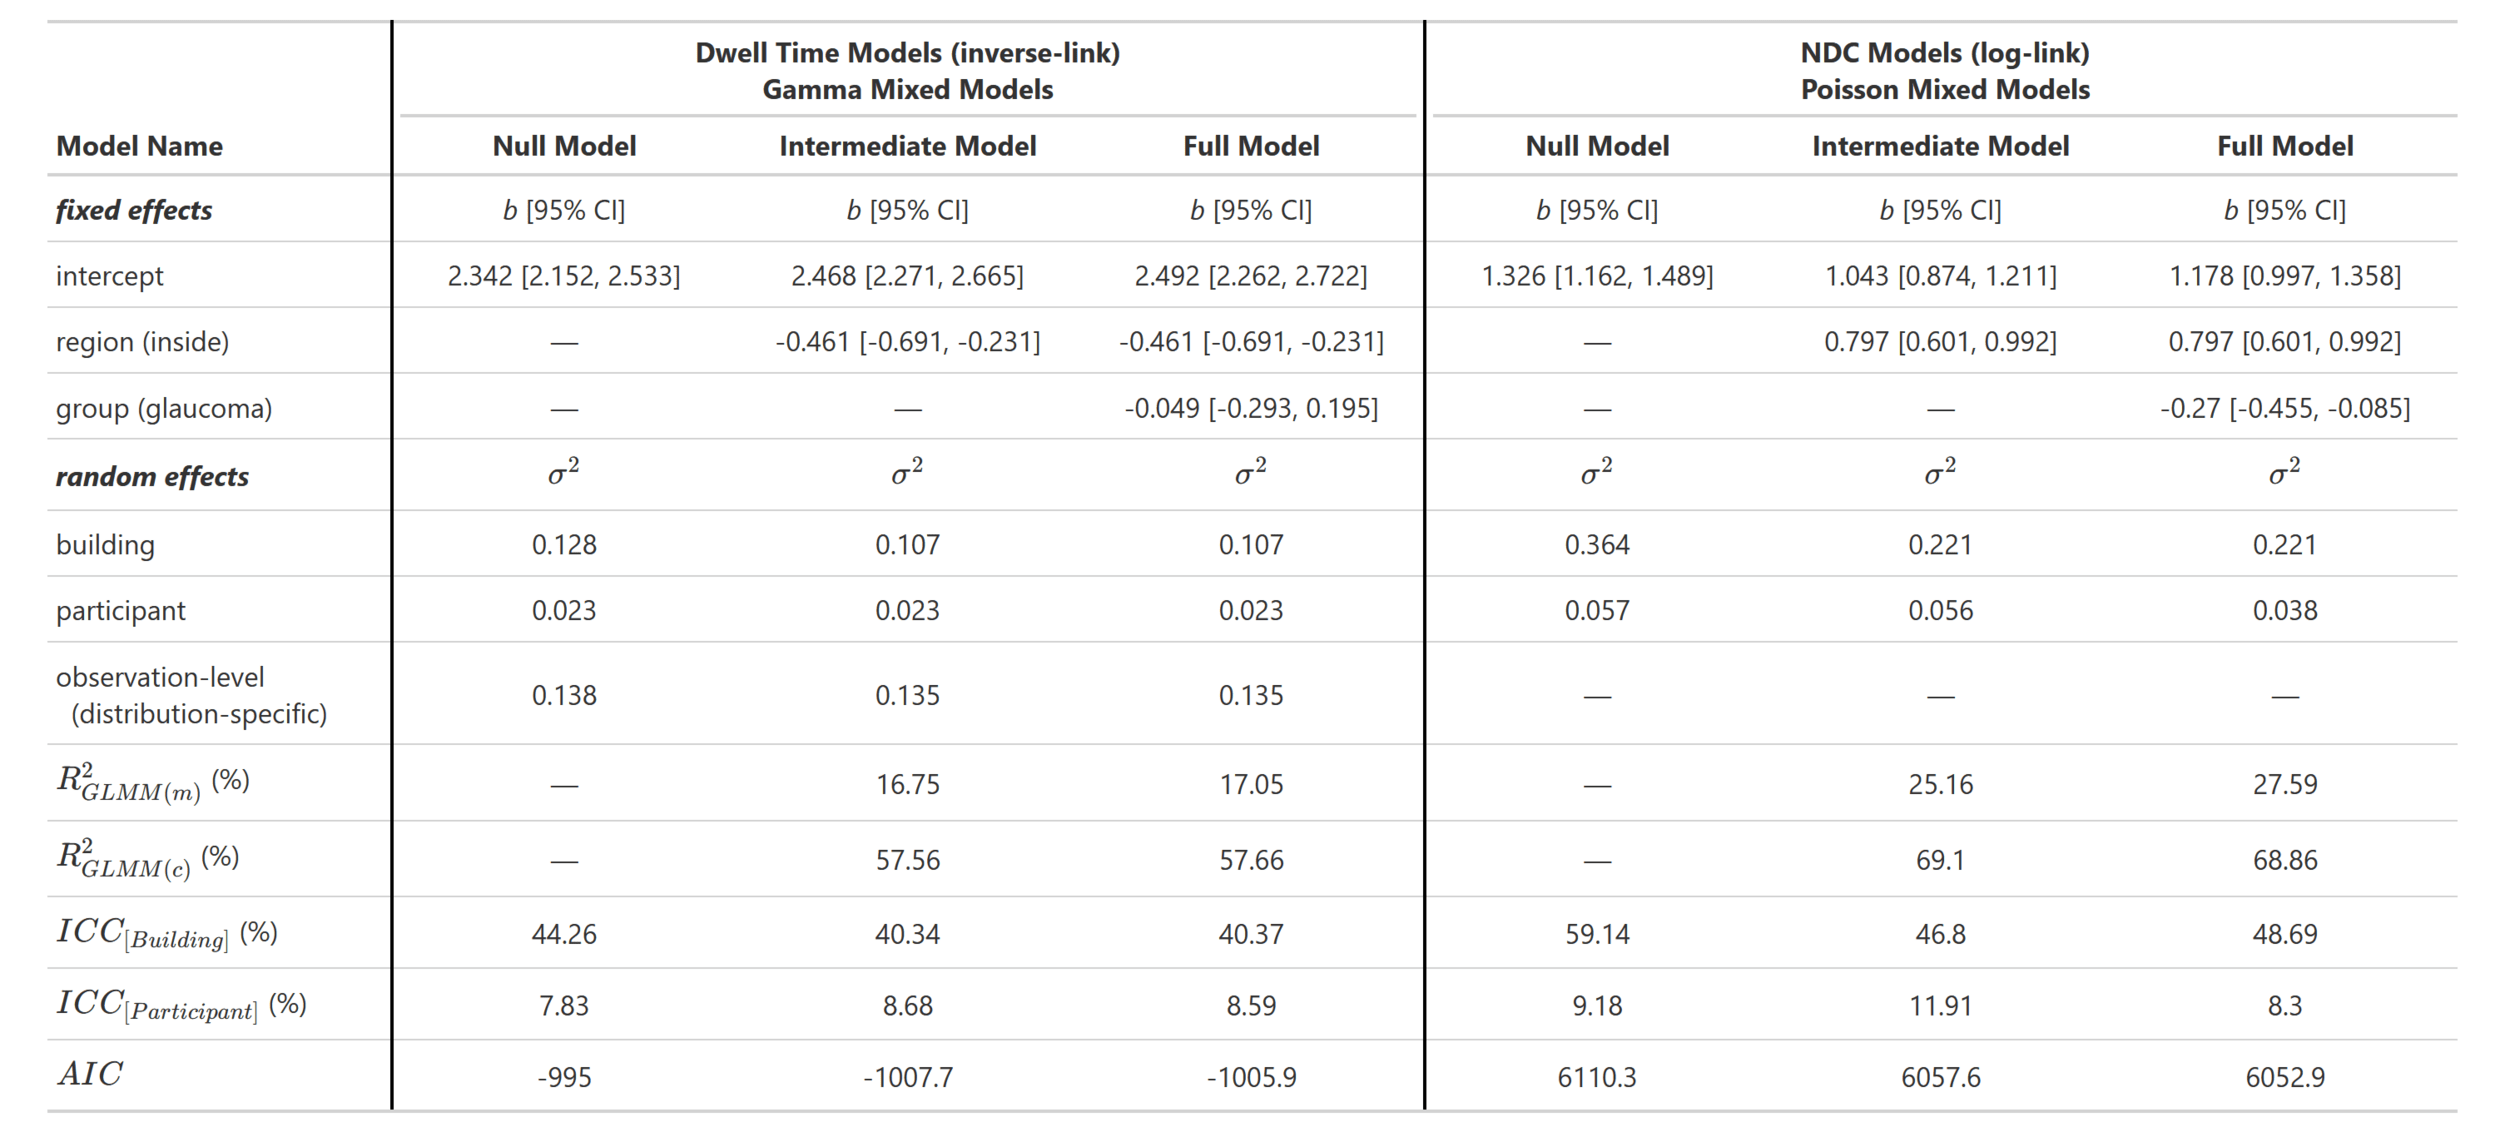
Models Summary Table
GLAUCOMA SUP FIGURES (WIP)
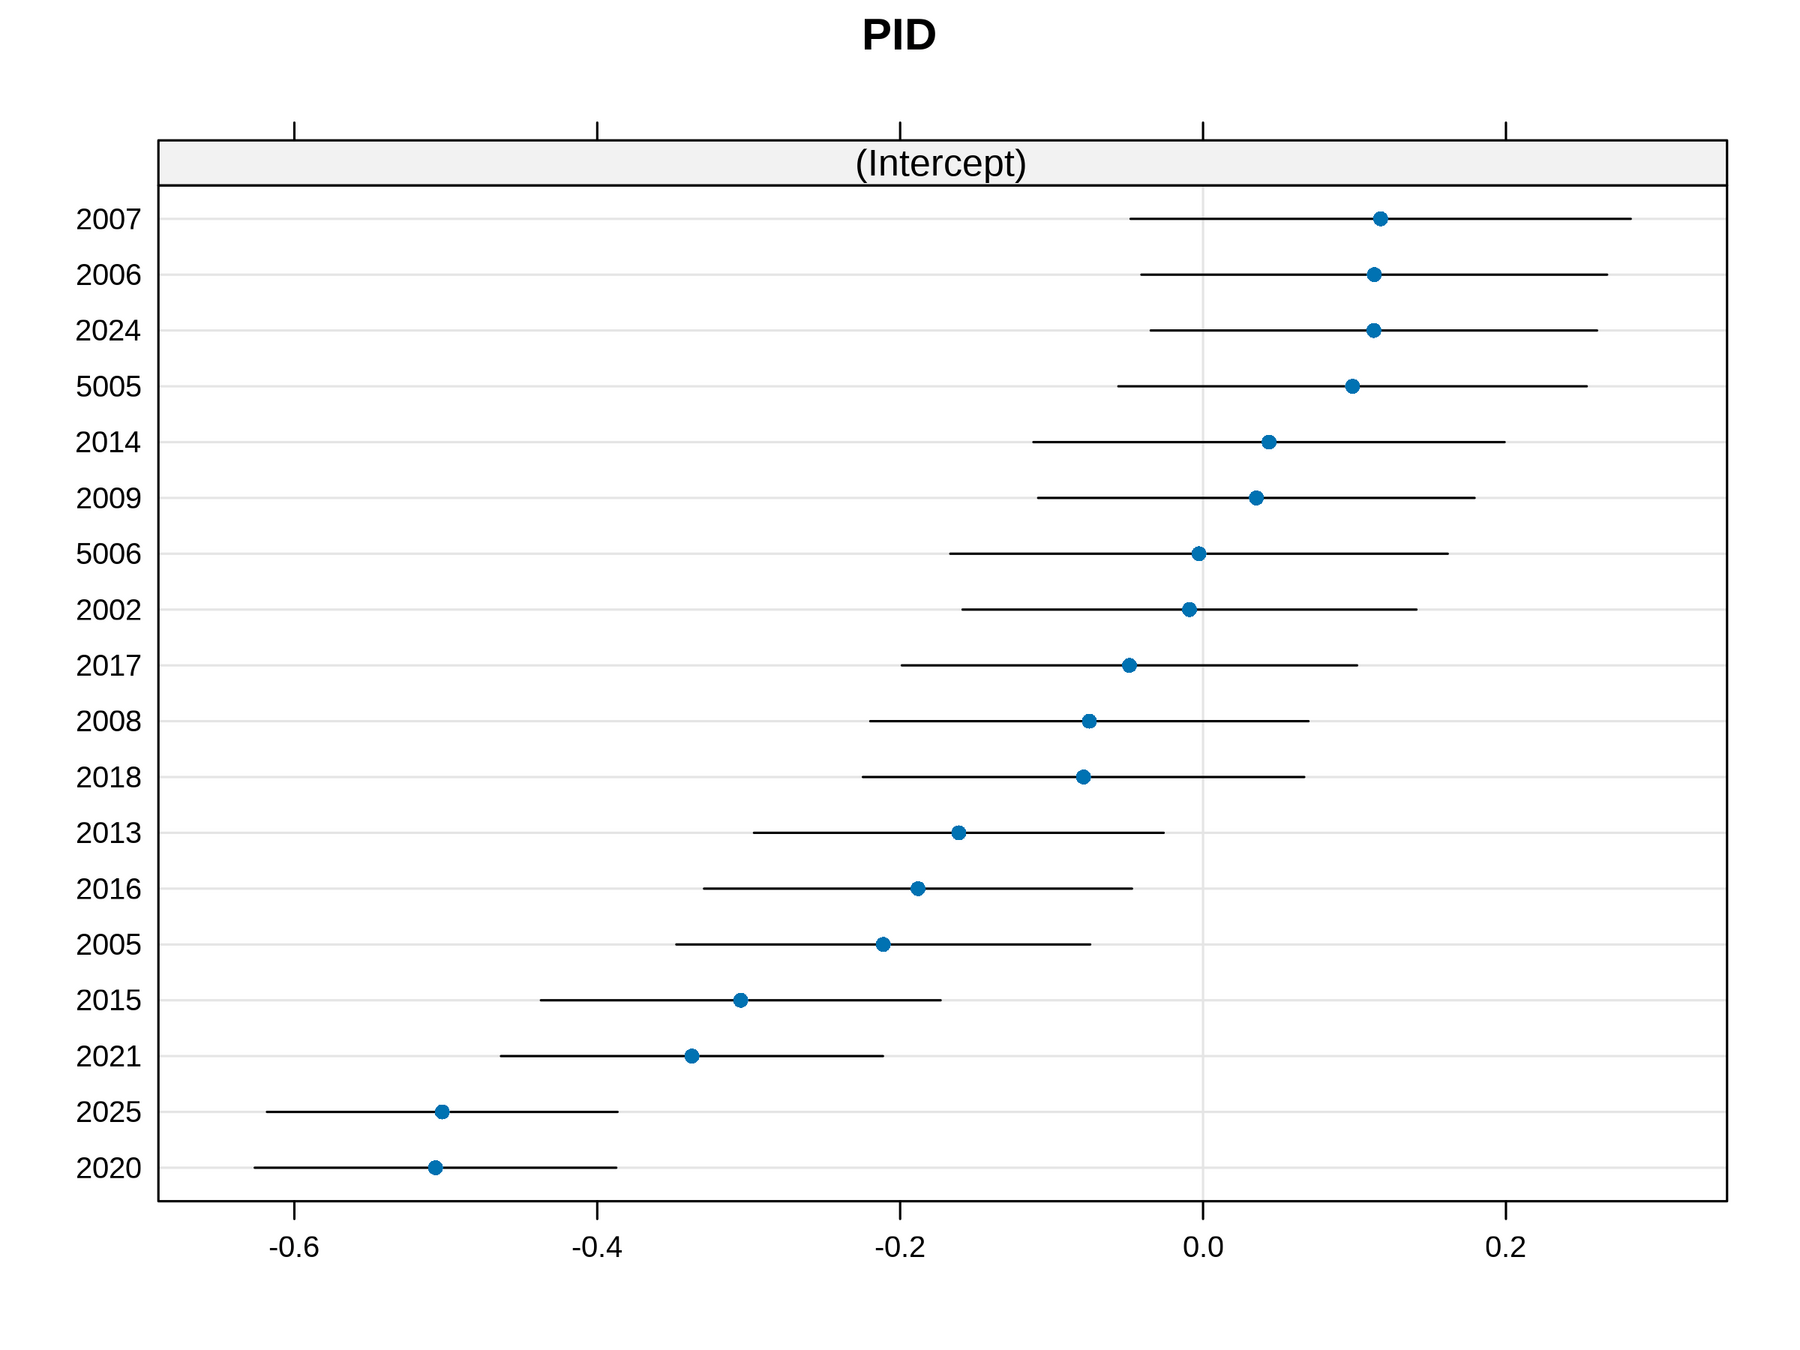
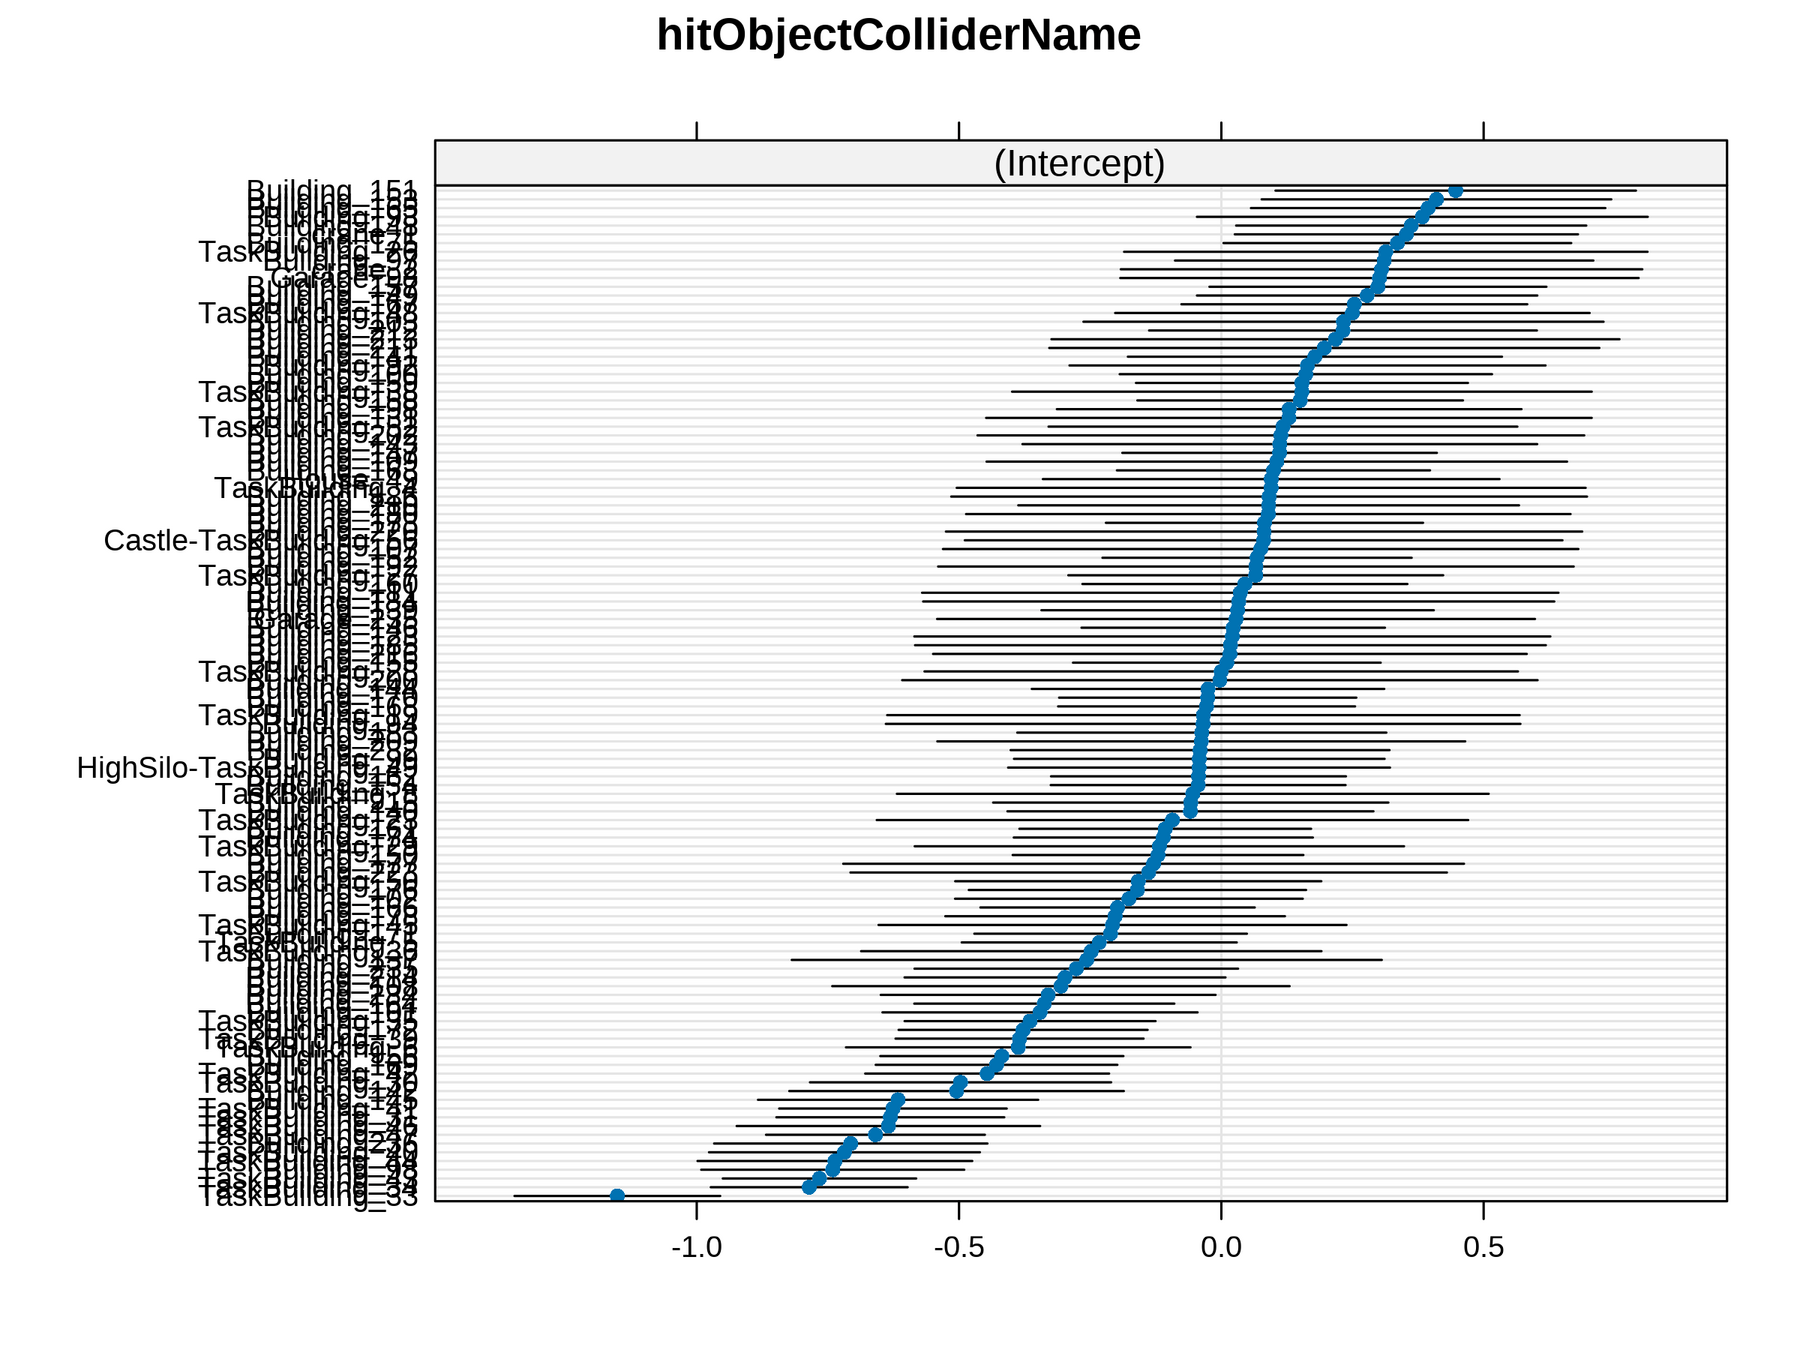
Random Intercept distribution for participants and buildings for dwell time
Not normally distributed*
QUESTIONS?