WESTBRÜCK SIMULATION + GLAUCOMA
NAVIGATION STUDY
ANALYSIS
A Collaboration Project
Osnabrück Uni - OVGU
Safa Andac
Prof. Peter König
Prof. Michael Hoffmann
Outline
PARADIGM
RECRUITMENT
| Group | Recruited | Excluded |
|---|---|---|
| Control | 11 | 2 CS* + 1 Other** |
| Peripheral | 8 | 0 |
| Central | 9 | 1 CS* |
* : Cybersickness
** : Escaped
- Only one men (?) participated
- No female participant in central group.
Age Range : 18-30 years
HYPOTHESES
- Participants with peripheral scotoma less interaction among buildings (GROUP)
- Short fixation time in central and peripheral (GROUP)
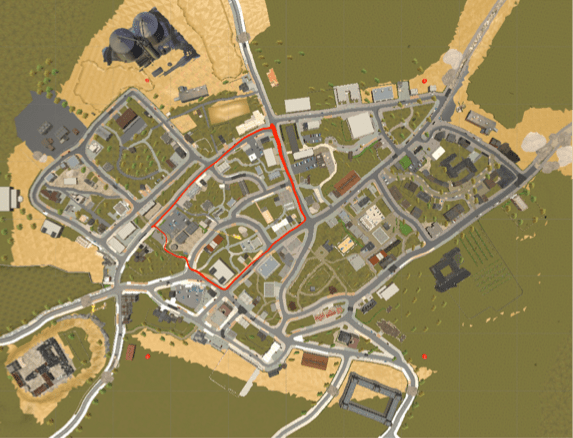
- An effect of restricted area (REGION)
GROUP : control - peripheral - central
REGION : inside - outside
DATA TABLE lAYOUT
| Participant ID | Building ID | Fixation (s) |
|---|---|---|
| 4001 | Building_01 | 0.4 |
| 4001 | Building_04 | 0.5 |
| 4001 | Building_01 | 0.7 |
| ... | ... | ... |
| 4004 | Building_01 | 0.8 |
| 4004 | Building_12 | 0.9 |
| ... | ... | ... |
- Order matters for graph
- <Participant, Building> pairs -- multiple fixations-- not unique!
ANALYSIS
NDC Mean (Seen Buildings)
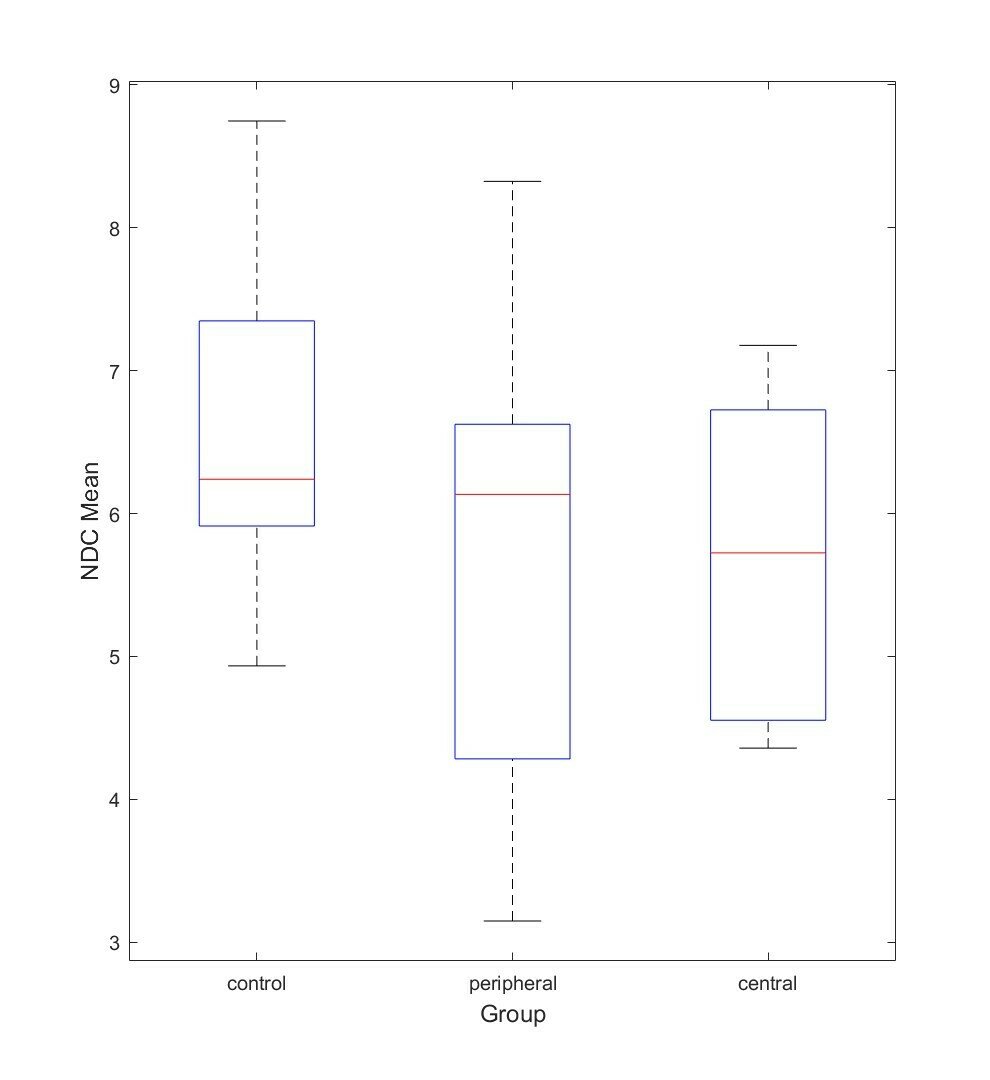
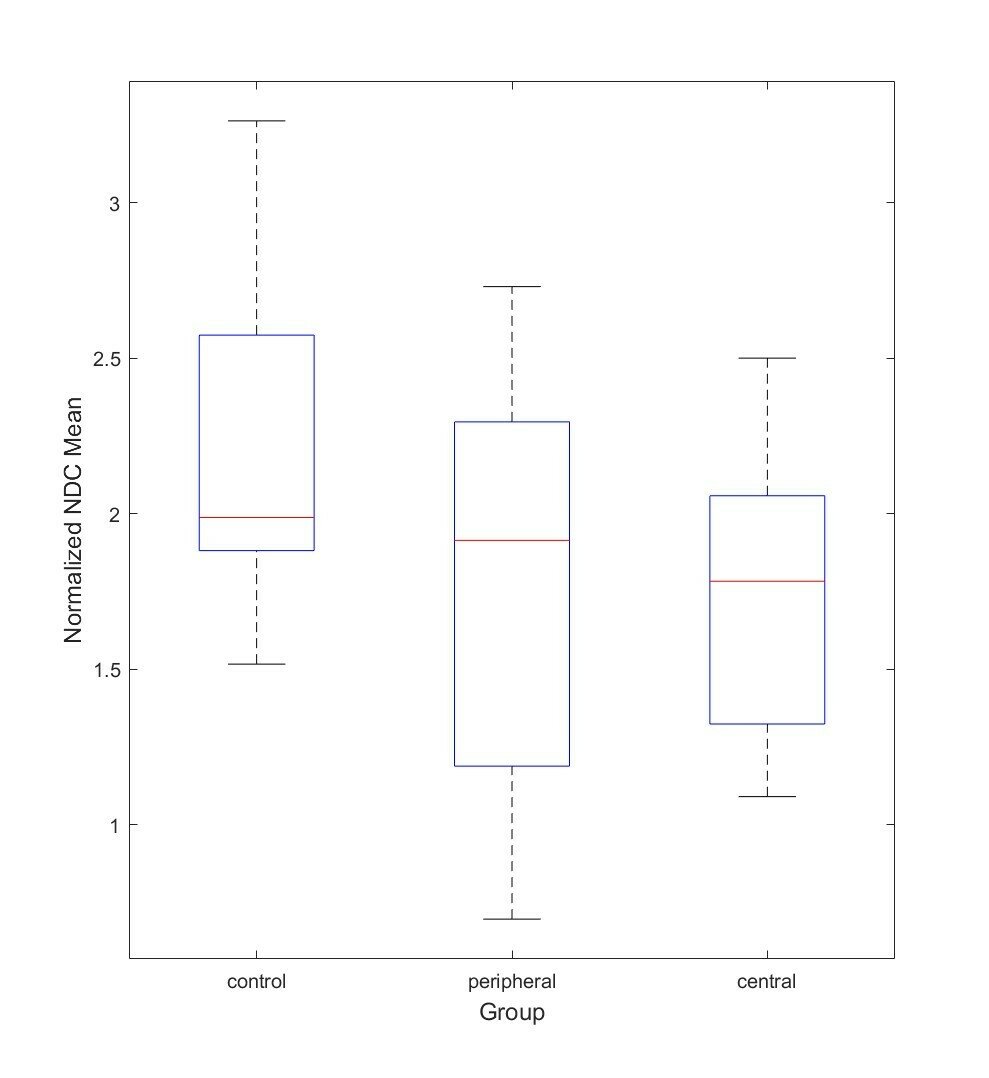
NDC Mean (All Buildings)
F(2, 21) = 1.12, p = 0.34
F(2, 21) = 1.53, p = 0.24
No difference overall
ANALYSIS
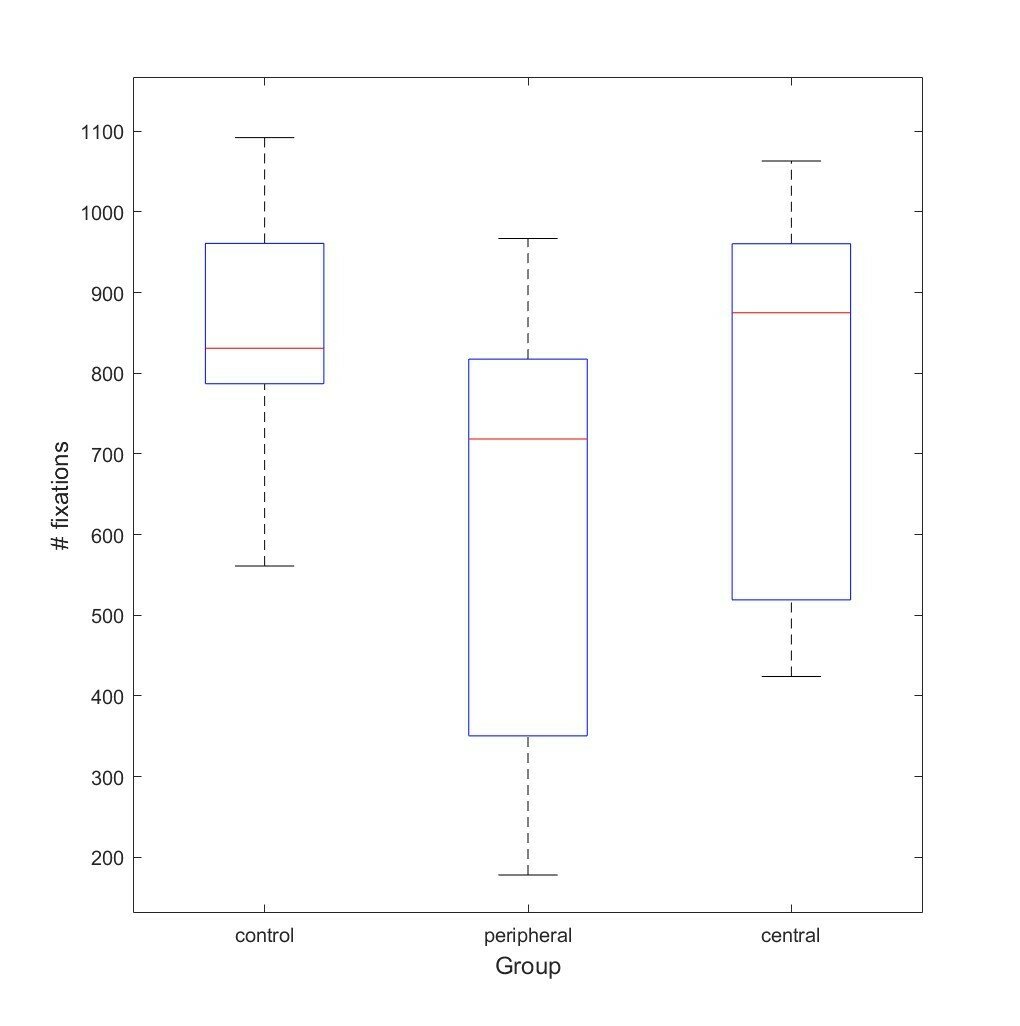
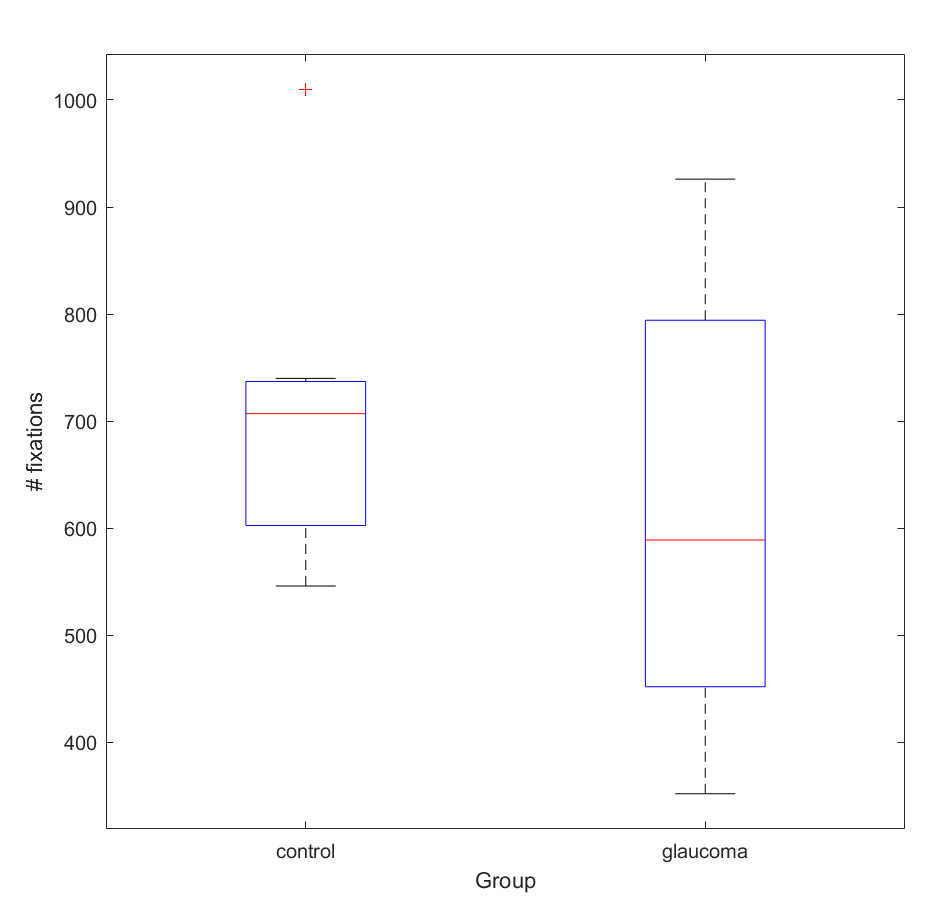
Number of Fixations
F(2, 21) = 2.08, p = 0.15
No difference overall
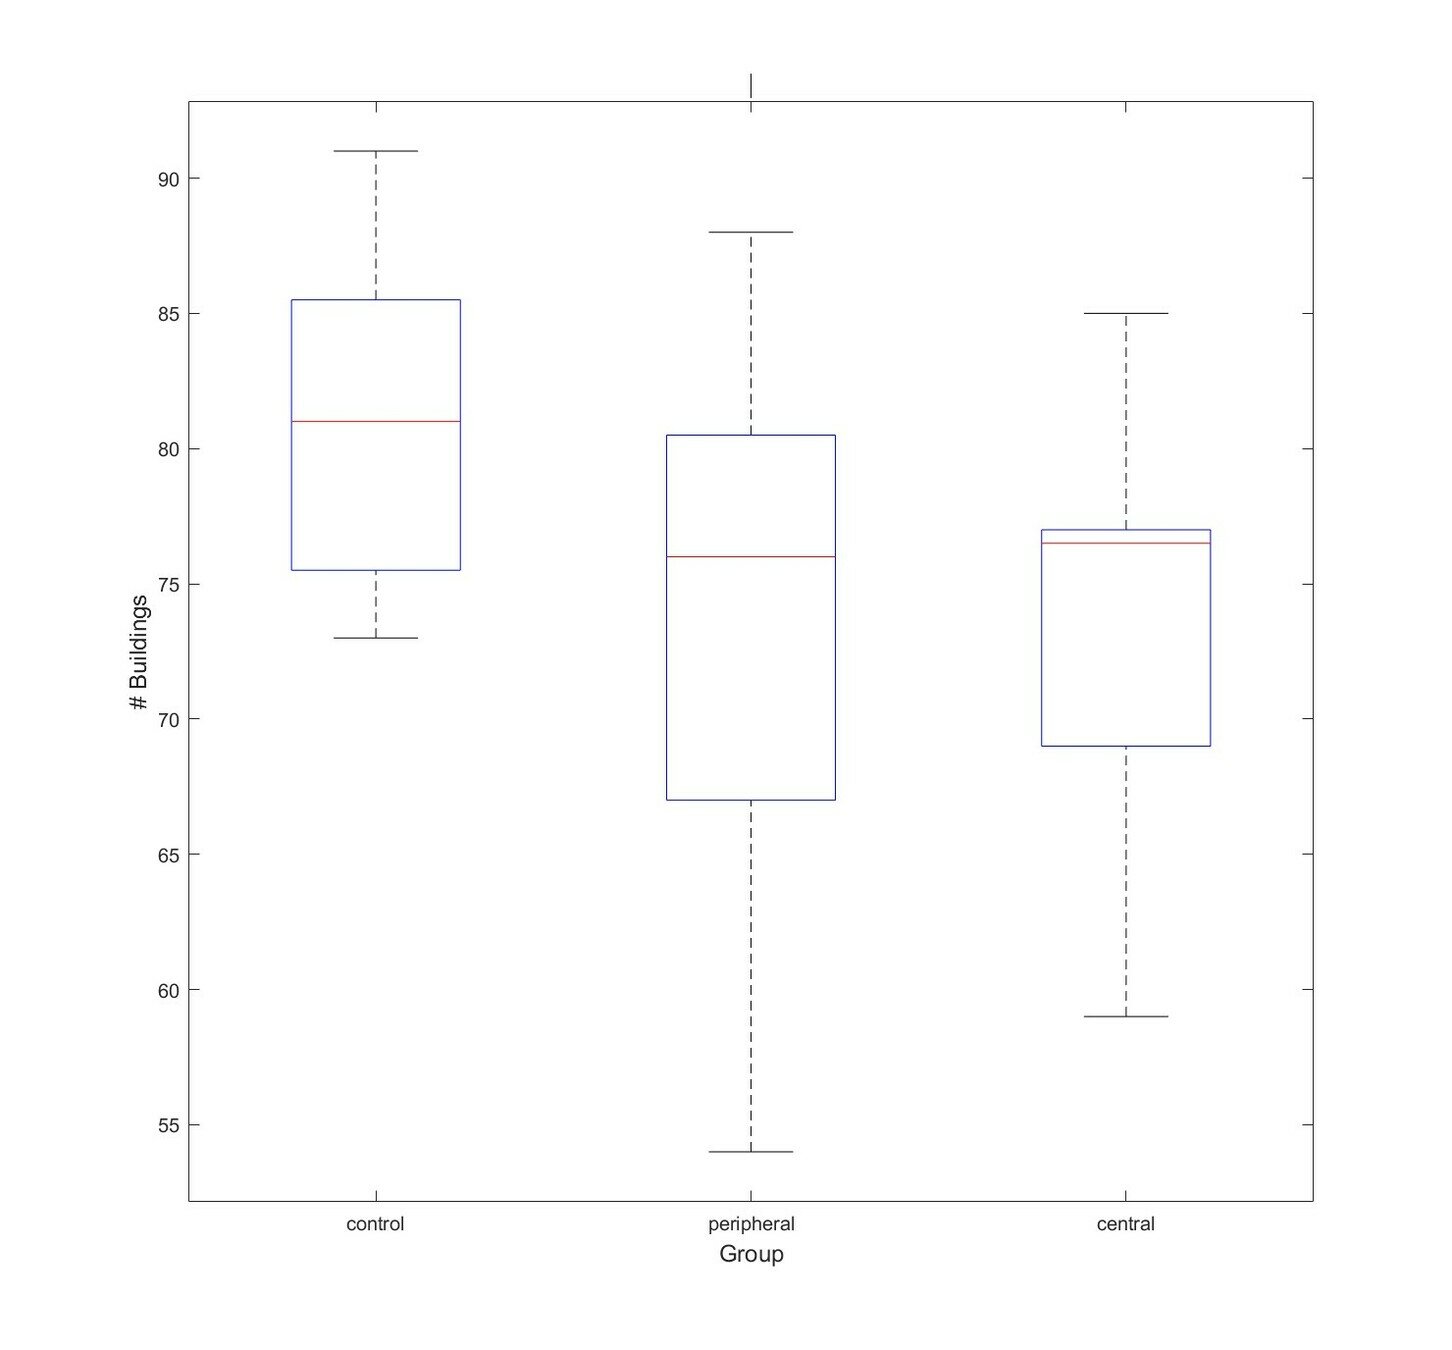
Number of Unique Buildings
F(2, 21) = 1.96, p = 0.16


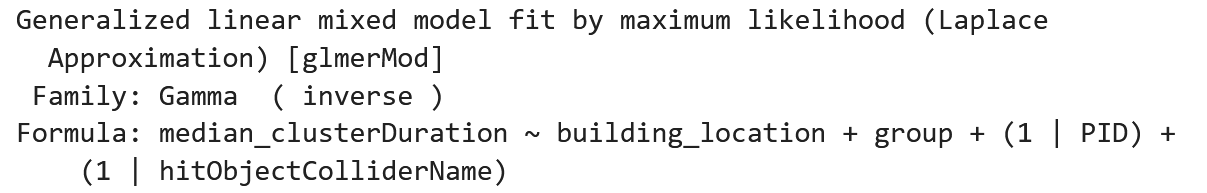
Dwell Time (s)
Dwell Time (s)
pdf(t)
pdf(t)
Probability Density Function (group x area)
Probability Density Function (group x area)
ANALYSIS
Dwell Time (s)
Dwell Time (s)
pdf(t)
pdf(t)
Probability Density Function (group x area)
Probability Density Function (group x area)
ANALYSIS

Dwell Time (s)
Dwell Time (s)
pdf(t)
pdf(t)
Probability Density Function (group x area)
Probability Density Function (group x area)
ANALYSIS
Dwell Time (s)
Dwell Time (s)
pdf(t)
pdf(t)
Probability Density Function (group x area)
Probability Density Function (group x area)
ANALYSIS
ANALYSIS — GLAUCOMA
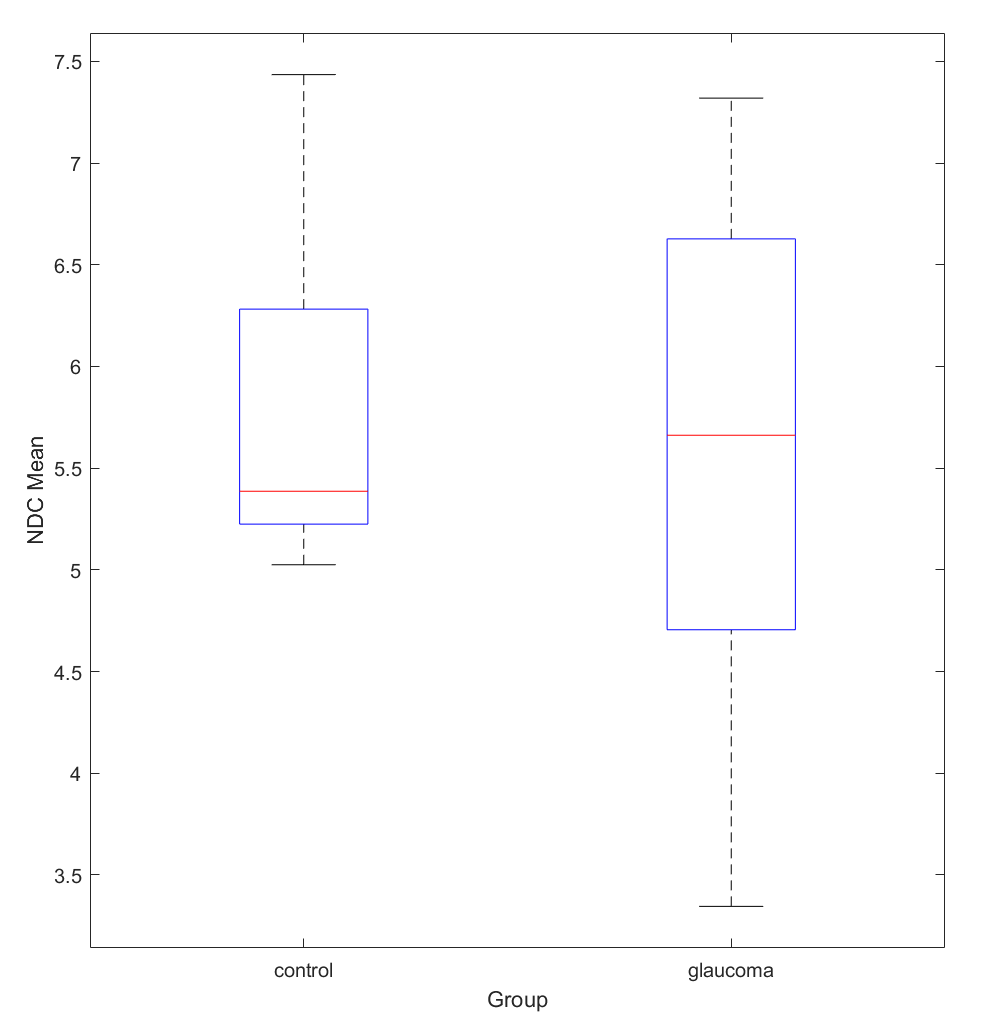
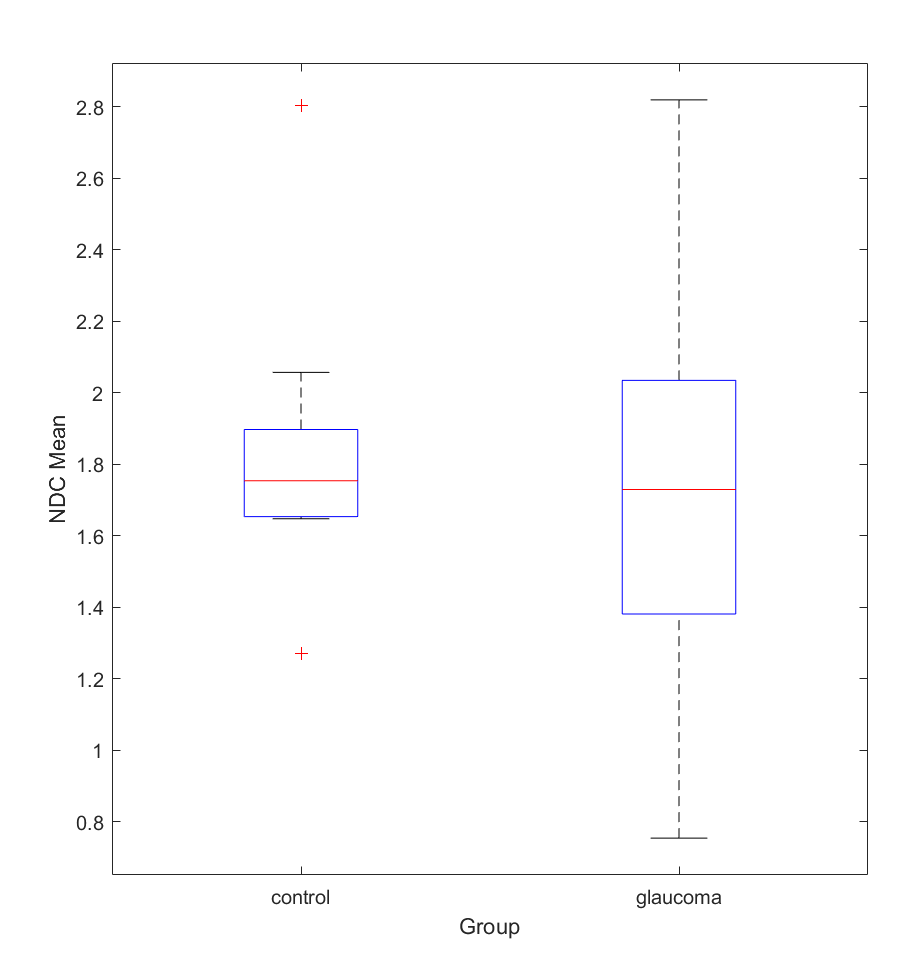
NDC Mean (Seen Buildings)
NDC Mean (All Buildings)
F(1, 16) = 0.23, p = 0.63
F(1, 16) = 0.18, p = 0.67
No difference overall
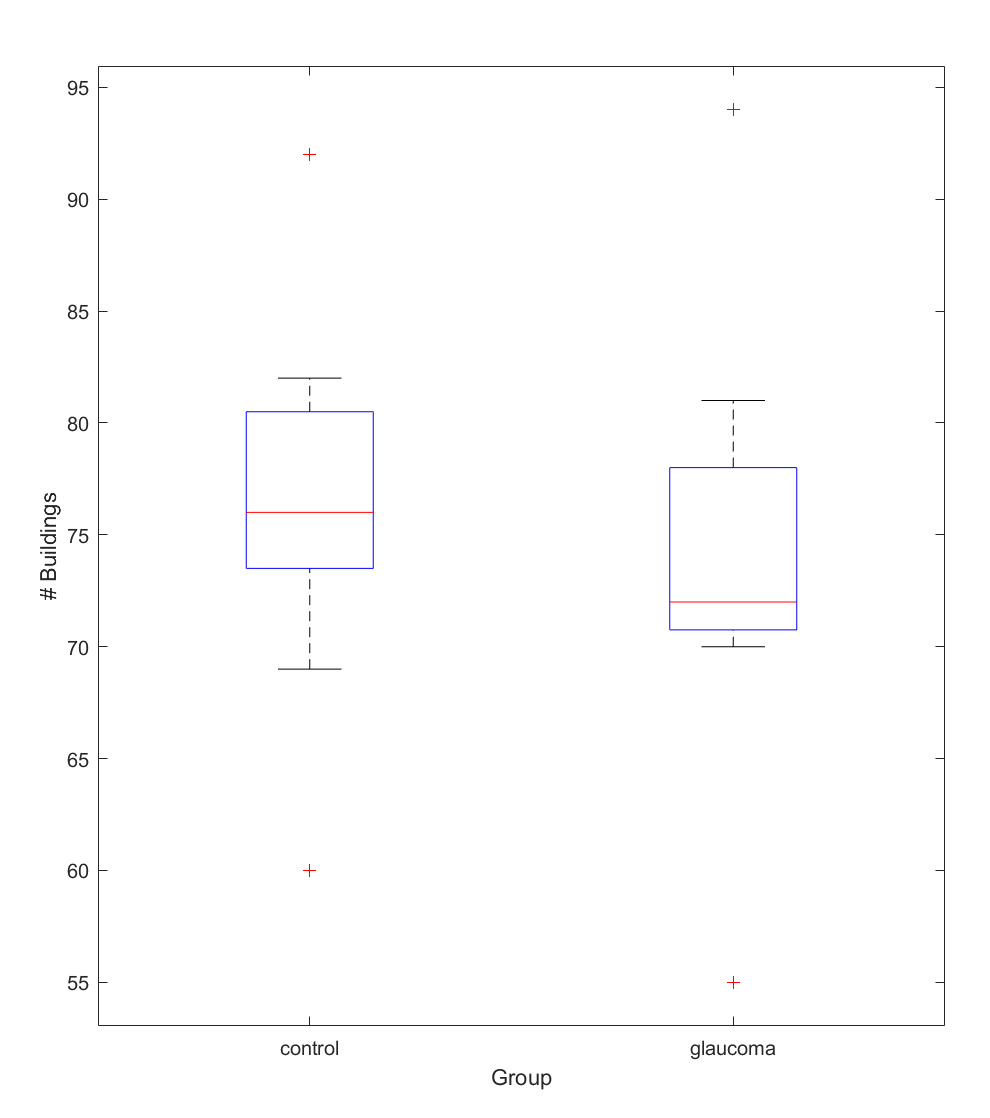
Number of Fixations
F(1, 16) = 0.69, p = 0.41
No difference overall
Number of Unique Buildings
F(1, 16) = 0.27, p = 0.61
ANALYSIS — GLAUCOMA
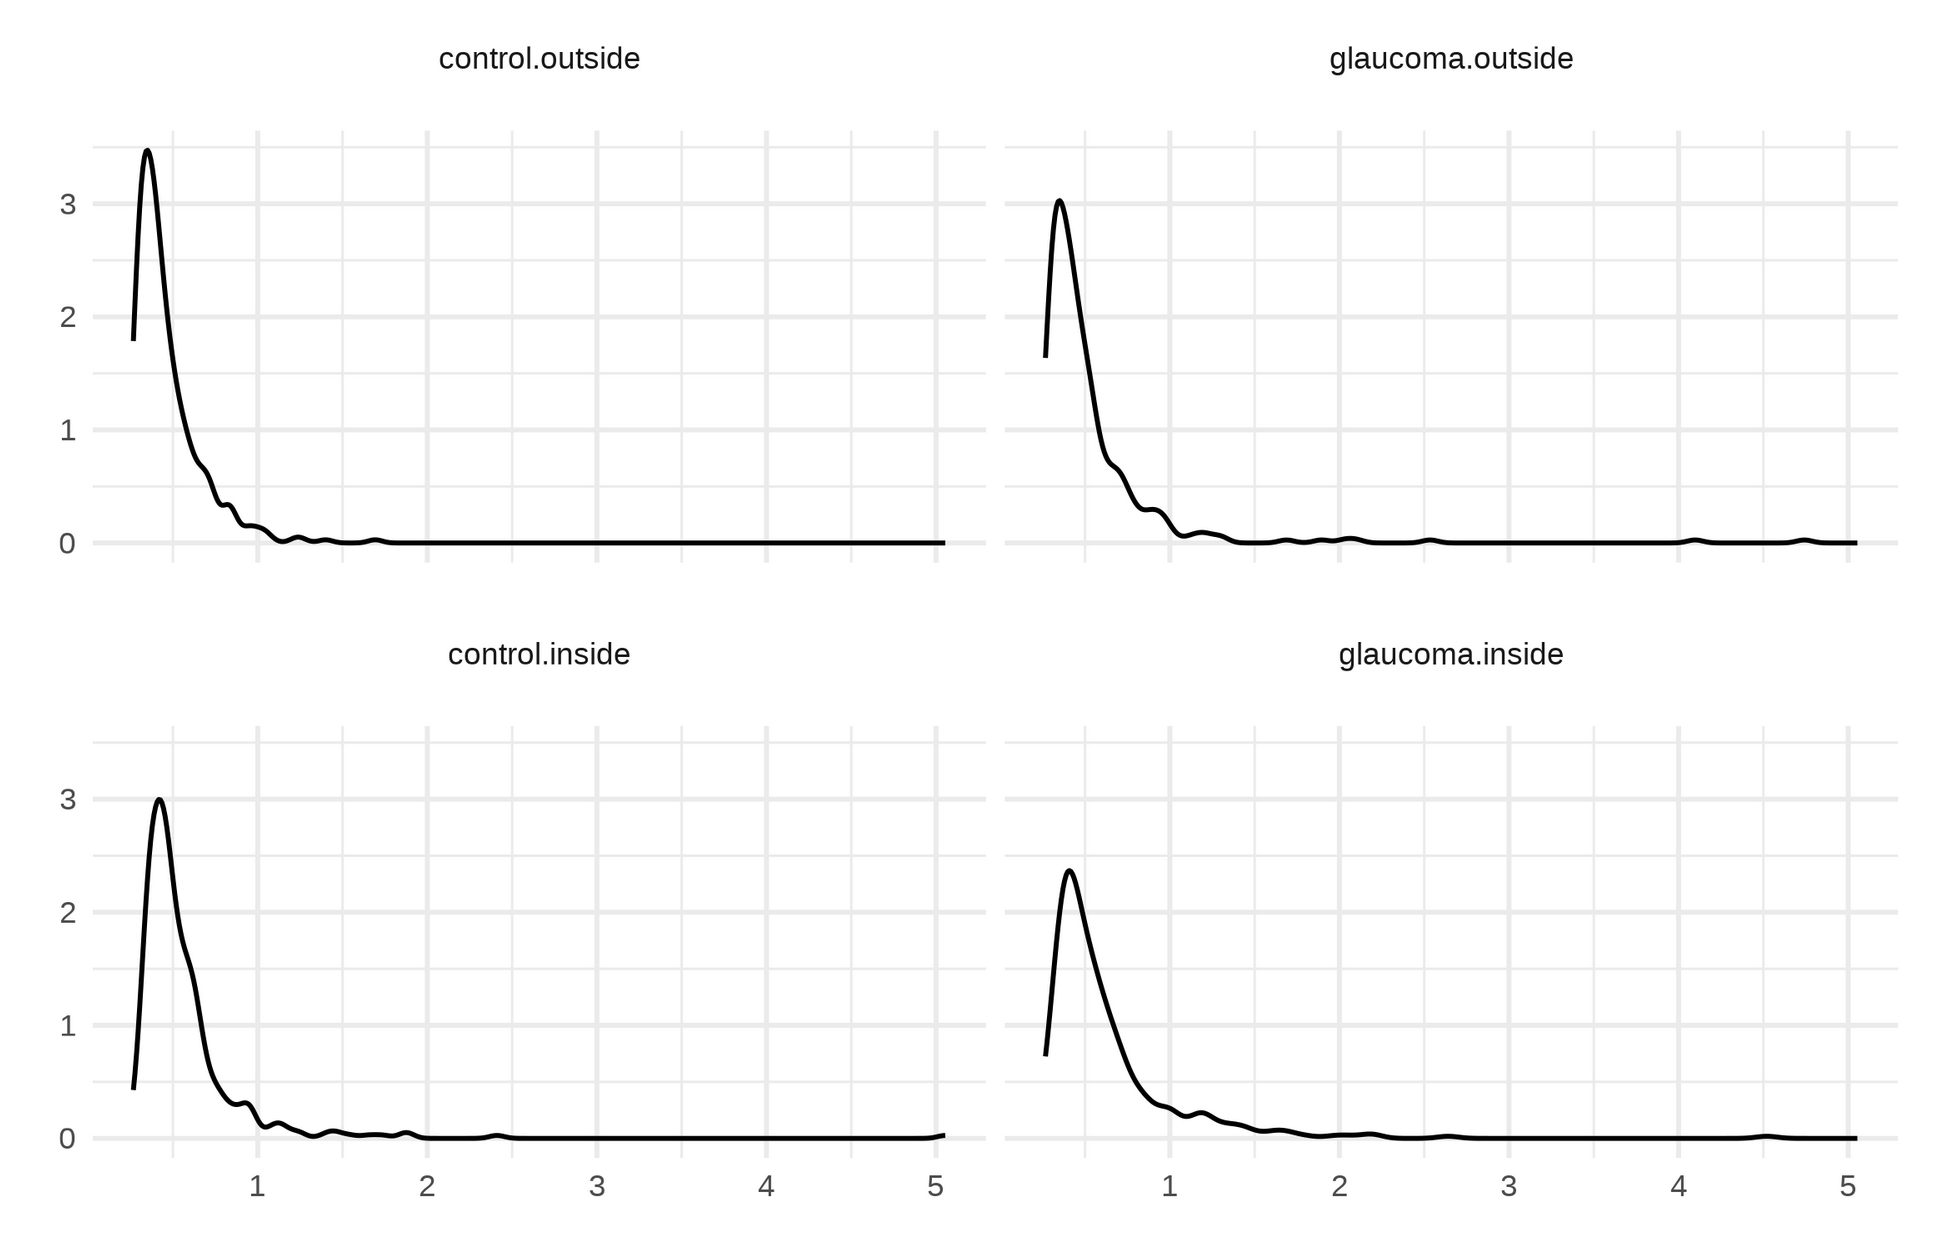
Dwell Time (s)
Dwell Time (s)
pdf(t)
pdf(t)
Probability Density Function (group x area)
Probability Density Function (group x area)
ANALYSIS — GLAUCOMA
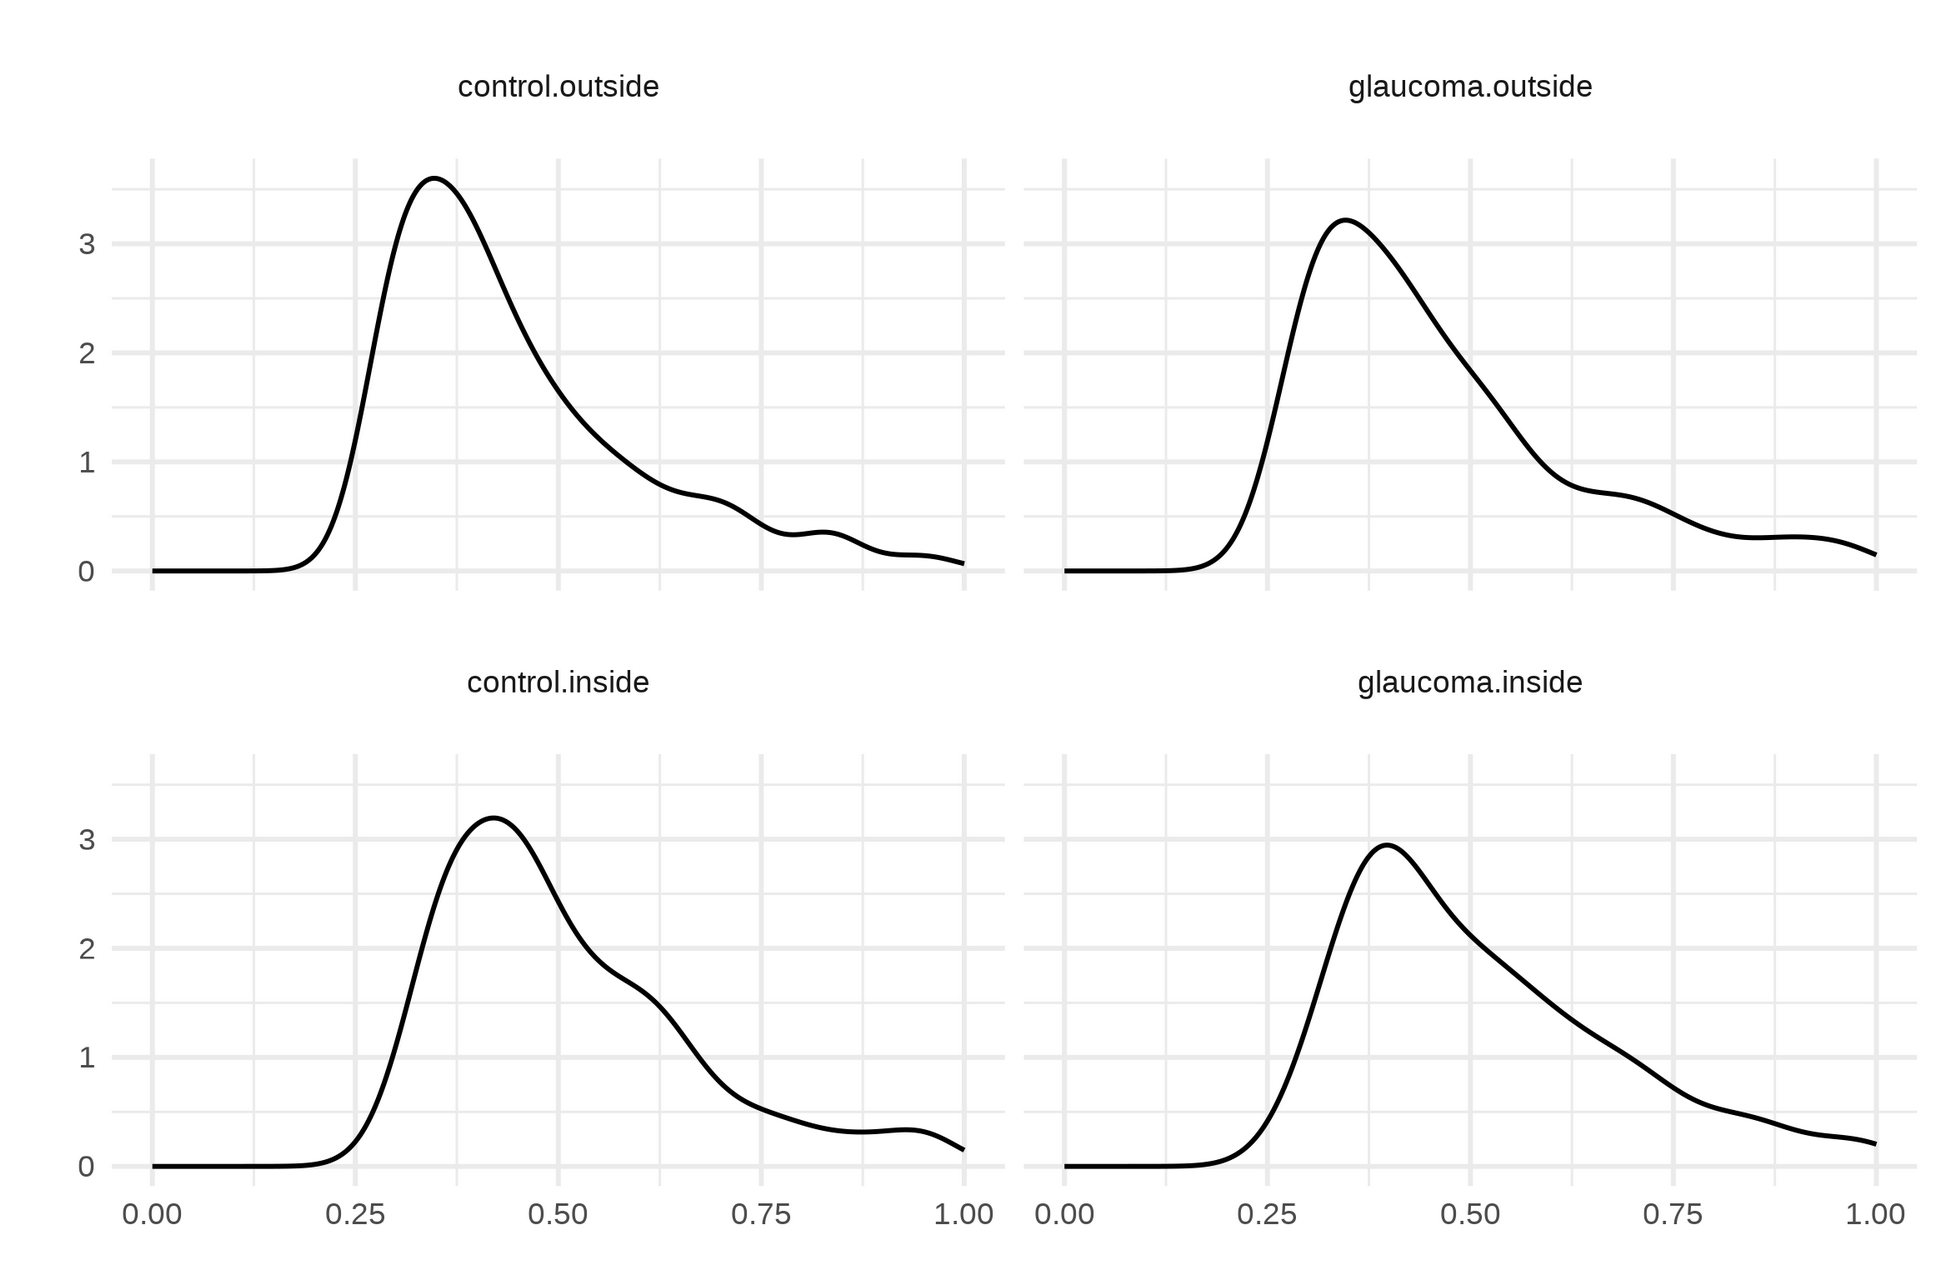
Dwell Time (s)
Dwell Time (s)
pdf(t)
pdf(t)
Probability Density Function (group x area)
Probability Density Function (group x area)
ANALYSIS — GLAUCOMA
MULTICOLLINEARITY DETECTED!
NO RESULTS!
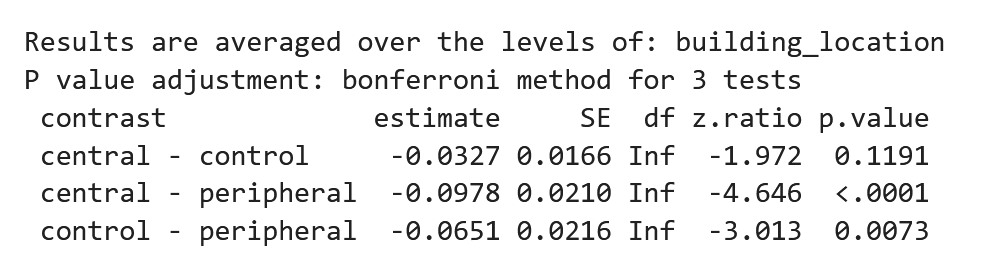
EFFECTS OF SIMULATION AND GLAUCOMA
- Graph measures, i.e. node degree, similar across groups
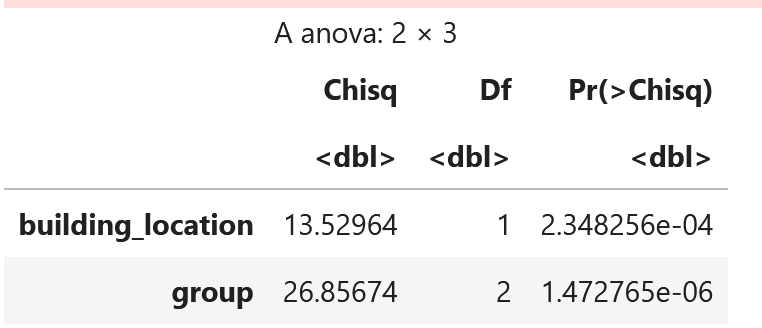
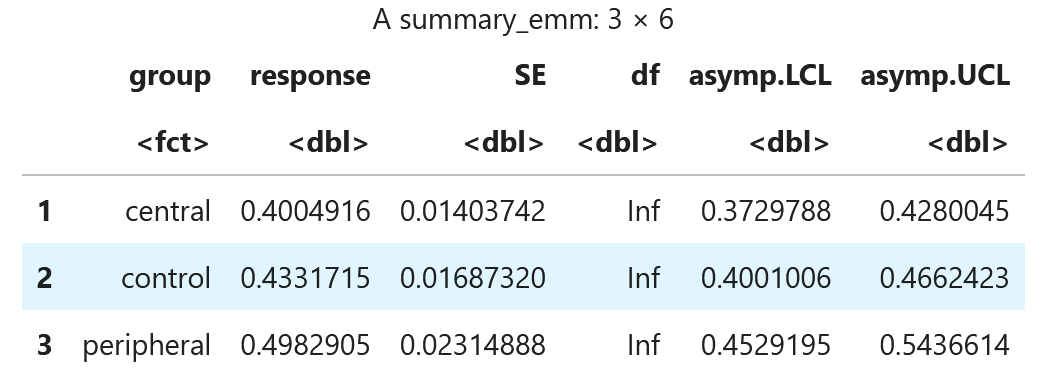
- Increased dwell time in peripheral simulation
- Due to saccade initiation for the next target
- Same analyses not applied to glaucoma data
- Multicollinearity between building and participant variance in glaucoma data
- The effects not additive rather multiplicative
- Might be something relevant to landmarks
- Region effect on dwell-time
- shorter look to buildings outside