WESTBRÜCK NAVIGATION STUDY
ANALYSIS
A Collaboration Project
Osnabrück Uni - OVGU
Safa Andac
Prof. Peter König
Prof. Michael Hoffmann
Outline
PARADIGM
RECRUITMENT
| Recruited | Exploration | PTB(*) | |
|---|---|---|---|
| Control (HC) | 13 | 9 | 8 |
| Glaucoma (GL) | 15 | 7 | 3 |
| Total | 28 | 16 | 11 |
| Exclusion | Ophth. Char. | Cybersickness | Others |
|---|---|---|---|
| Control (HC) | 2 | 1 - (1*) | 1 |
| Glaucoma (GL) | 4 | 2 - (2*) | 2 - (2*) |
| Total | 6 | 3 - (3*) | 3 - (2*) |
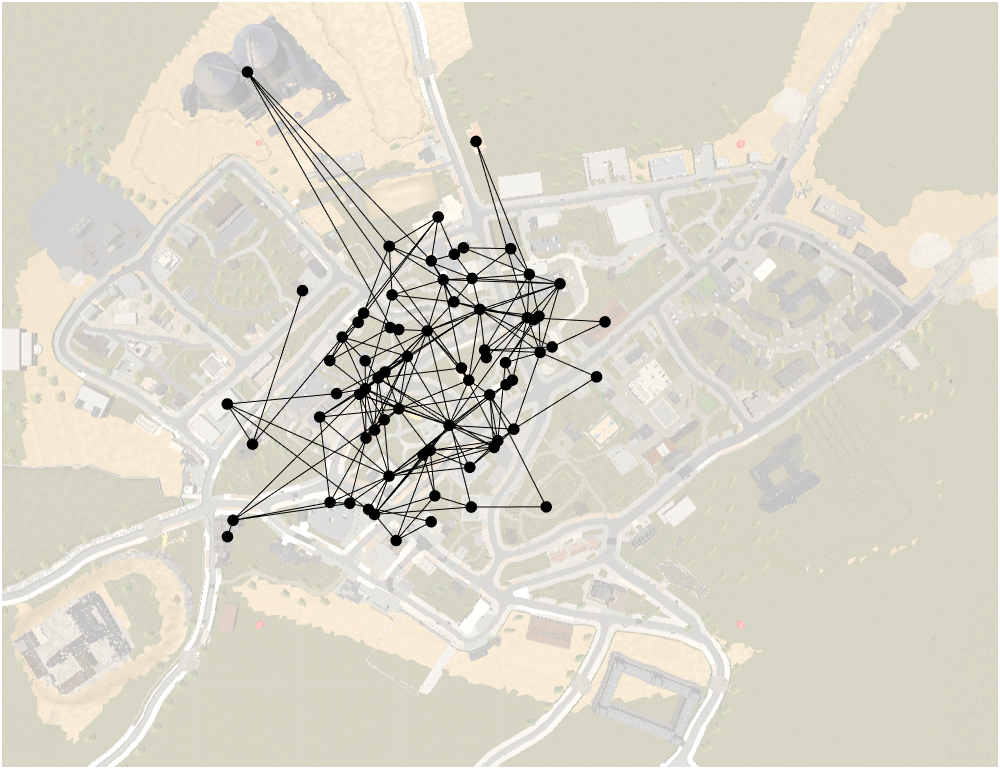
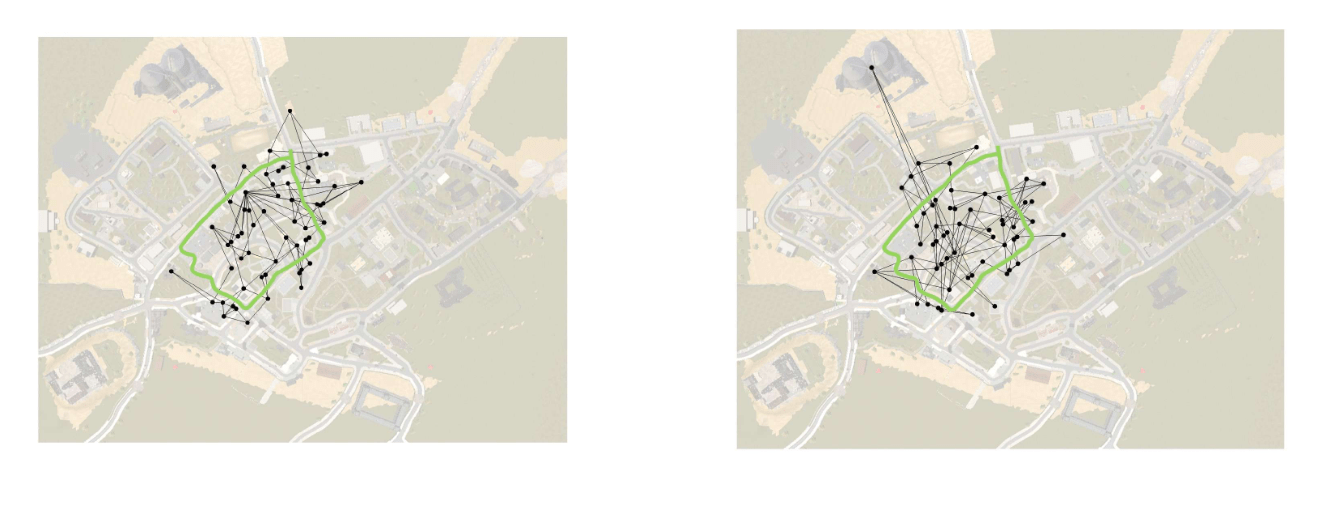
Graph SAMPLES
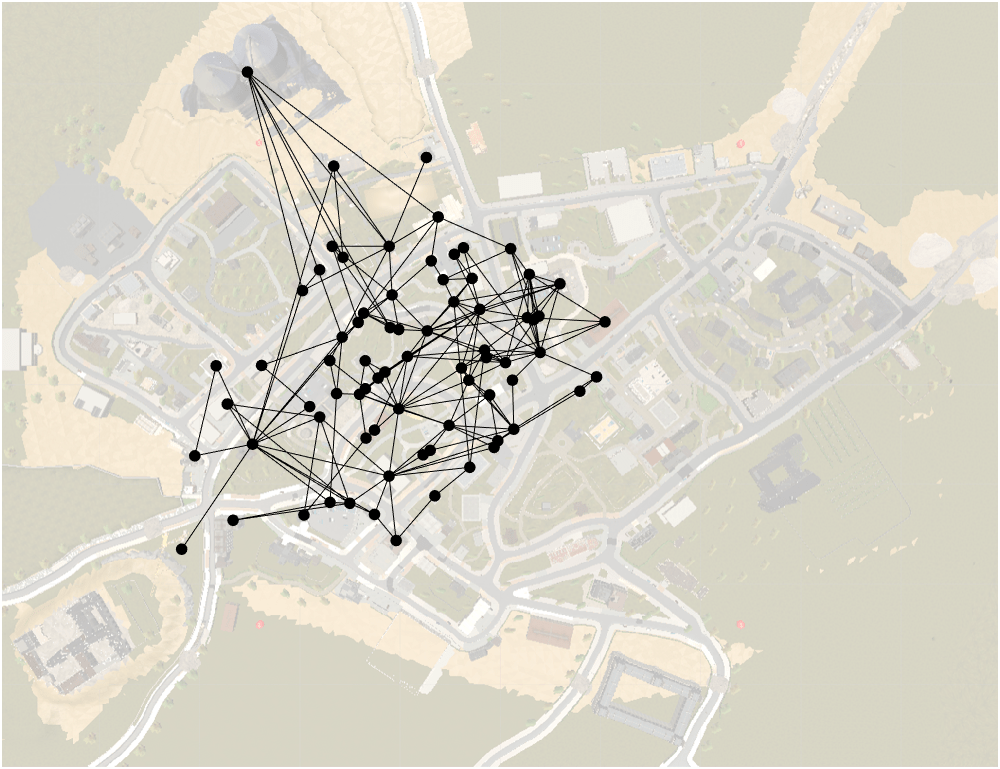
Control
Control
Glaucoma
Glaucoma
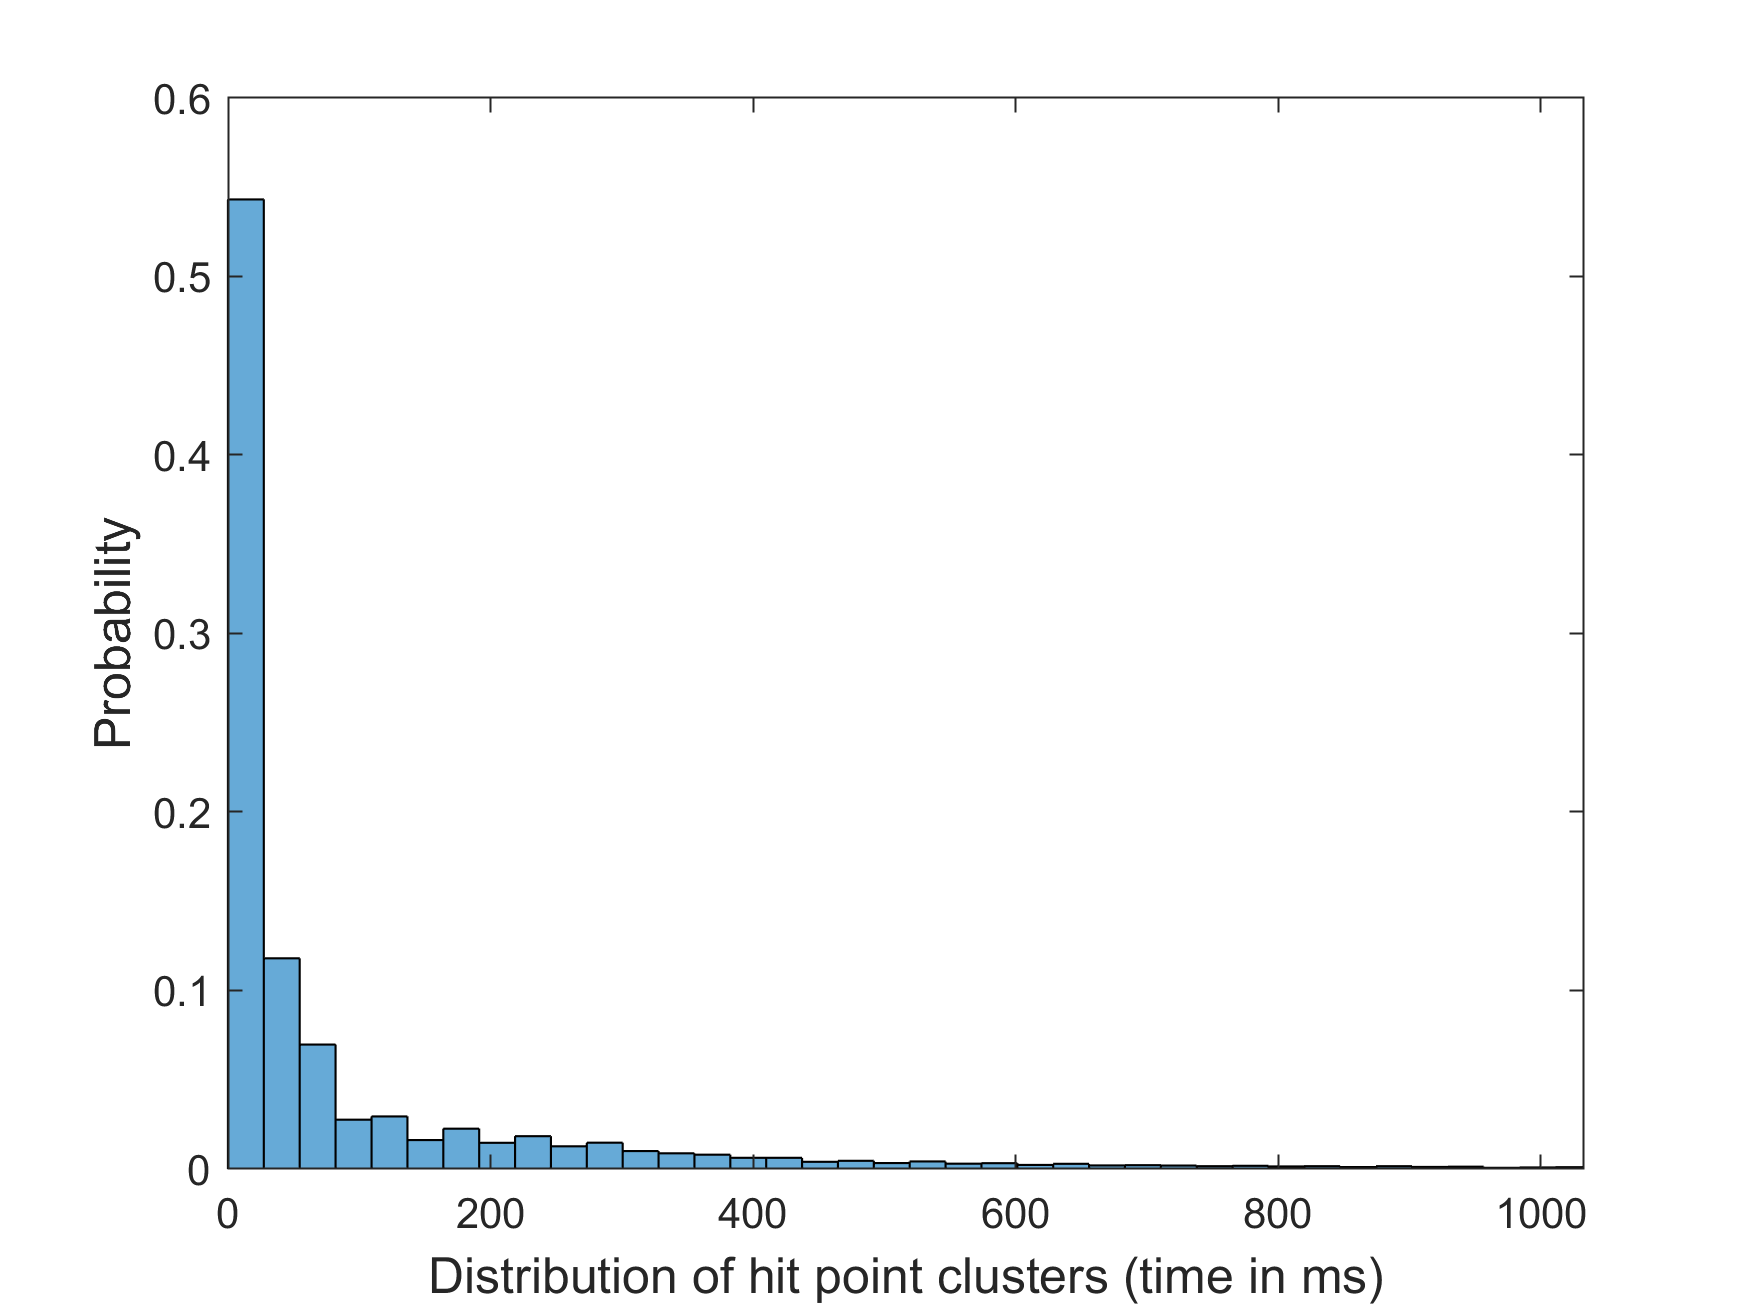
GAZE-NOISE

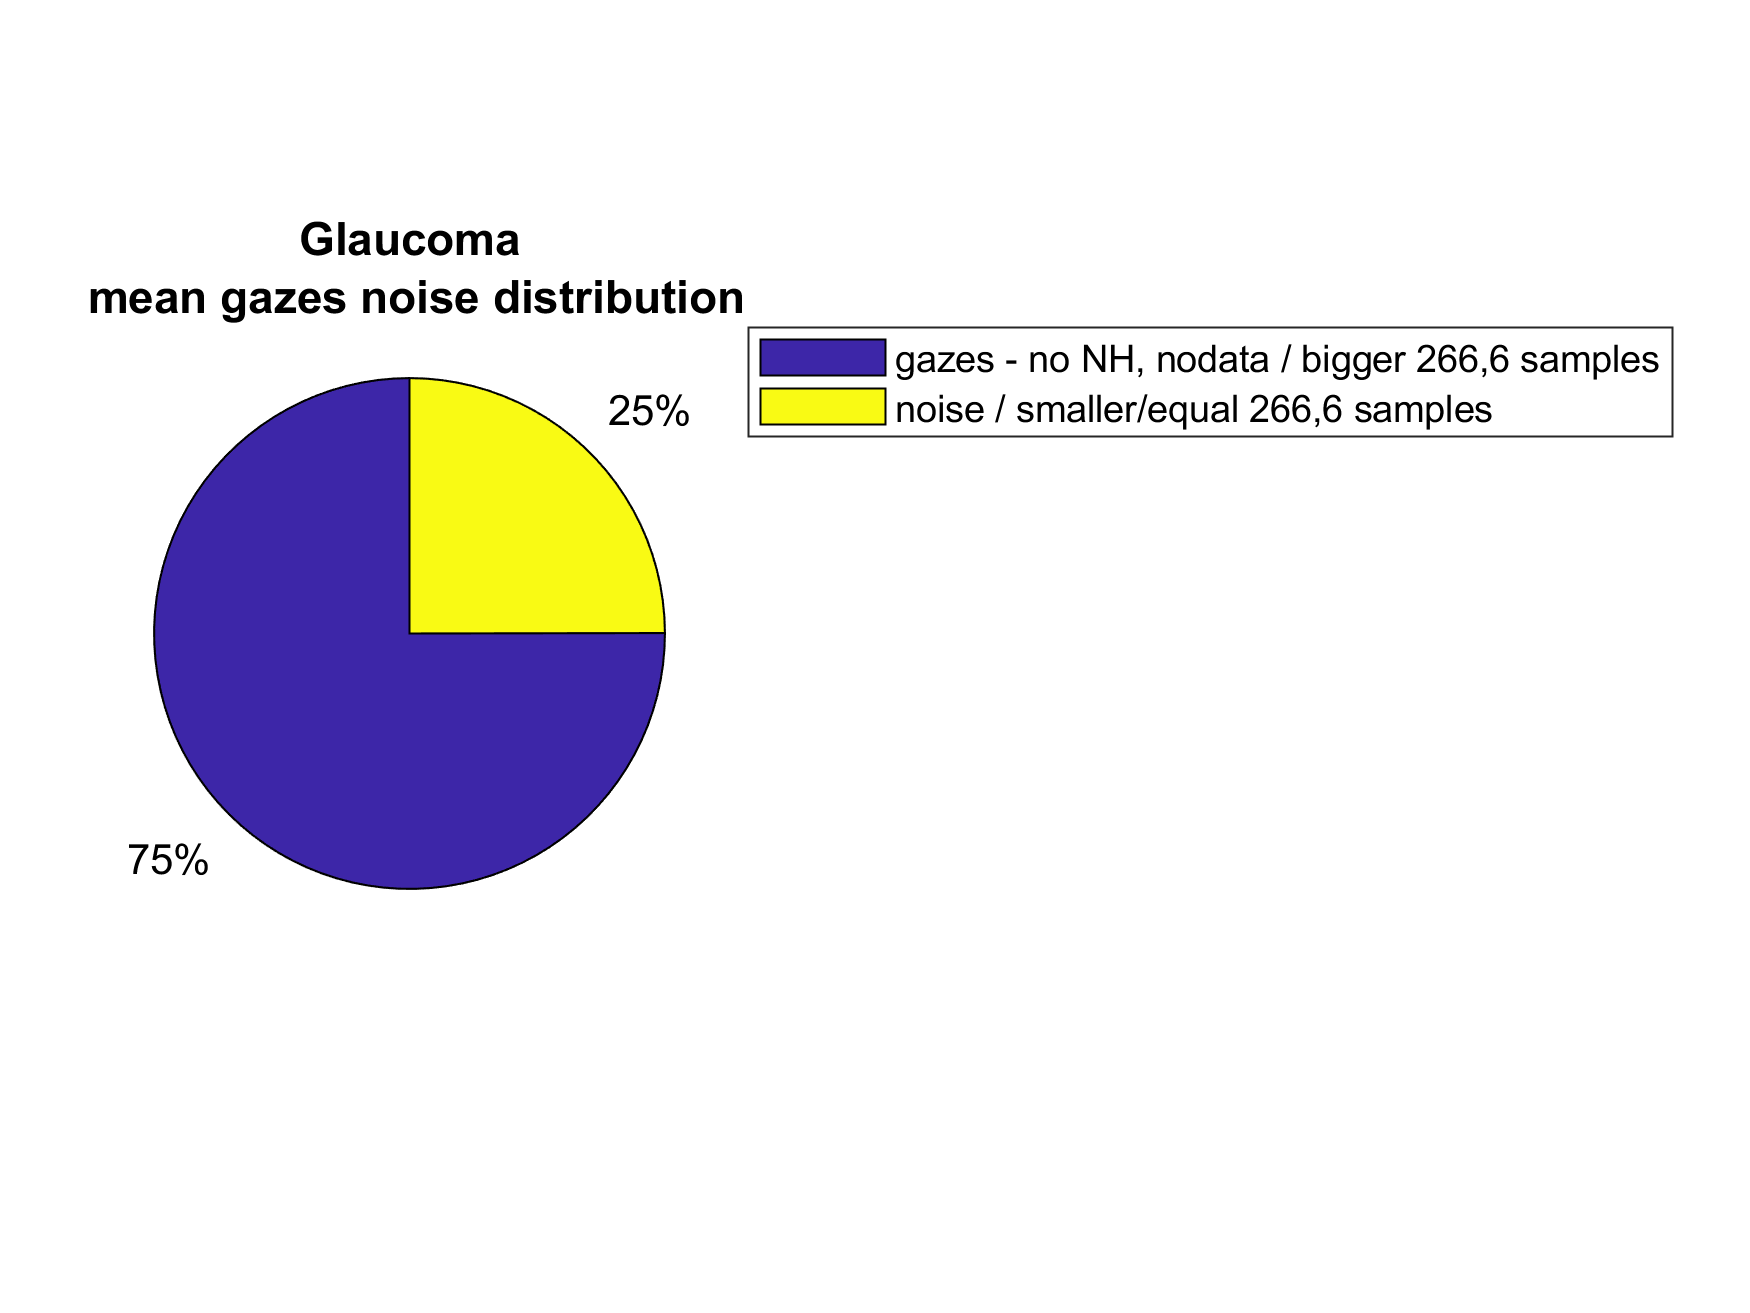
DisTRIBUTIONS
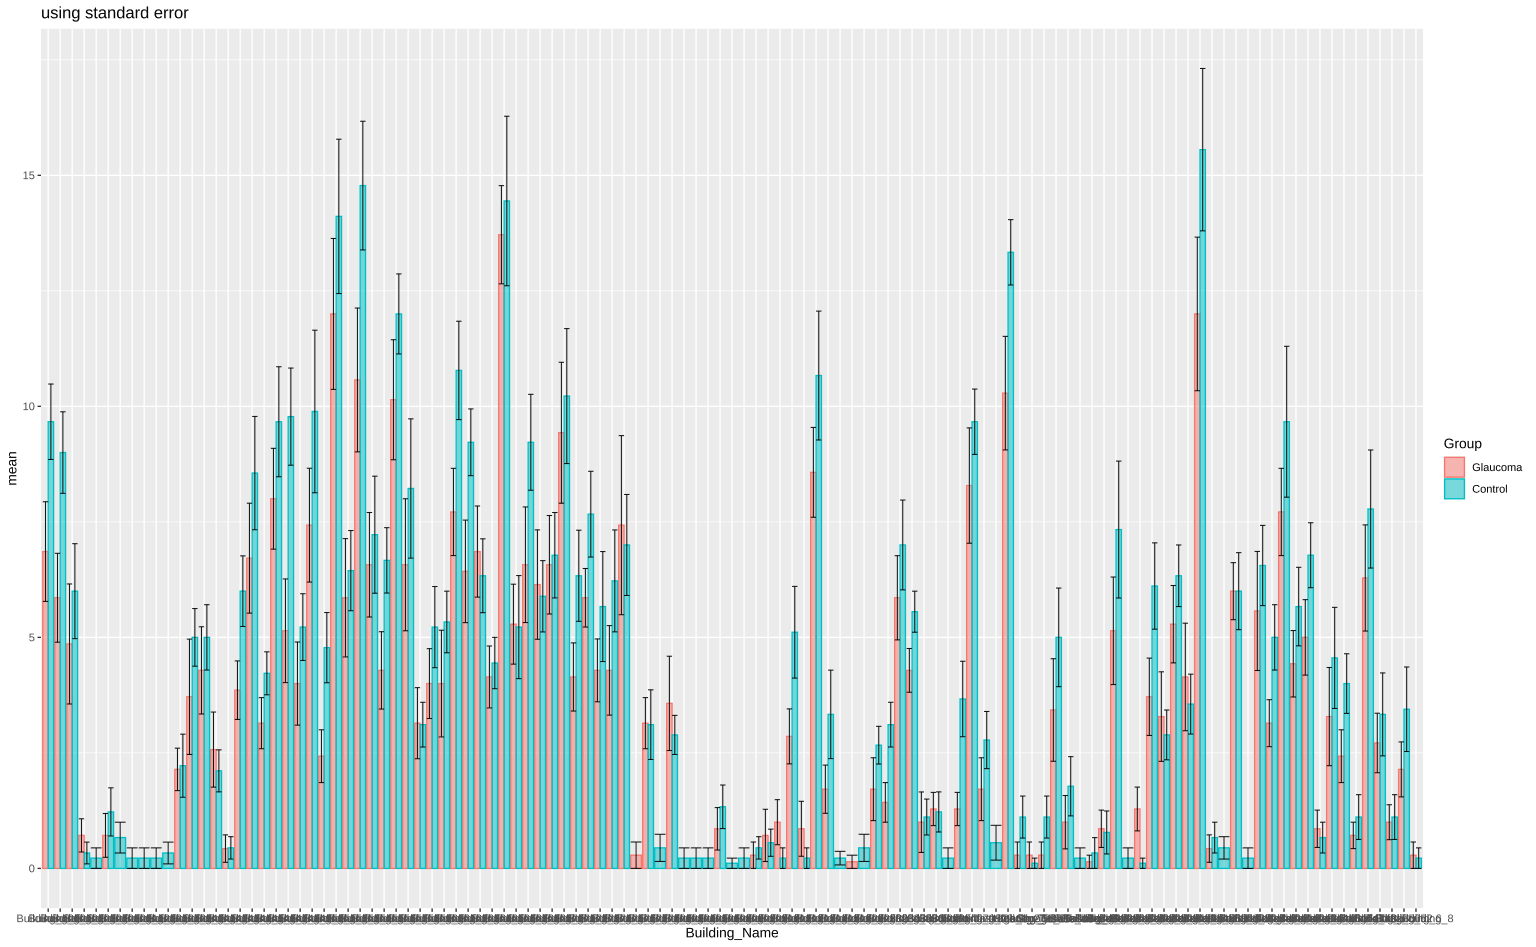
GAZE DISTRIBUTION
ANALYSIS
- t-test
- Mean of Node Degree Centrality ~ Groups (GL-HC)
p = 0.0492
- by filtering (Degree > 2)
p > 0.05
SUMMARY
- Variation in the data within the level of buildings and whole city
- t-test is affected from averaging for graph-based measures.
- Multiple correction not used but harms the significance levels a lot.
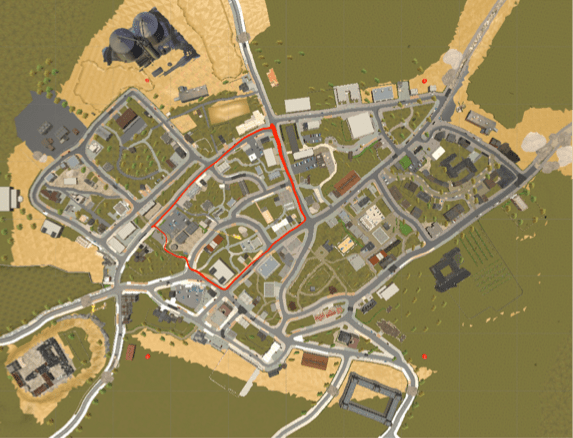
- ROI definition?
IDEAS
?
-
More basic measures
- Time in which people spend for each building
- Number of buildings that people have scanned
- + derived measures: e.g. Time spent on buildings in total.
- The noise that's removed in the preprocessing pipeline(?)