G8-G12_TeacherCopy
Demo Class : Introduction to coding


TA: Teacher Activity
SA: Student Activity
SAA: Student Additional Activity
| Slide No. | Topic |
|---|---|
| 8-15 | Spyder Instructions & Explanations |
| 21, 22, 27 | TA Steps |
| 21, 22, 27, 30 | TA Code solution + Coding steps |
| 34, 35, 37, 42 | SAA Code solution + Coding steps |
PREPARATION & REFERENCE
CLASS STRUCTURE
| Activity Flow | Slide No. | Topic | Time |
|---|---|---|---|
| TA | 4 | Ice Breaker activity | 1 min |
| 6-7 | Intro to Programming & Python | 3 mins | |
| 16-30 | Game Development | 14 mins | |
| 31-38 | Data Science | 8 mins | |
| SA | 36-37 | SA - Activity Data Science | 3 mins |
| TA | 39-42 | Computer Vision | 5 mins |
| WRAP-UP | 44-46 | Quiz | 1 min |
Pre-Requisites
FOR TEACHER
-
Computer with Internet connection.
-
Latest browser installed.
-
"pygame" package installed.
-
Spyder IDE installed.
FOR STUDENTS
-
Computer with Internet connection.
-
Latest browser installed.
Software Installation Steps
1. Anaconda & Prerequisite Download Instructions:
2. Spyder IDE Download Instructions:
What will you do if you have a superpower?

Who is your role model?
Are you all ready to start today's class?
Let's move ahead

A programming language is a language understood by the computer


Hello!
01010011
What is a Programming Language?
Why should we learn Python ?
Web Applications
Artificial Intelligence (AI)
Data Analysis and Prediction
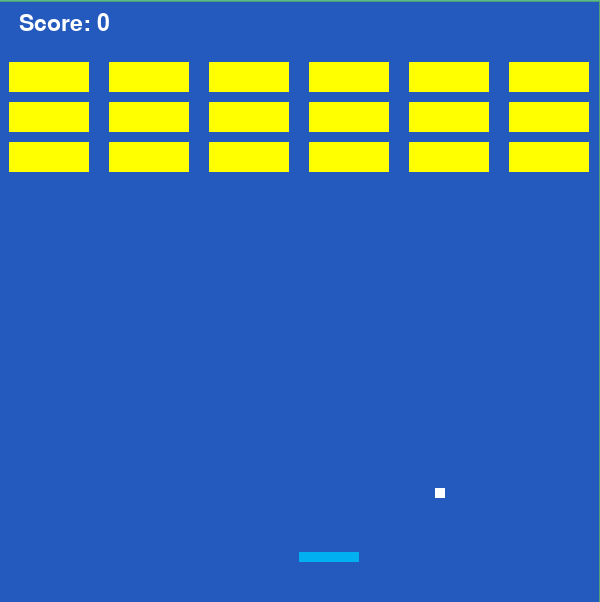
Game Development
Let's see a game created with Python
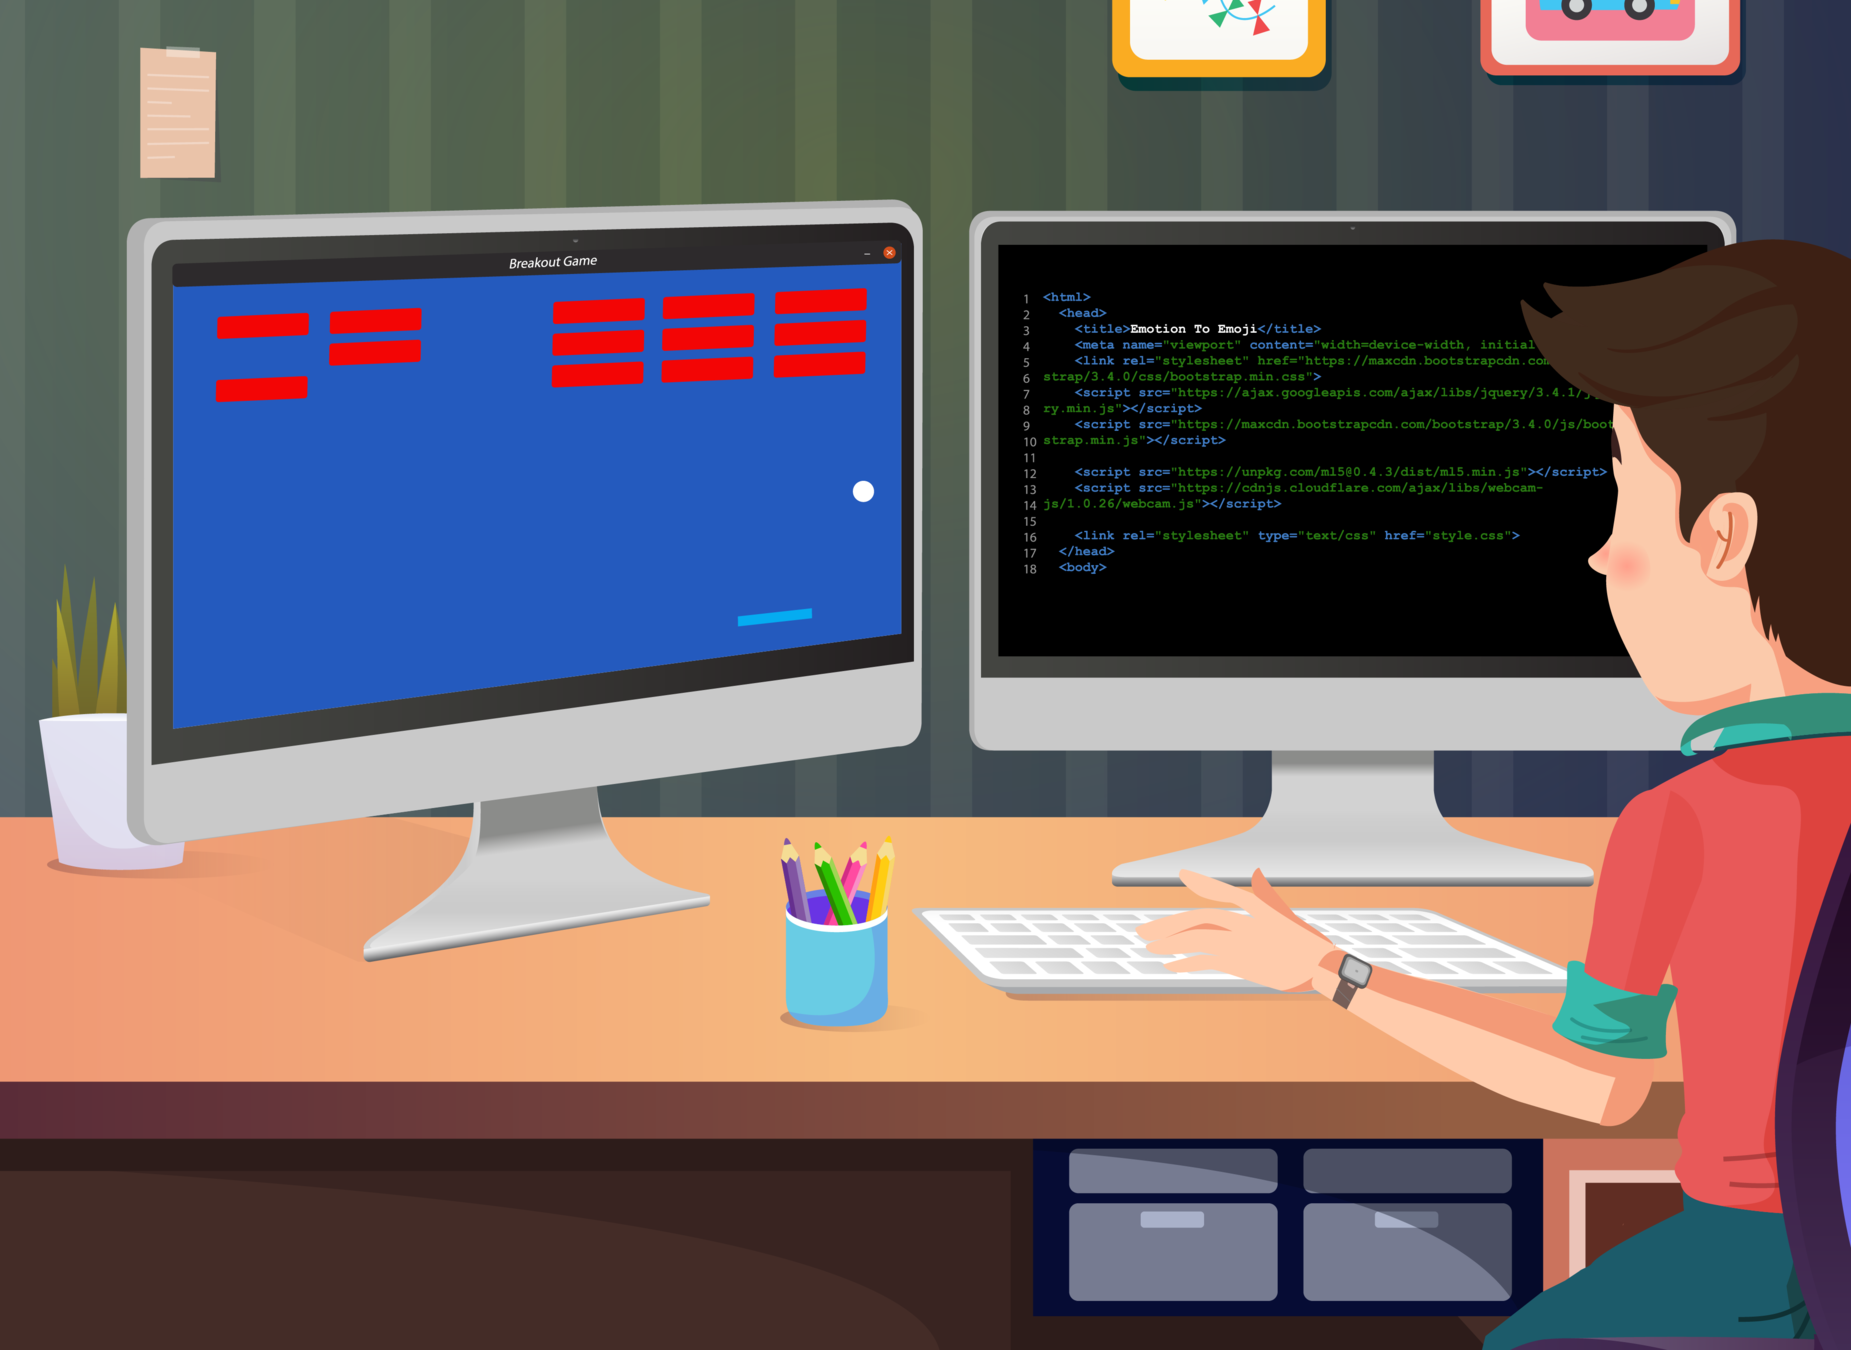
Let's change the color of the bricks

B
(Red, Green, Blue)
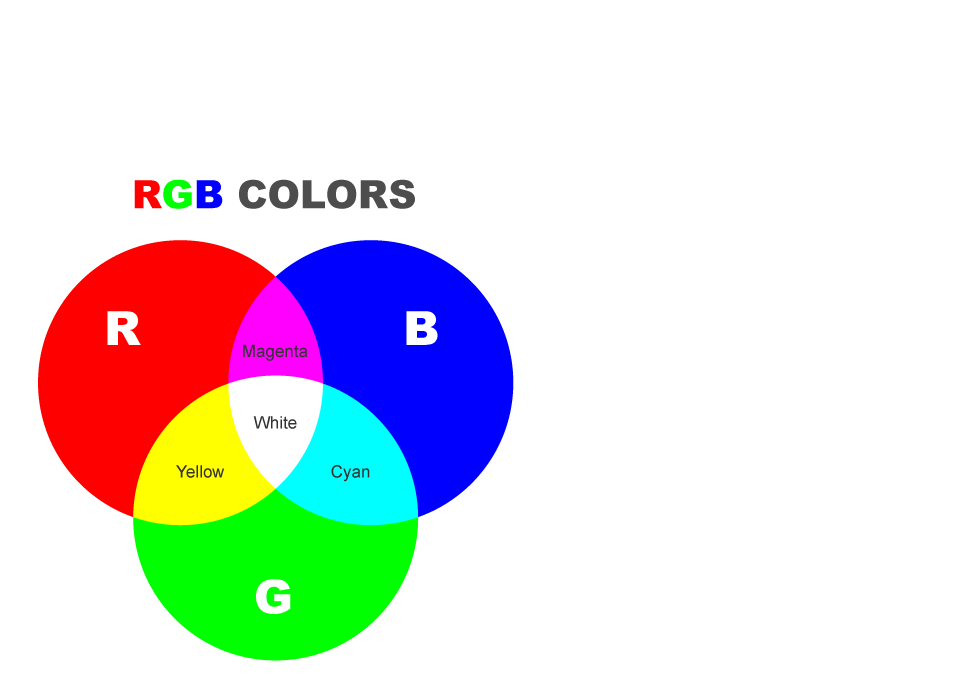
Red color -> (255, 0, 0)
Green color -> (0, 255, 0)
Blue color -> (0, 0, 255)
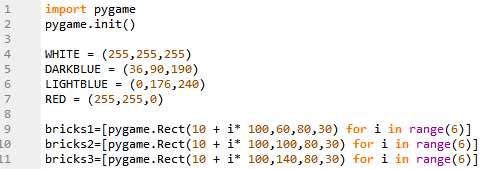
Code to complete the activity

GREAT!

Let's learn one more application of Python
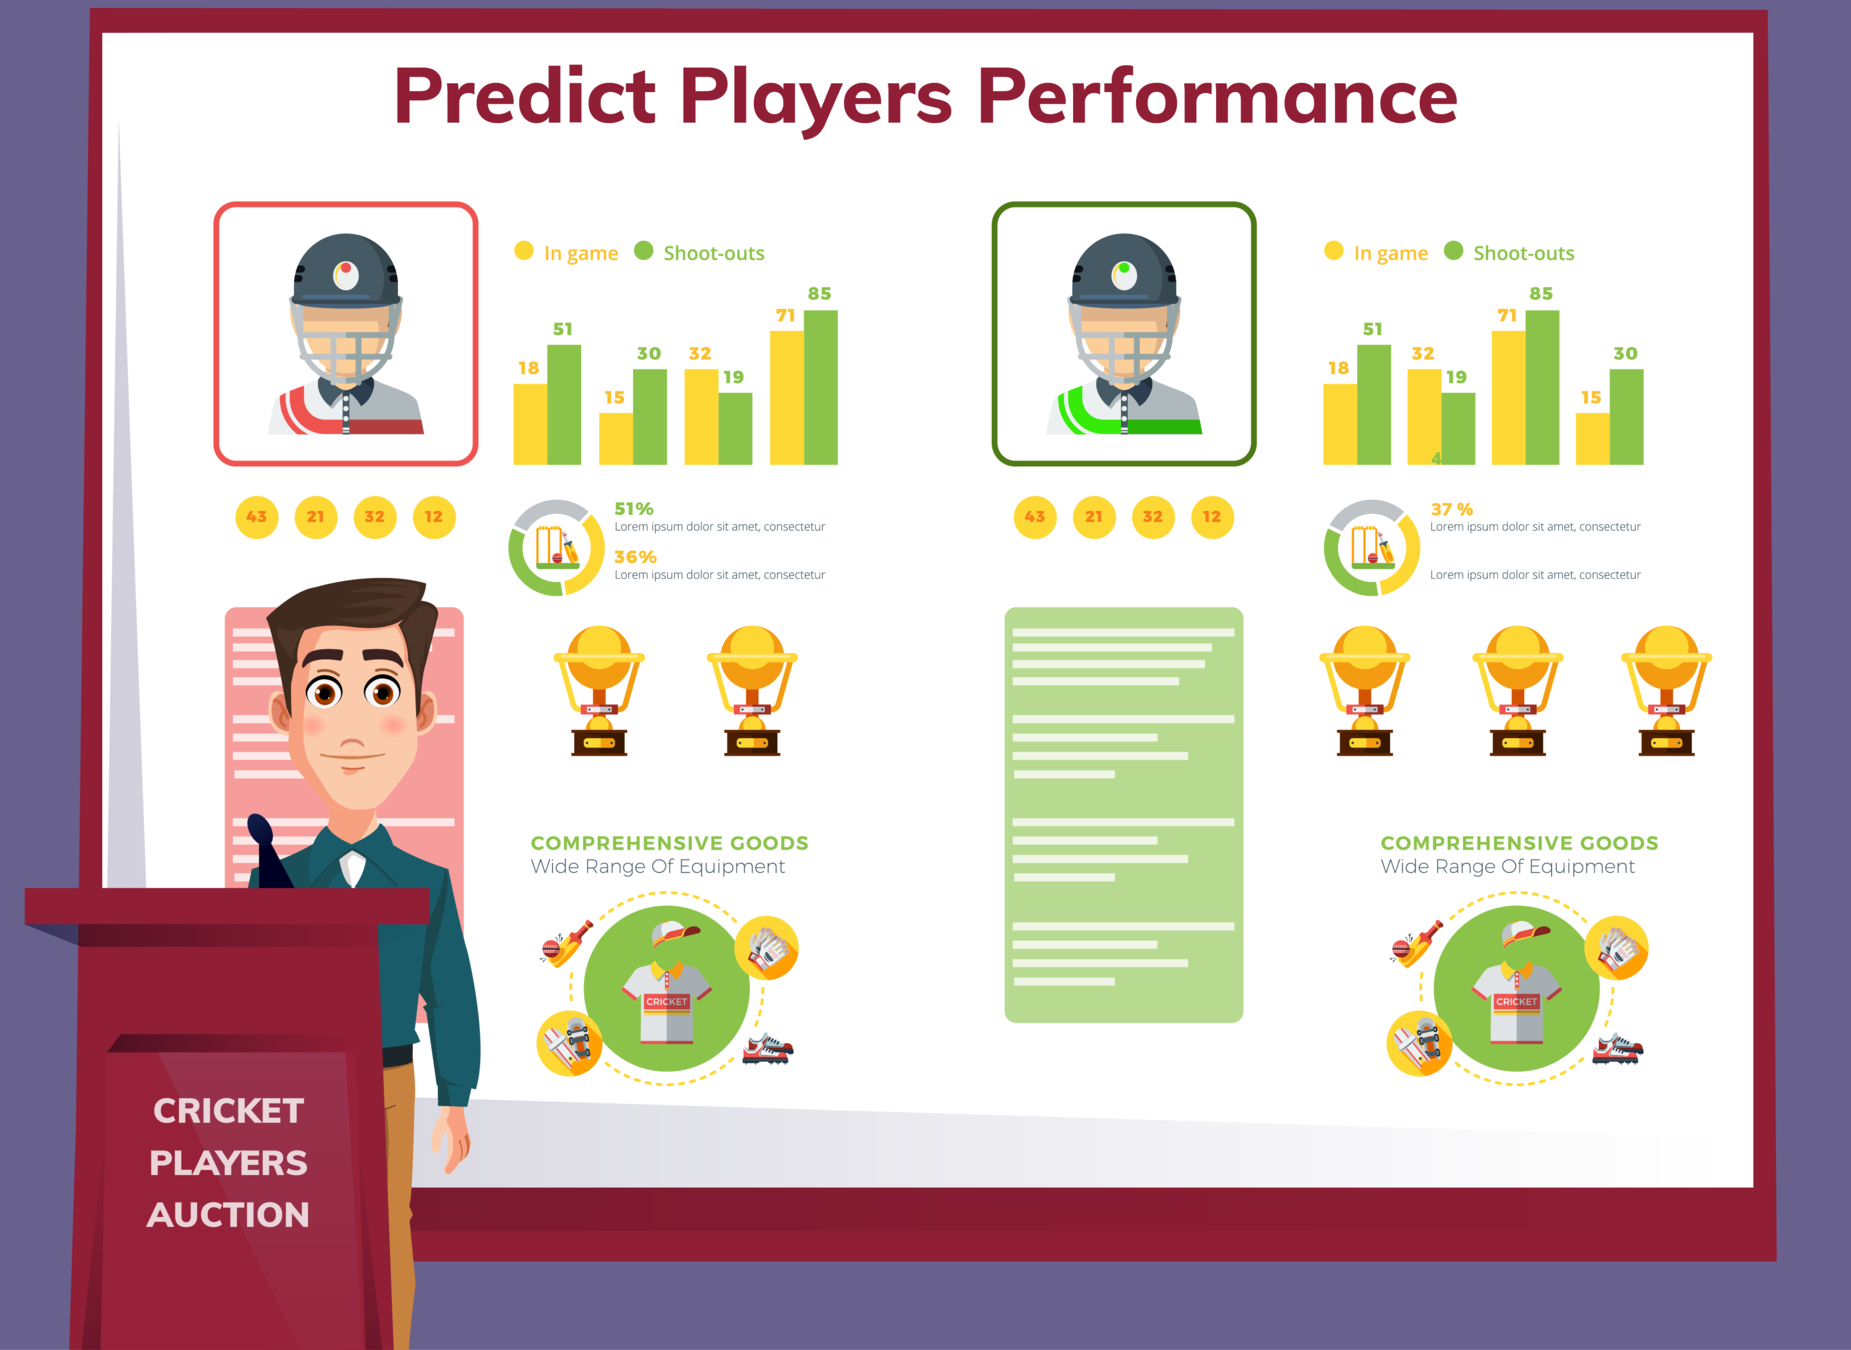
This is IPL auction
Yes, the chart shows he's breaking all kinds of records
He is a great batsman.
Representation of table
Columns or Features
Rows or Observations
Values or Data points
Running block of code in Jupyter (myBinder.org)
#install the required libraries
!pip install pandas
!pip install numpy
!pip install matplotlib
#Import the necessary libraries
import pandas as pd
import numpy as np
#Loading the dataset and printing first five rows of the dataset
df = pd.read_csv("https://github.com/jainharshit27/datasets/raw/main/IPL%20Player%20Stats%20-%202016%20till%202019.csv")
display(df)
#Finding data is for how many tournaments. (on running first line it is clear that data is of 2017,2018 and 2019). We kepts data of 2019 only by running the second line.
df.Tournament.unique()
df=df.loc[df['Tournament'] == 'IPL 2019']
display(df)
#Kept the necessary columns/ features from the dataset
newdf = df.filter(['Team','Player','Batting Innings','Batting Average','Bowling Innings','Bowling Average'], axis=1)
display(newdf)
#Replaced '-' values with 0. (This is required as when we will apply a filter say runs>0, in this case only numeric values can be compaired so - is changed to 0)
newdf=newdf.replace('-', '0')
display(newdf)
#Checking the datatype of each columns, and changing them to numeric data type.
newdf.dtypes
newdf[['Batting Innings','Batting Average','Bowling Innings','Bowling Average']] = newdf[['Batting Innings','Batting Average','Bowling Innings','Bowling Average']].apply(pd.to_numeric)
newdf.dtypes
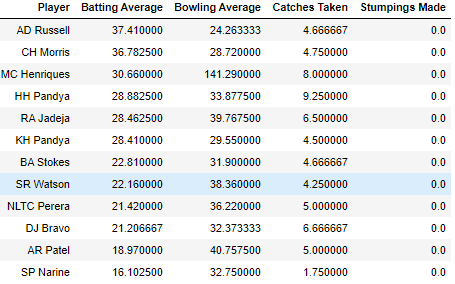
#Keeping the players who have played the given number of bolwing and batting innings to fnd the allrounders
Allrounder=newdf[(newdf['Batting Innings'] > 6) & (newdf['Bowling Innings'] > 6) ]
display(Allrounder)
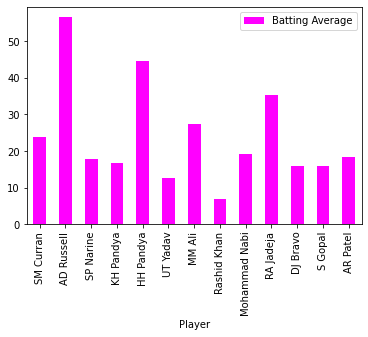
#Plotting The batting avg. of allrounders
Allrounder.plot.bar(x='Player',y='Batting Average',colormap='spring')
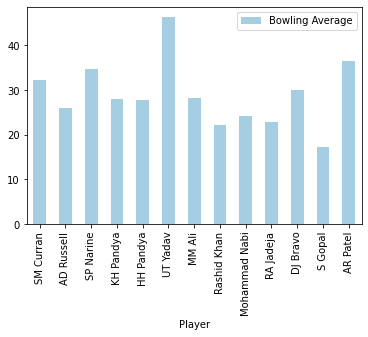
#Plottign the bowling avg. of the allrounders
Allrounder.plot.bar(x='Player',y='Bowling Average',colormap='Paired')Link for detailed Code Explanation:

What Next?
Game Development


Web Development


Data Analysis

Computer Vision


Which one of the following is the correct code for blue color?
(0, 0, 255)
(0, 255, 0)
(0, 0, 0)
Q.1
(255, 255, 255)
A
C
B
D
A
(0, 0, 255)


Color is given in (red, green, blue) format. So the code for blue will be (0,0,255)
Which of the below-mentioned tasks can be done using Python?
Data Analysis
Game development
Artificial Intelligence
Q.2
All of the above
A
C
B
D
D
All of the above
Python can do all of the tasks mentioned using the vast set of libraries that are there in the Python.
Links Table
| Activity | Activity Name | Link |
|---|---|---|
| Teacher Activity 1 | Breakout Game | |
| Teacher Activity 2 | Analysis- All rounder | |
| Teacher Activity 3 | Analysis- All rounder Explaination | |
| Student Activity 1 | RGB Calculator | |
| Student Activity 2 | Analysis- All rounder |
bit.ly/STUA1