Numbers in the Newsroom
Taming the figures for you and your audience
Statistics are people with the tears washed off
- Paul Brodeur
He uses statistics as a drunken man uses lamp-posts -- for support rather than illumination
- origin unknown, often attributed to Andrew Lang, b. 1844
We do not expect reporters to be mathematical geniuses. But we do expect them to sidestep their mind-numbing fear of mathematics long enough to ask, 'Does this make sense?' 'What would I conclude from these numbers?'
- A.K. Dewdney
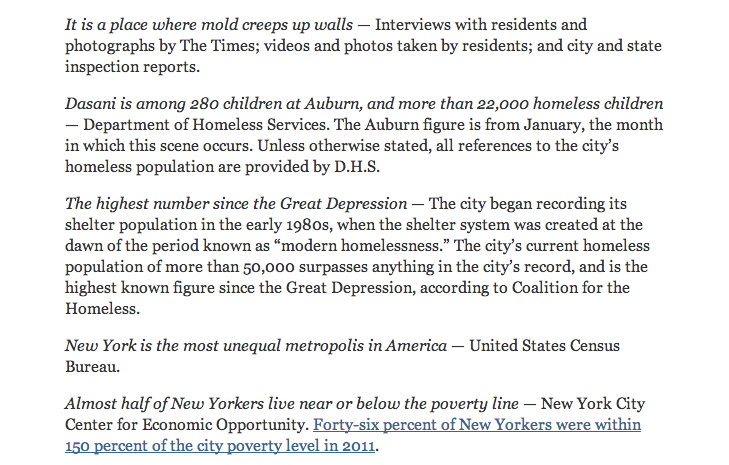
Even the most compelling narrative stories have a backbone of statistical evidence

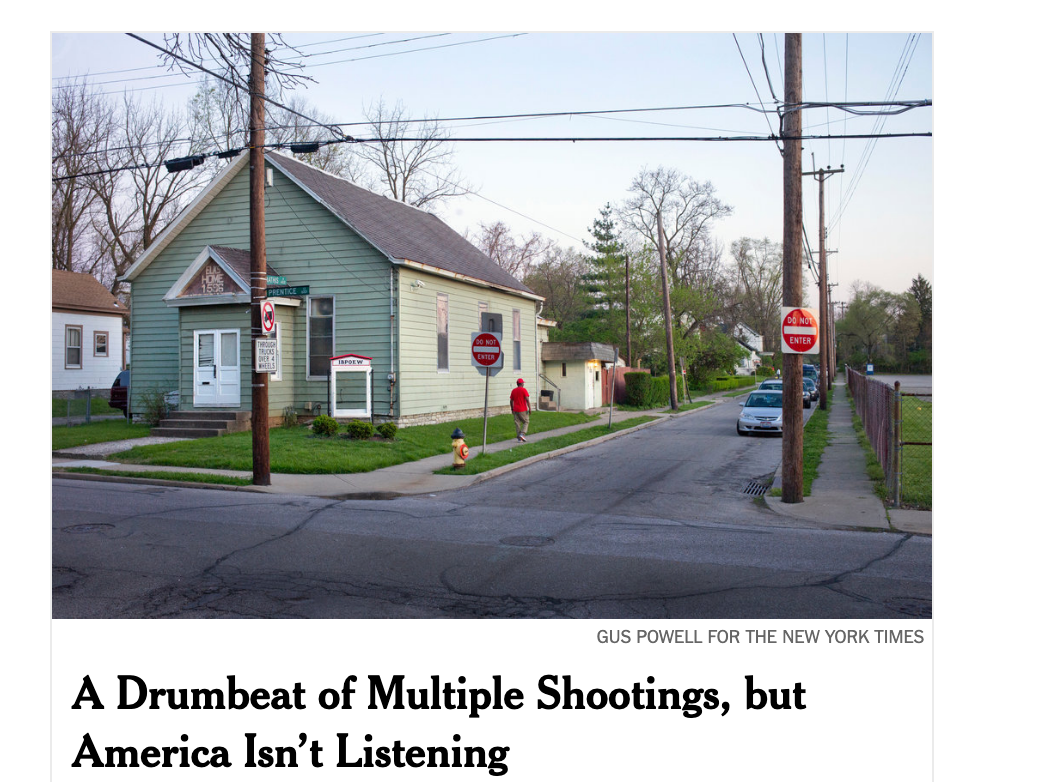
Footnotes from Invisible Child: Dasani's Homeless Life, by Andrea Elliott, New York Times, December 2013
Put numbers in their place
- Summaries
- Opinions
- Guesses
Why are we so anxious?

Numbers don't - for you or your audience
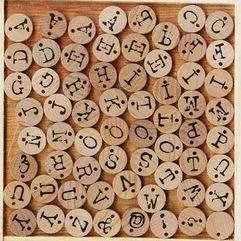
Letters make understandable units
Three fears


Lost at sea or in another language without a translator
Three fears:
Boring your readers and viewers

Three fears: The statistics police

Three fears
-
Feeling out of your element
- Everyone is!
-
Get a sense of scale - how much is a lot? How much is a little?
-
Boring your readers
- Don't do that!
- Select, don't compress, the best opinions, summaries and guesses
-
Use visualizations to convey dense numbers more clearly
-
Being wrong and getting caught
- Start early and check your work
- Simplify, simplify, simplify til you're sure you understand
- Do you believe it?
- Go back to "get a sense of scale"
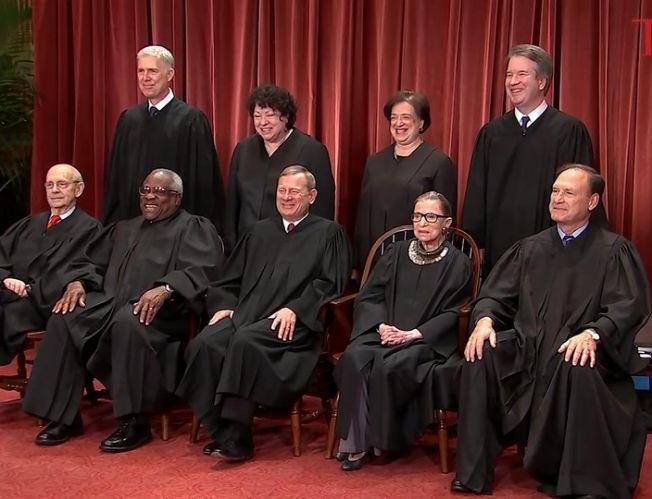
5
5-4
330
330
million
330
billion
3.4 million
vs.
330 million
* can you picture it? Try dividing...
.01030
* ... Still can't picture it? Try multiplying ...
"The death rate in the US is 10 per 1,000 people"
1 ÷ .01030
= 97
*.. or dividing again.
" One out of every 97 people in the US died in the US in 2020 "
Scaling numbers
- When numbers get big, they are incomprehensible
- When numbers get too small, they're also incomprehensible
- Find a way to get them to a scale you understand - proportions, fractions, rates, ratios
Strategies to scale: Find an anchor
- A standard or goal. What would a "good" number look like?
- Other places
- Over time
- Portion of a whole

Example: The Million Man March

Key math skills
- Averages
- Mean, or simple average
- Median, esp for money values
- Changes
- Rates
- Percentages
- Pieces of the pie
- Percent change
Tips
- Writing is about selection, not compression, of facts - ration your numbers in your story
- Memorize a few numbers on your beat ("compared to what?")
- Round off a lot
- Find simpler, more meaningful ways to characterize numbers
- Separate your data or number-heavy sentences by describing details of what they represent before getting more
In Hastings, which has a population of about 22,100, there were six heroin arrests in 2011, according to a report from the drug task force. That's compared with eight arrests in Burnsville, a city with 60,300 residents. Eagan, a city of 64,200, had seven arrests.