Chrome debugging
——从入门到玄学大师
node index.js --inspect
- node --inspect-brk index.js
- chrome://inspect
- find remote target
- click inspect
P.S. node -e "process._debugProcess(PID)" for node process
P.S. 使用 command + p 切换文件
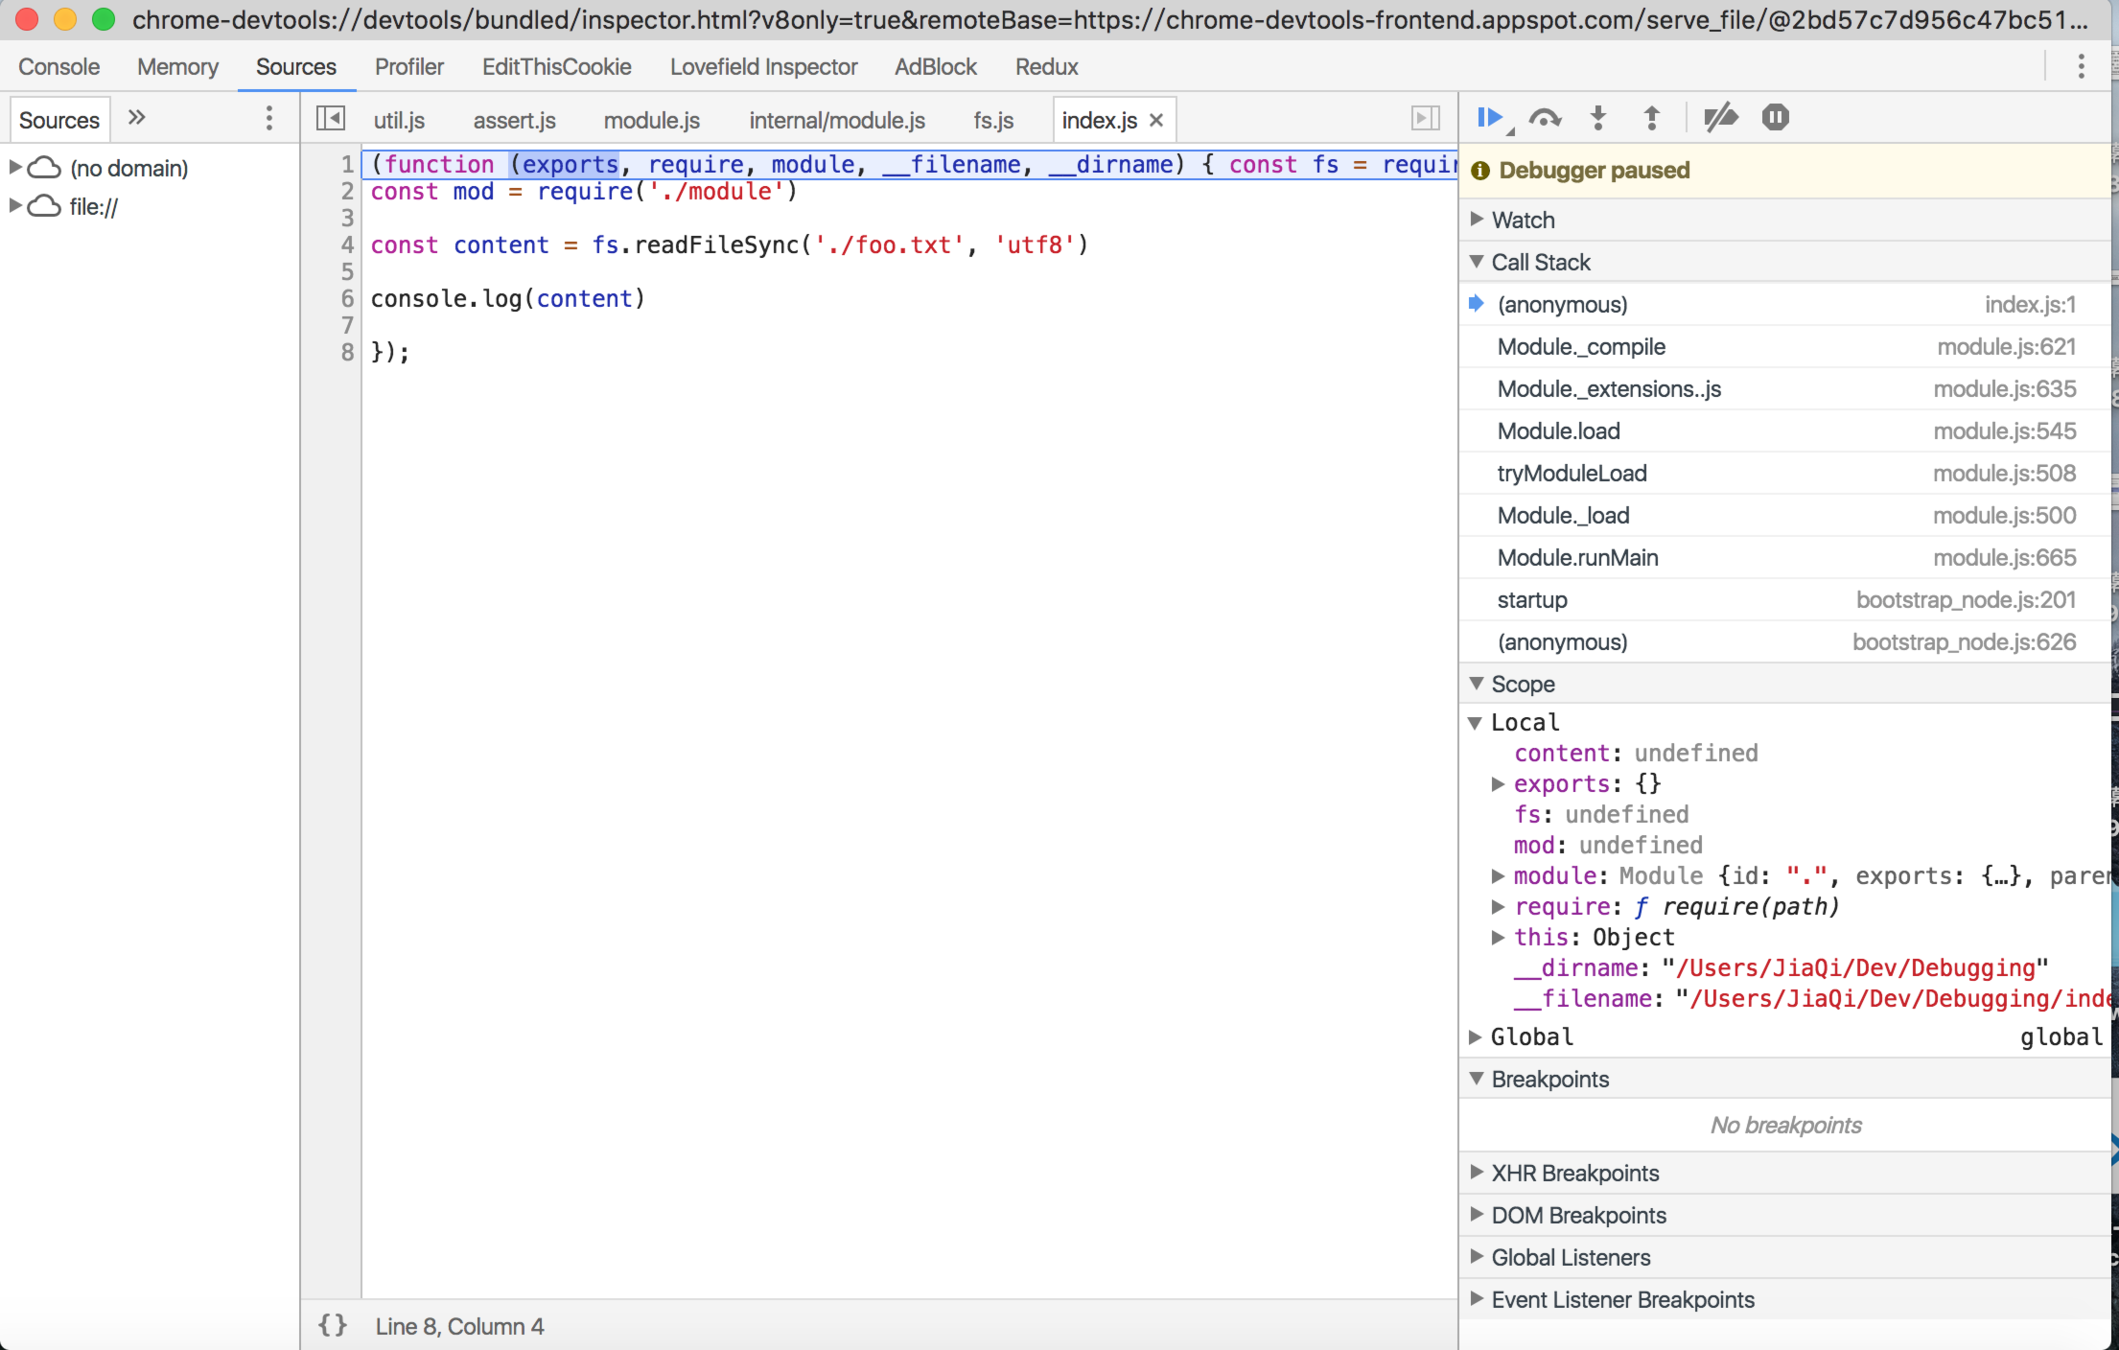
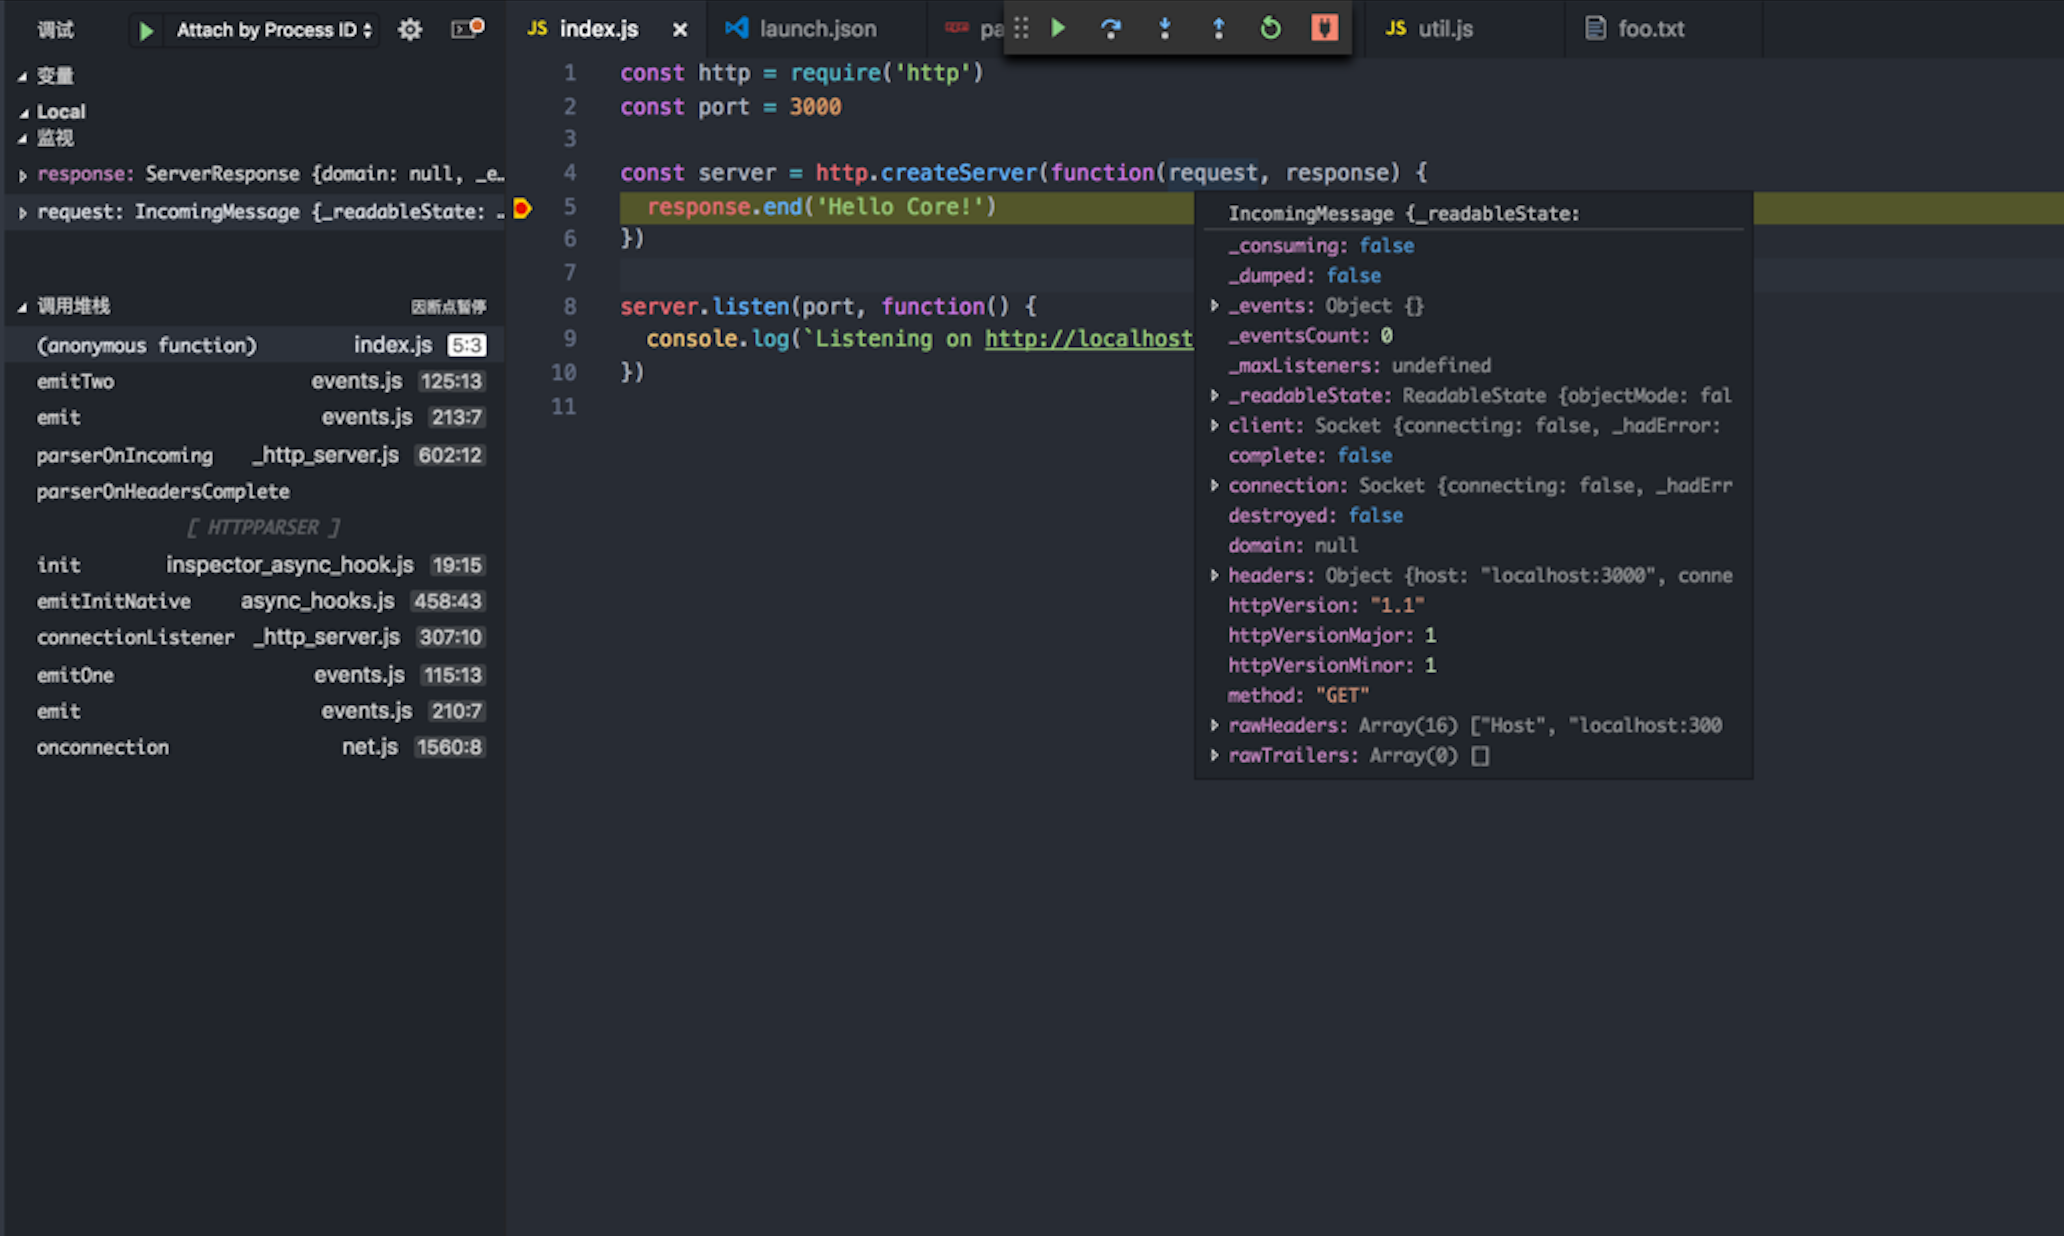
vscode debugging
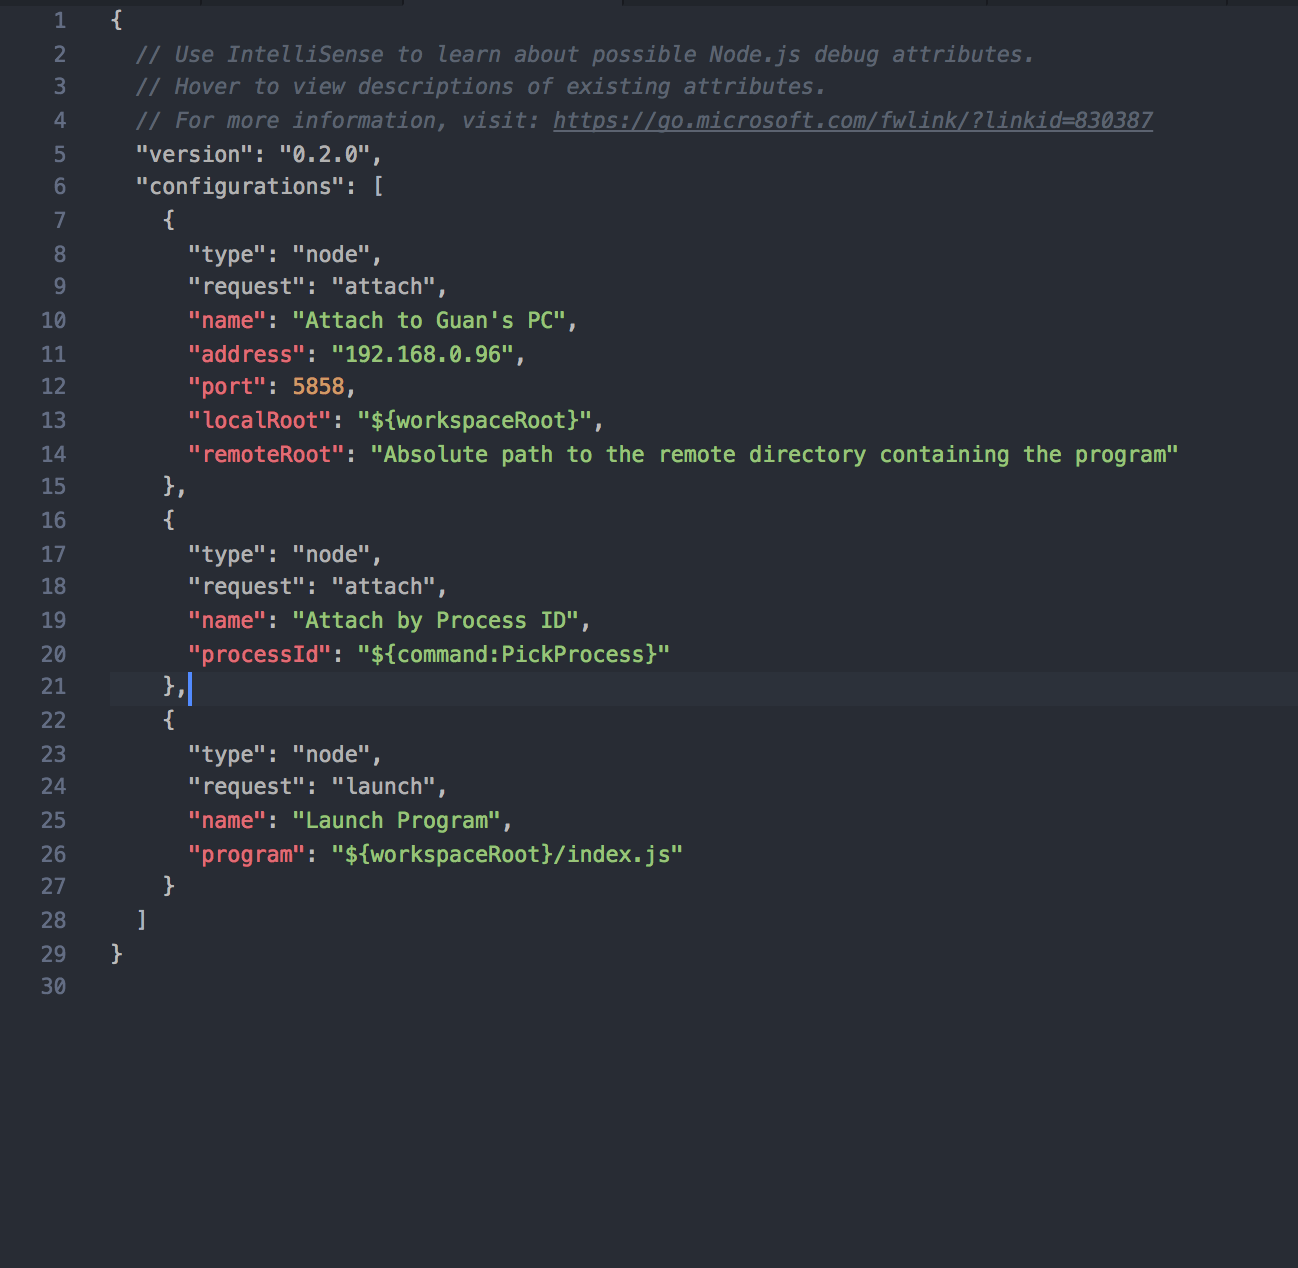
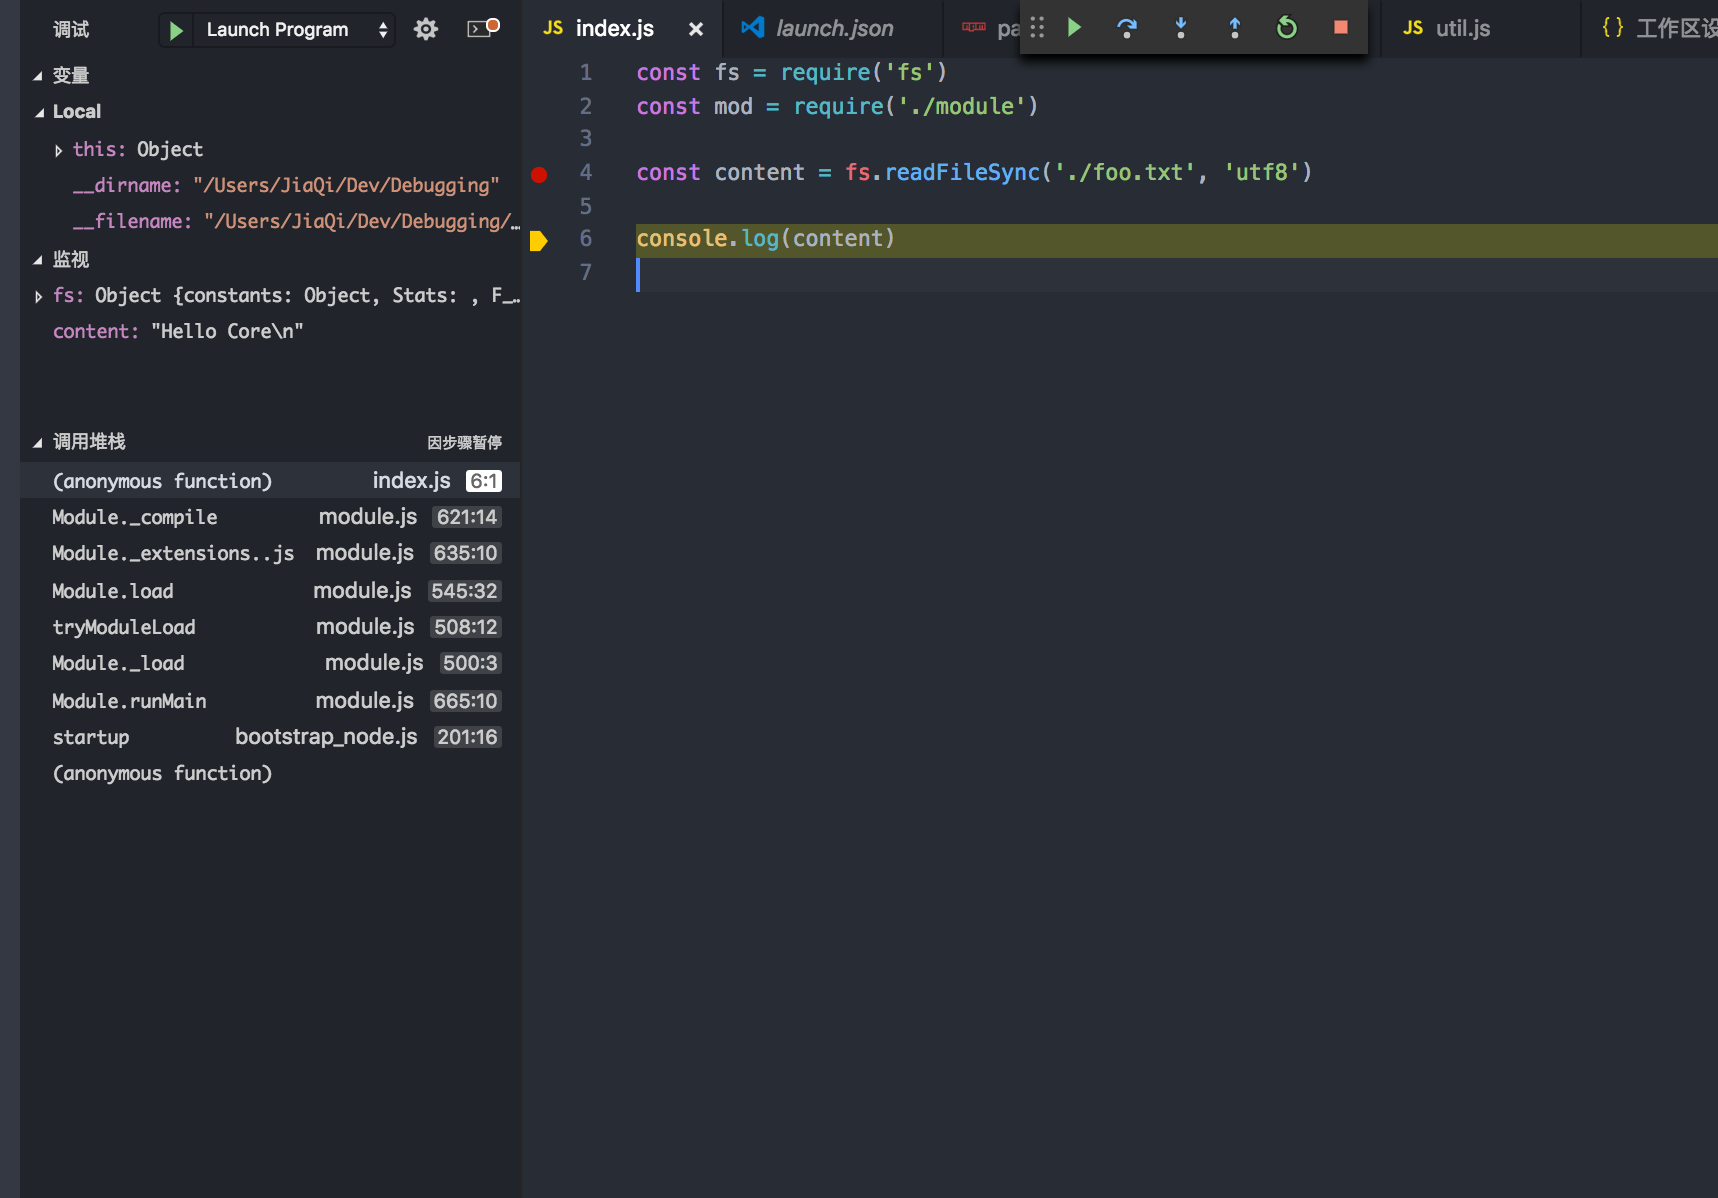
- add launch.json
- click vscode Launch
- hot breakpoint
- multiple mode
- easy to use
- more language support
e.g. python/c#/cpp/ts/coffee ...
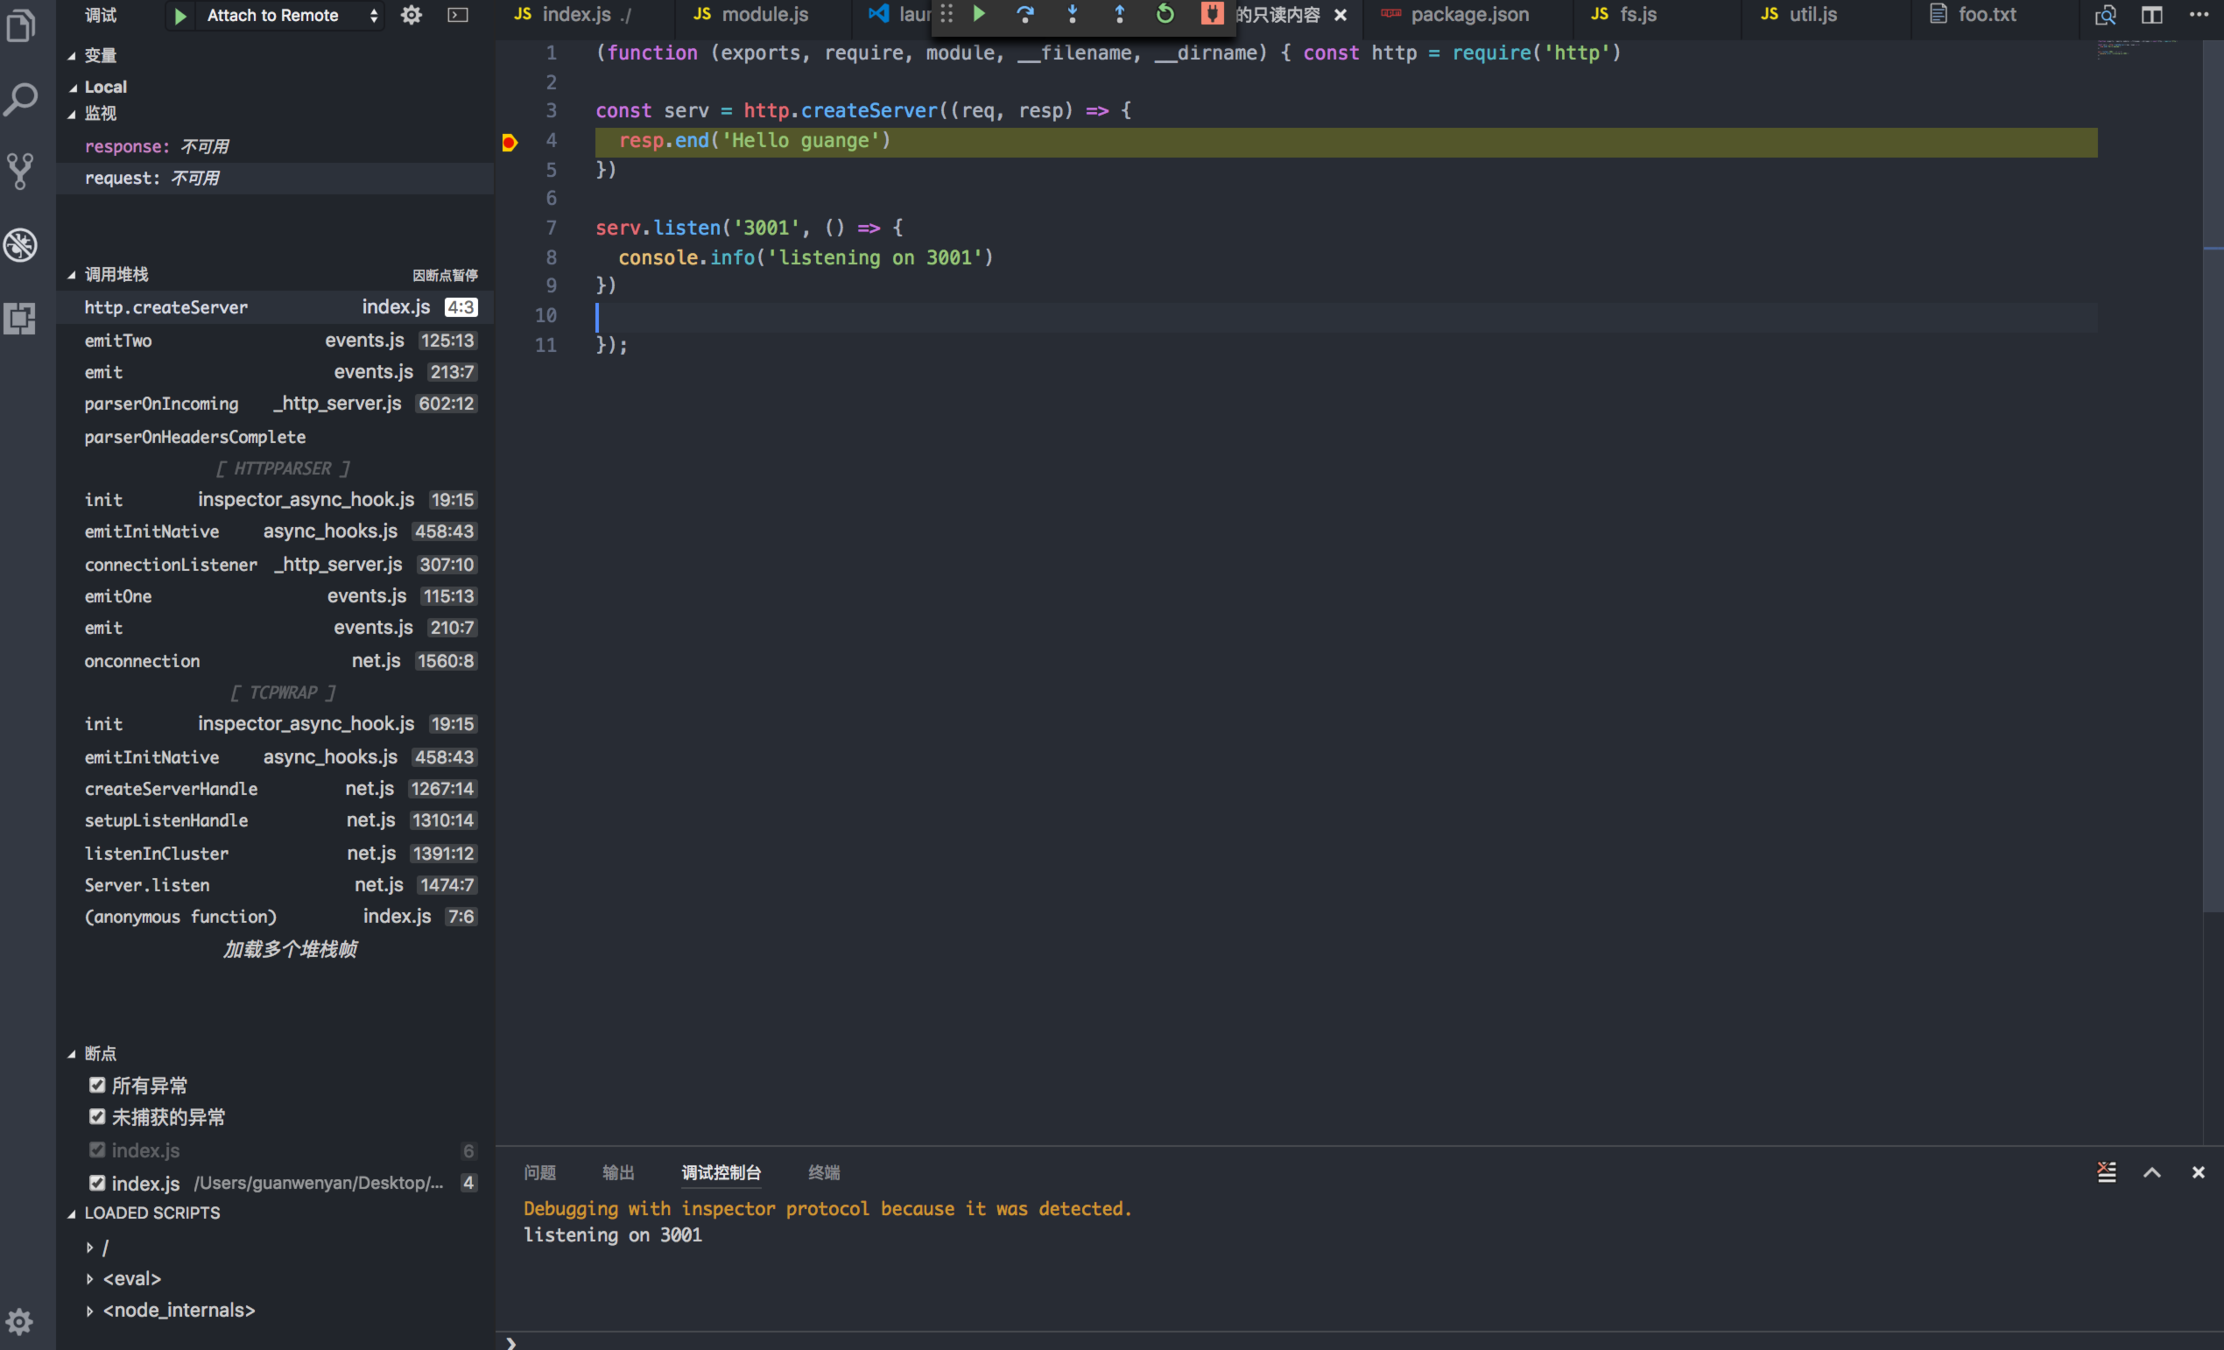
1. launch program directly
2. Attach by Process ID
3. Remote debugging
chrome
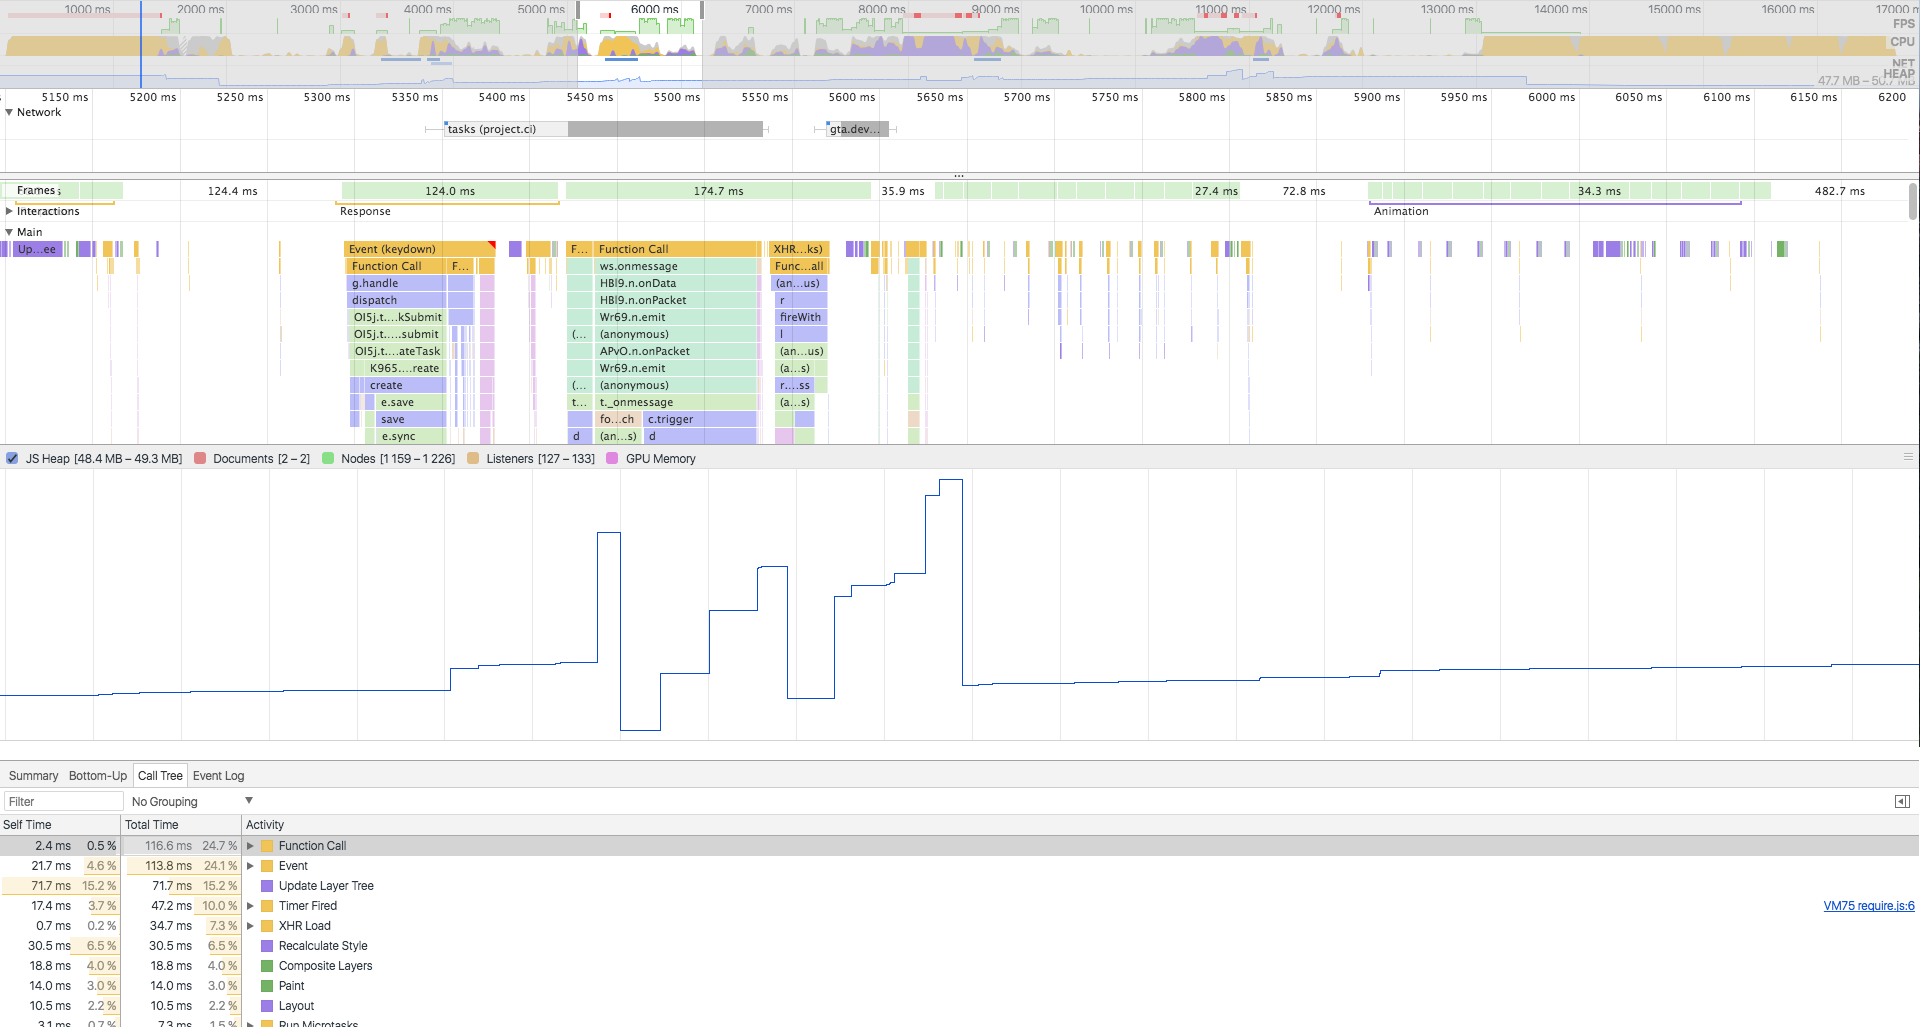
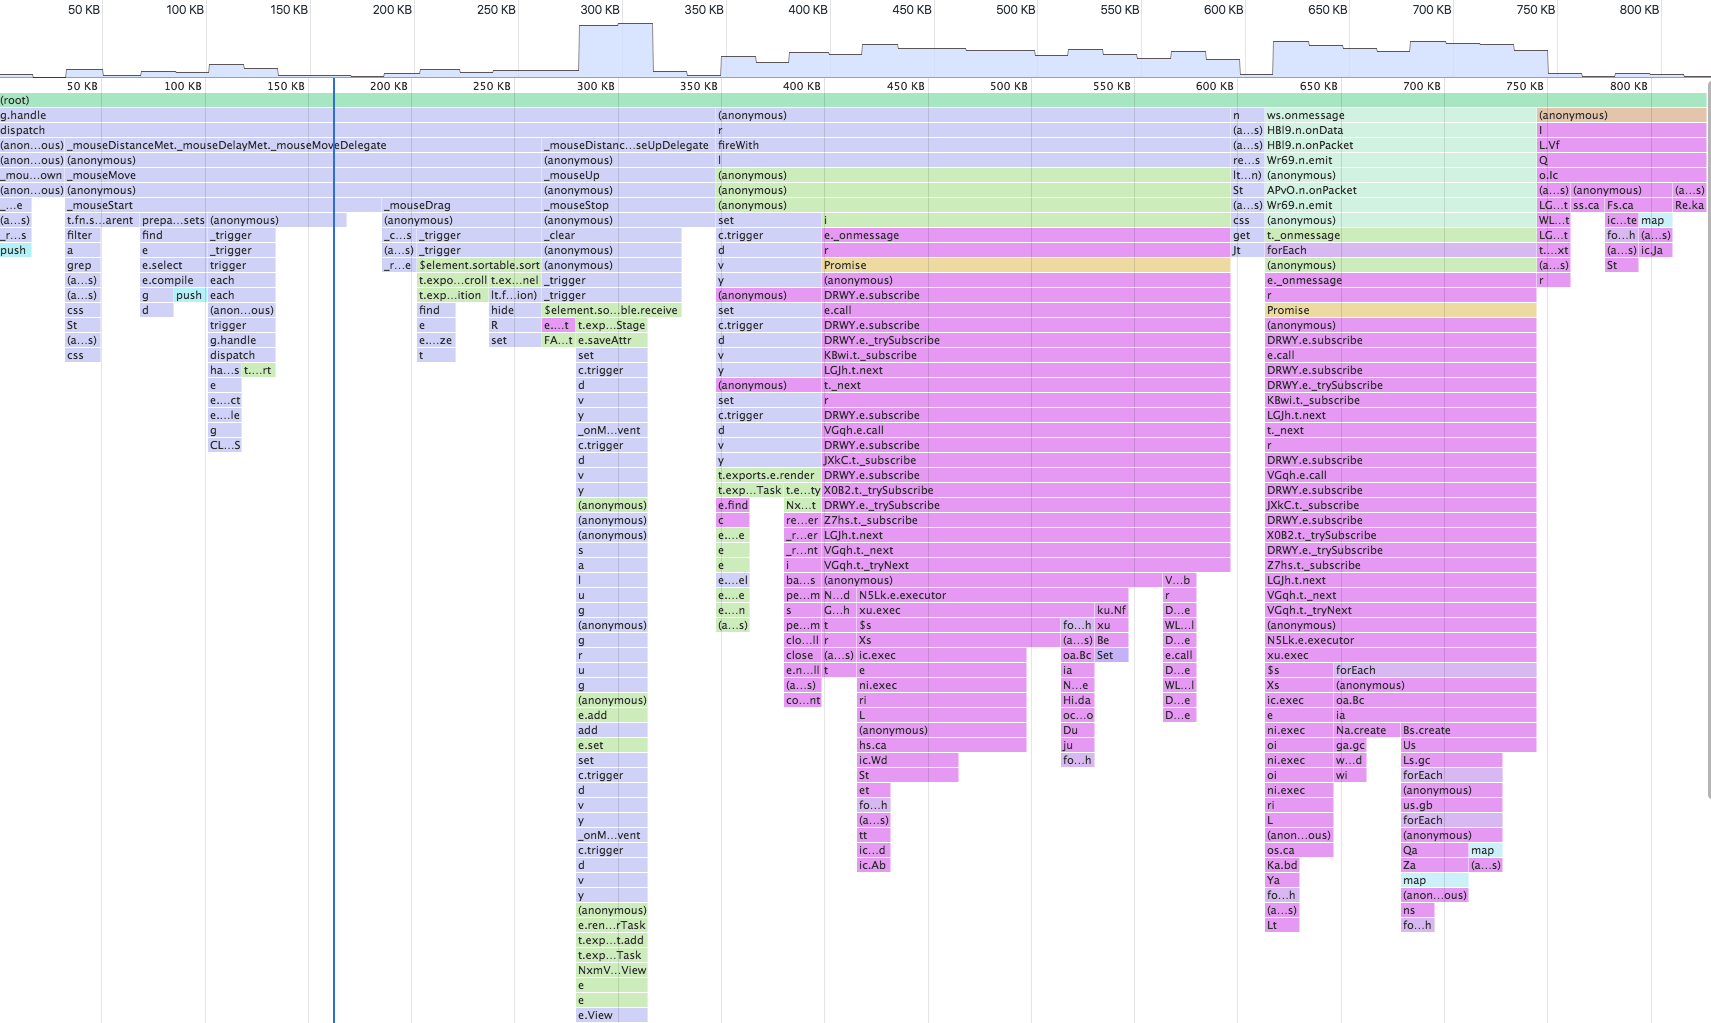
1.performance
2.network
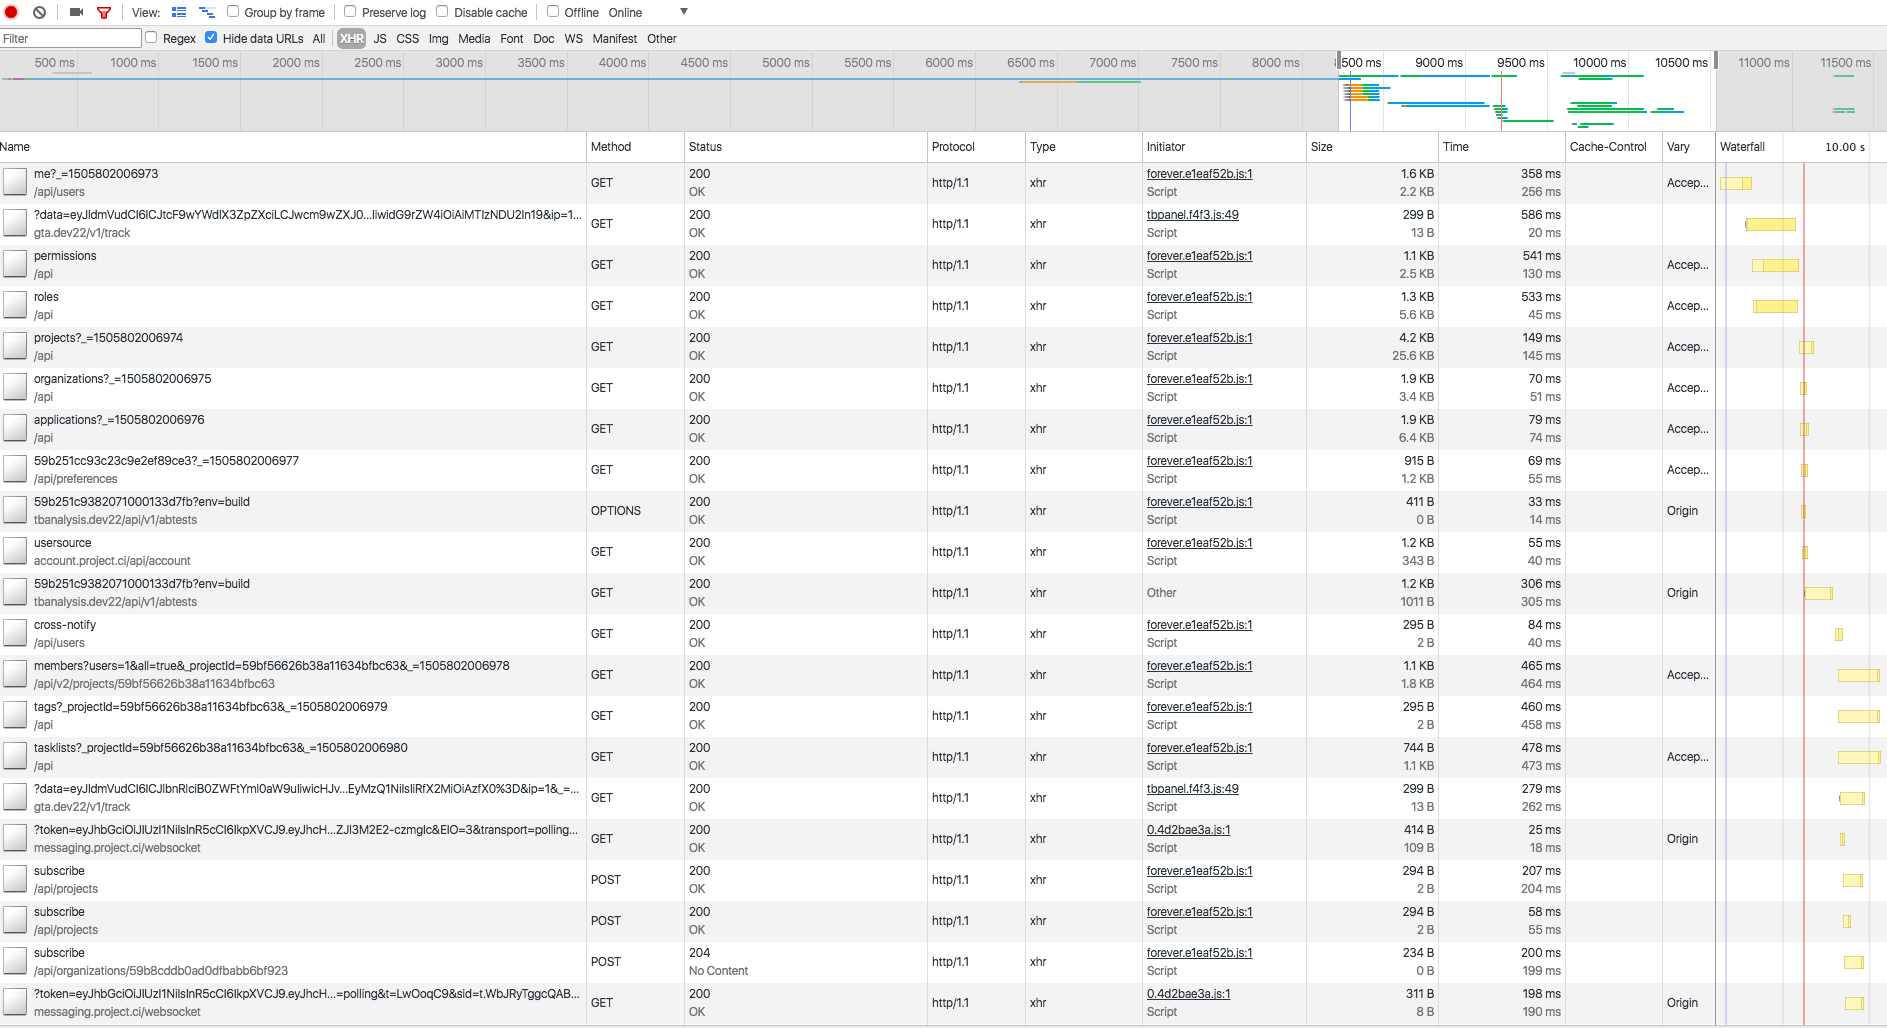
2.network
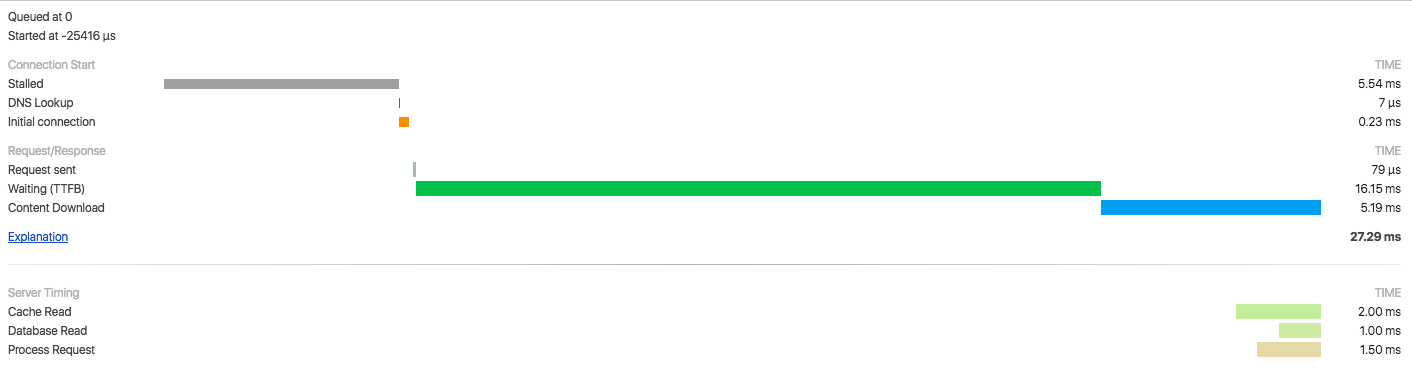
const http = require('http')
const port = 3000

const server = http.createServer(function(request, response) {
  response.setHeader('Server-Timing', `cache=2; "Cache Read", db=1; "Database Read", process=1.5; "Process Request"`)
  response.end('Hello Core!')
})

server.listen(port, function() {
  console.log(`Listening on http://localhost:${port}`)
})
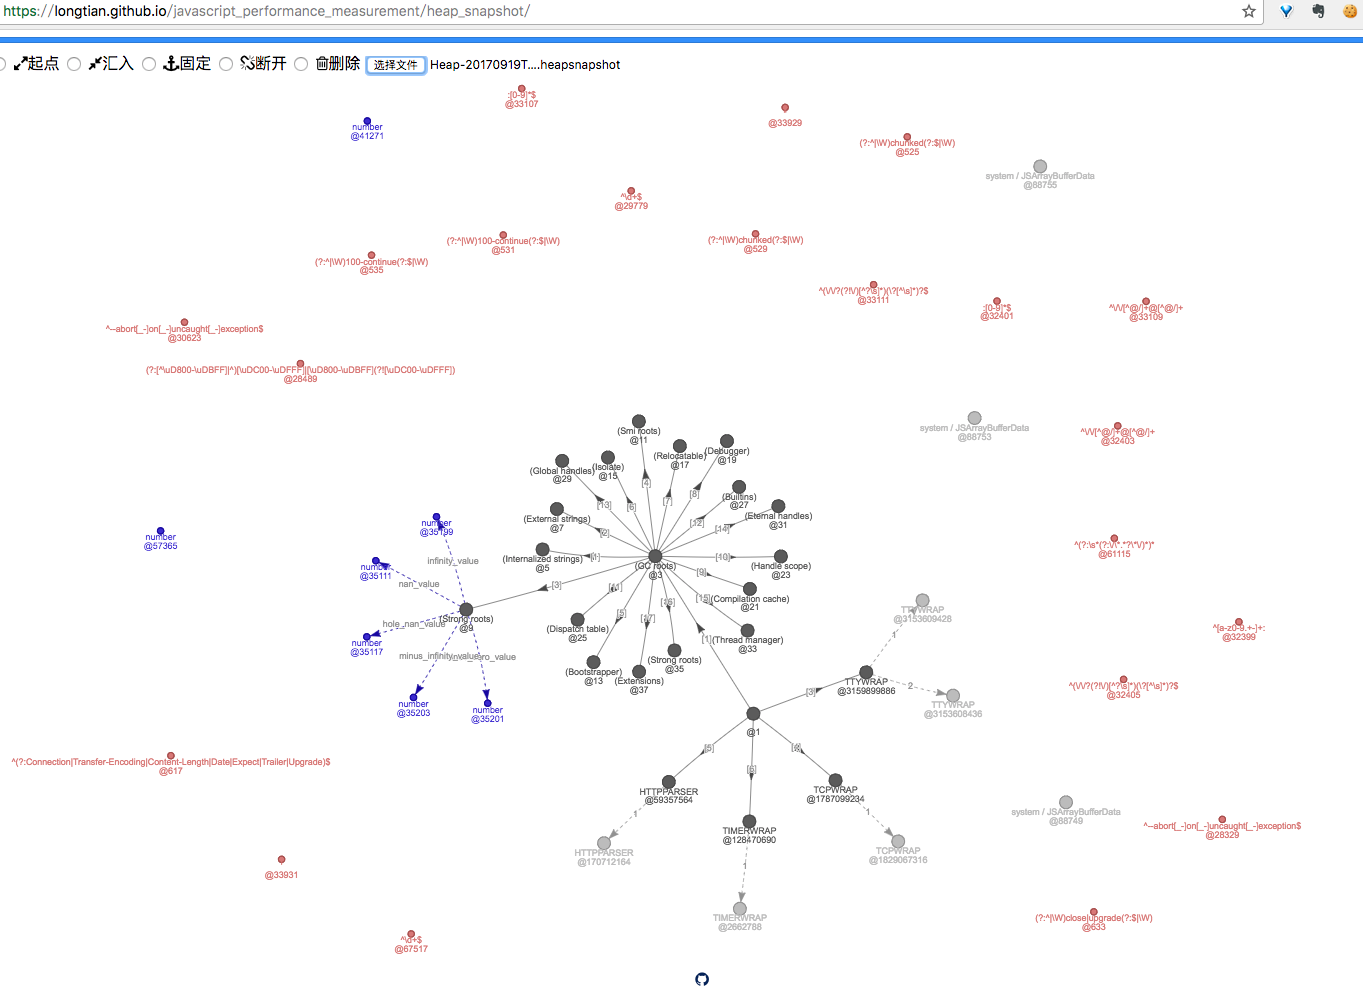
3.1 Memory Summary
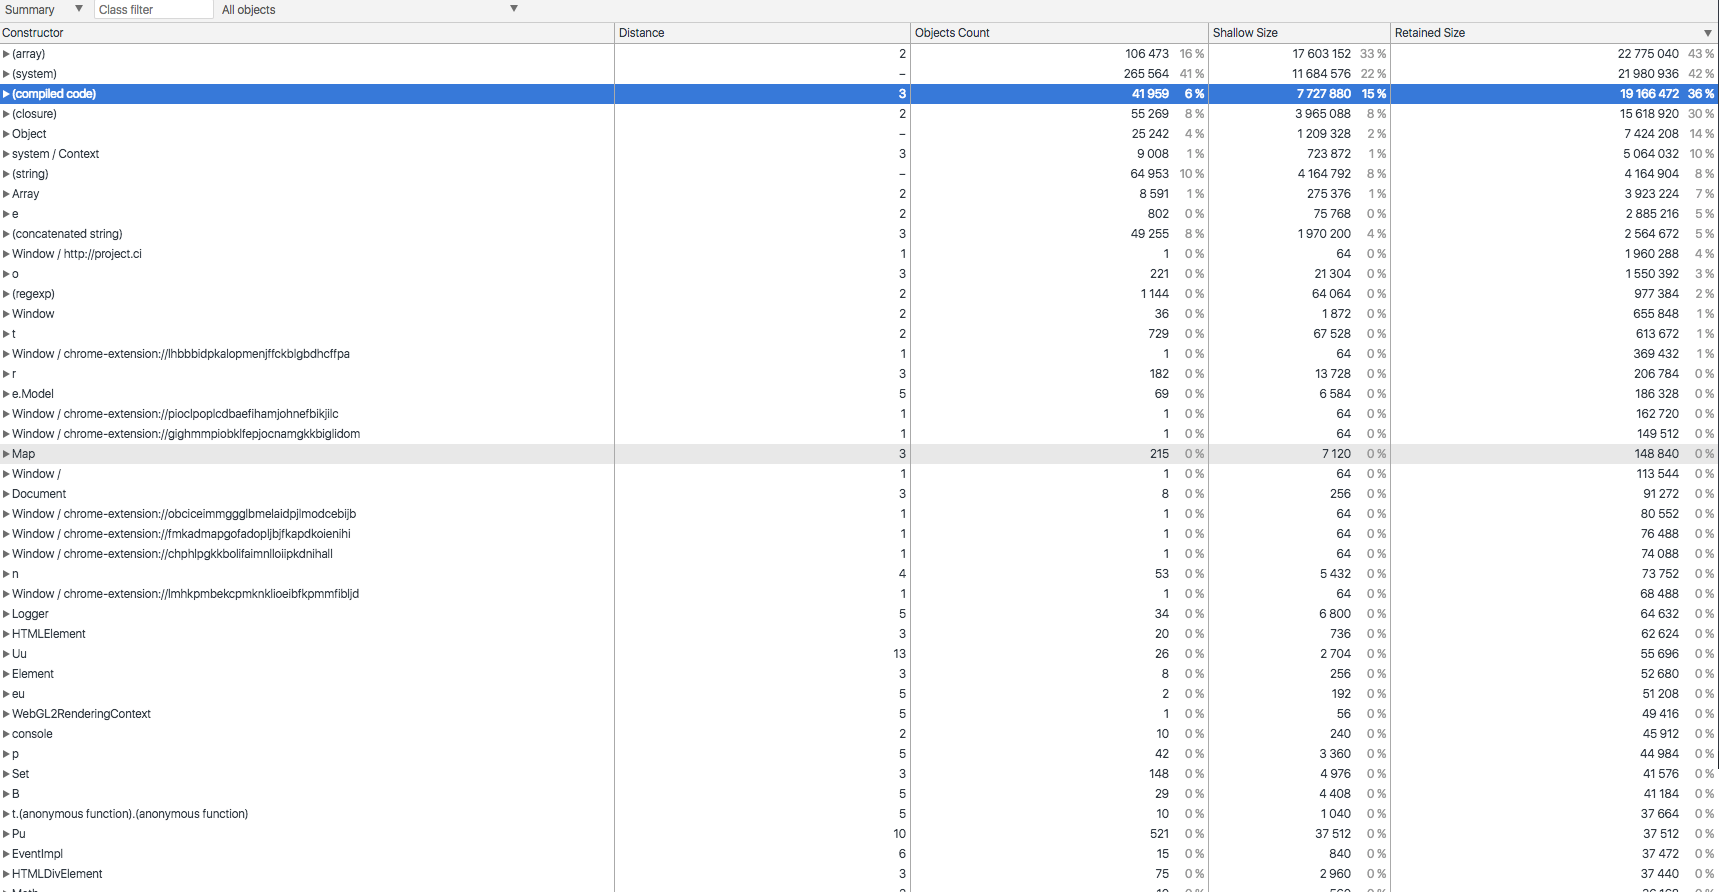
- Distance:ref 到 root 的距离
- Shallow Size: 直接占用内存
- Retained Size: 占用总内存
- Object count: 对象的实例数
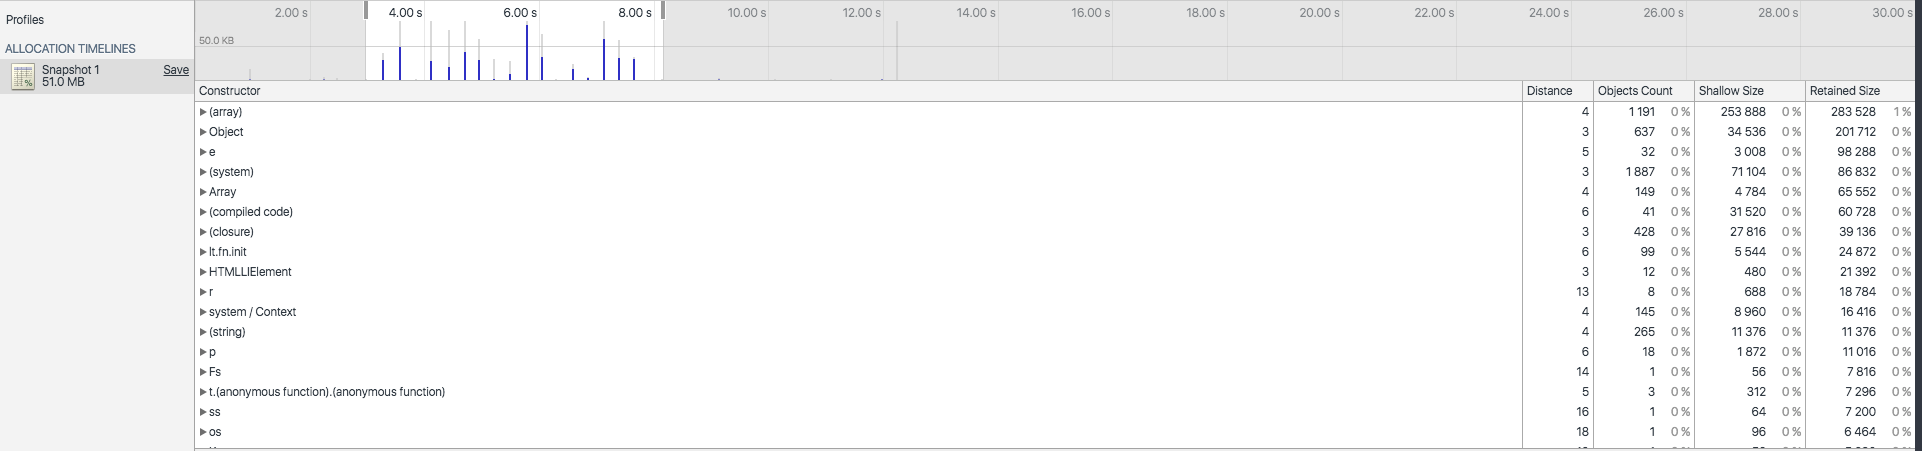
3.2 Profile allocation
3.3 Live chart
3.4 Other Tools
internal tools
chrome://about
dns
net-internal
tracing
上上下下左右左右ABAB
在这个界面按6下 shift 可以出现隐藏功能
CPU Profile
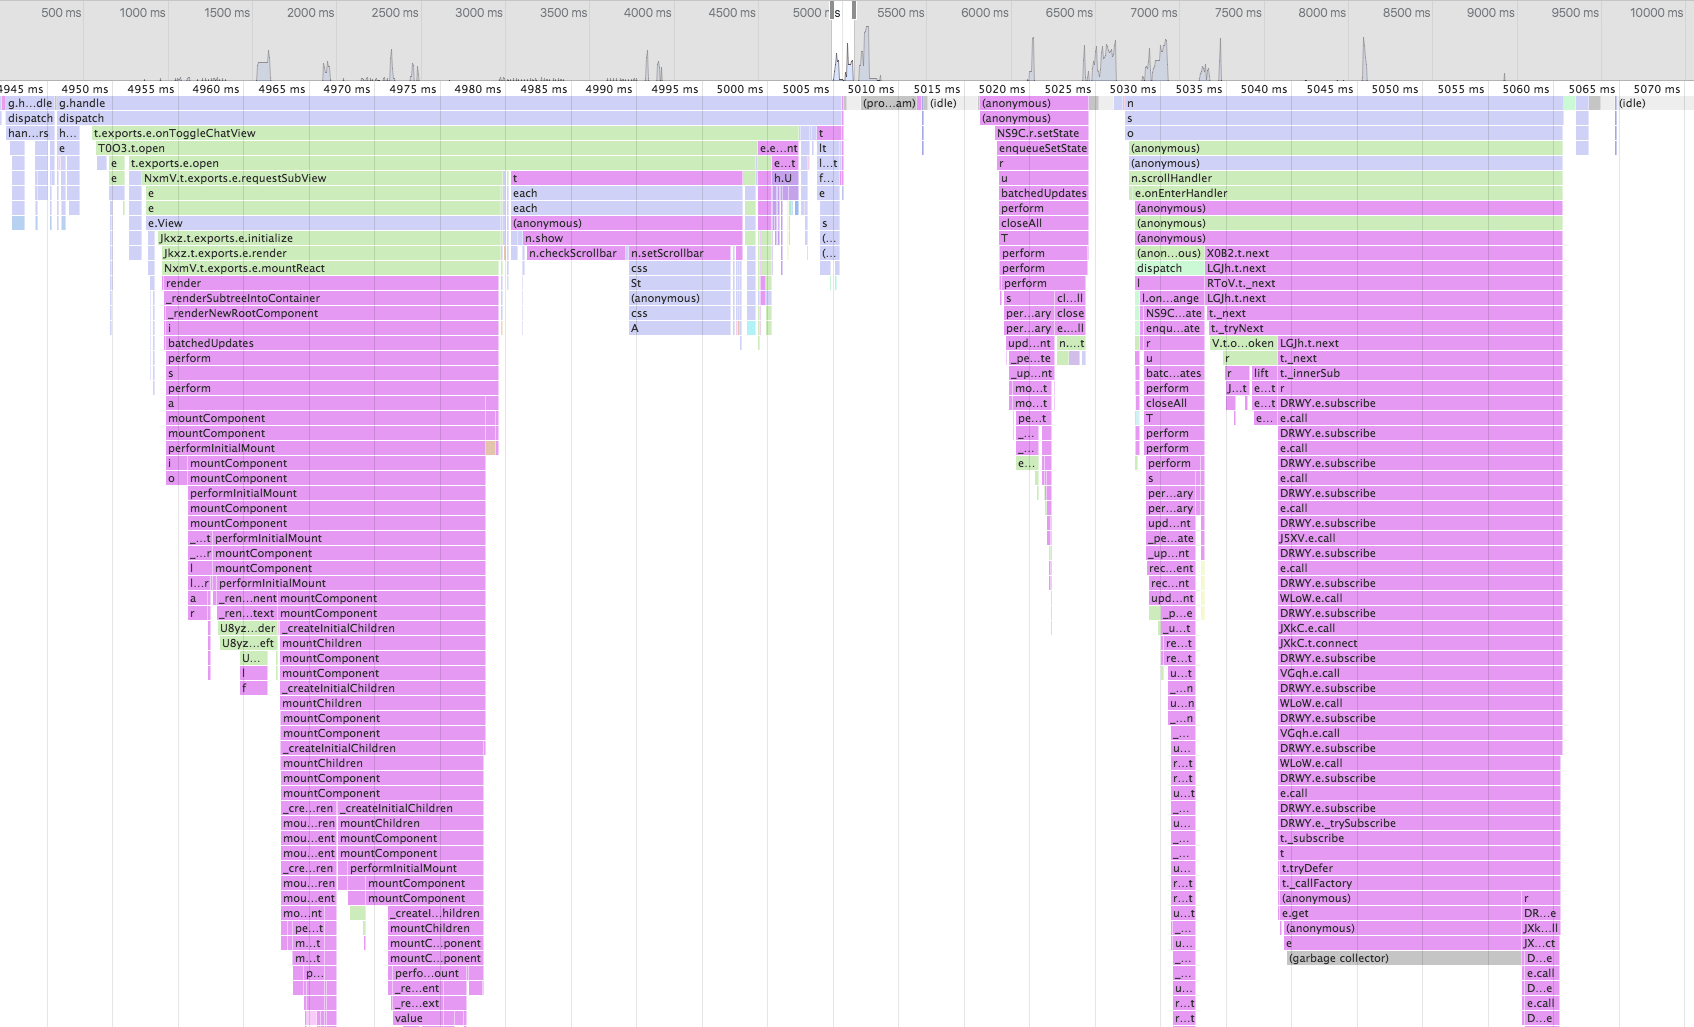
chrome 61 改了输出格式,所以市面上暂时没什么工具可以解析
否则可以用oneprofile这类文件可视化函数 call stack 同时显示 v8 deopz 原因,不过下一个版本 node 都换v8 引擎了,又有大批deopz的原因可以不用记了
setTimeout debugging
// ui debug only
// chrome only


setTimeout(function() {
  debugger
}, 10000)
console
- console.dir
- console.trace
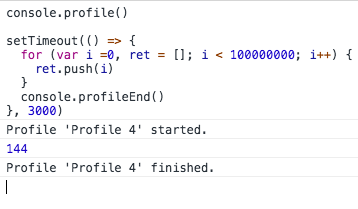
- console.profile
- console.time & console.timeEnd()
- store as temp vars
console.dir

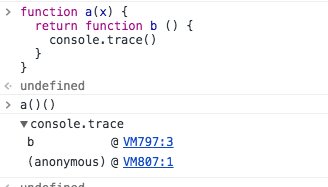
console.trace
console.profile