Analysis and Visualization of Large Complex Data with Tessera
Monash University
March 4th, 2016
Barret Schloerke
Purdue University
Deep Analysis of
Large Complex Data

http://wombat2016.org/slides/hadley.pdf
Deep Analysis of
Large Complex Data
Any or all of the following:
- Large number of records
- Many variables
- Complex data structures not readily put into tabular form of cases by variables
- Intricate patterns and dependencies
- require complex models and methods of analysis
- Not i.i.d.!
Often complex data is more of a challenge than large data, but most large data sets are also complex
Goals for
Analysis of Large Complex Data
- Work in familiar high-level statistical programming environment
- Have access to the 1000s of statistical, machine learning, and visualization methods
- Thinking
- Minimize thinking about code
- Minimize thinking about distributed systems
- Maximize thinking about the data
- Be able to analyze large complex data with nearly as much flexibility and ease as small data
What is Tessera?
- A high level R interface for analyzing complex data large and small
- Code is simple and consistent regardless of size
- Powered by statistical methodology Divide and Recombine (D&R)
- Provides access to 1000s of statistical, machine learning, and visualization methods
- Detailed, flexible, scalable visualization with Trelliscope

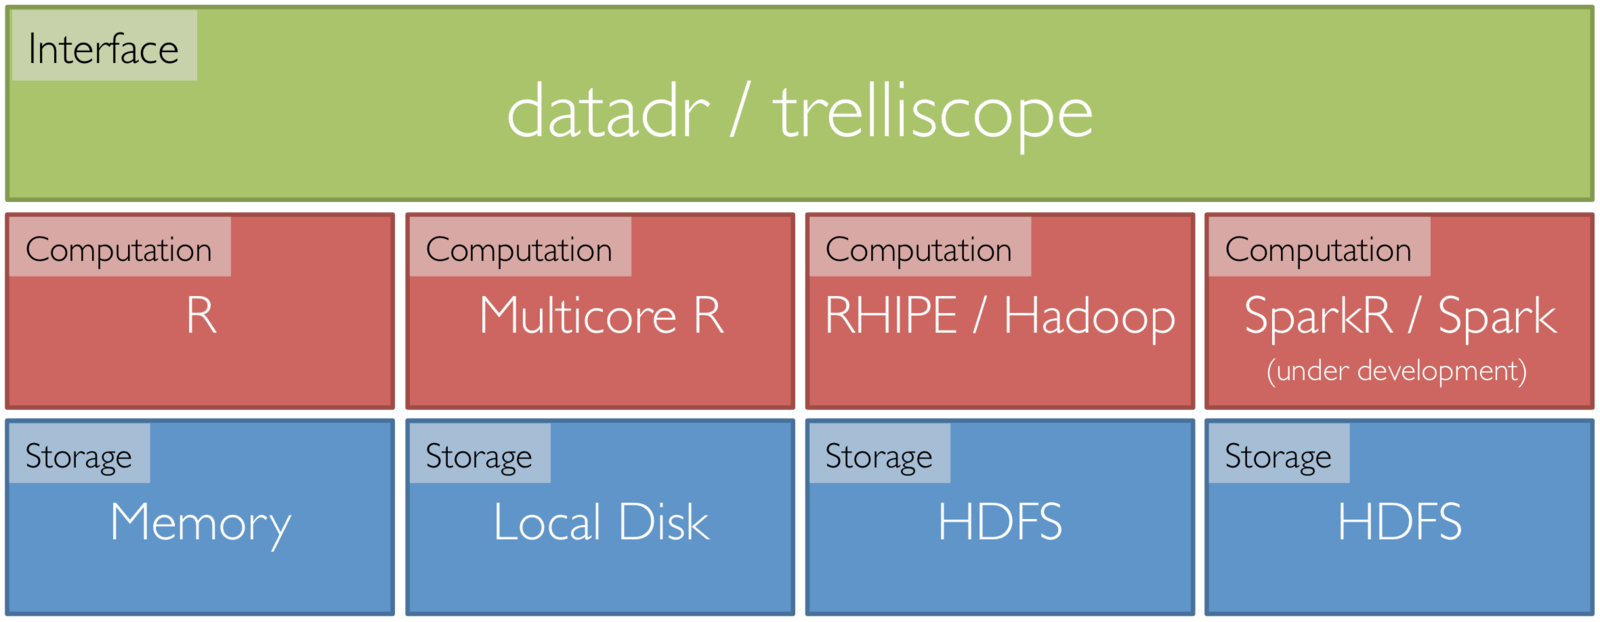
Tessera Environment
- Front end: two R packages, datadr & trelliscope
- Back ends: R, Hadoop, Spark, etc.
- R <-> backend bridges: RHIPE, SparkR, etc.
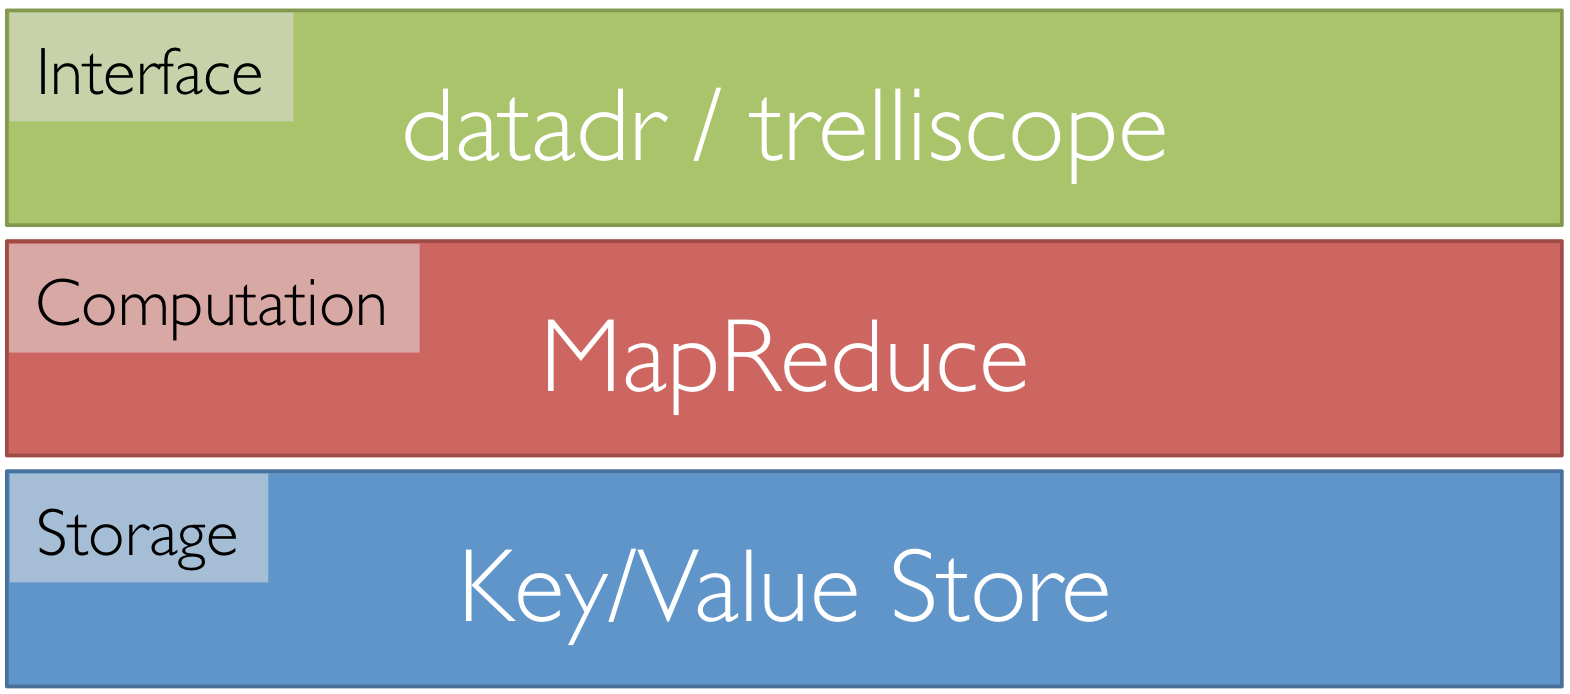
Back End Agnostic Interface
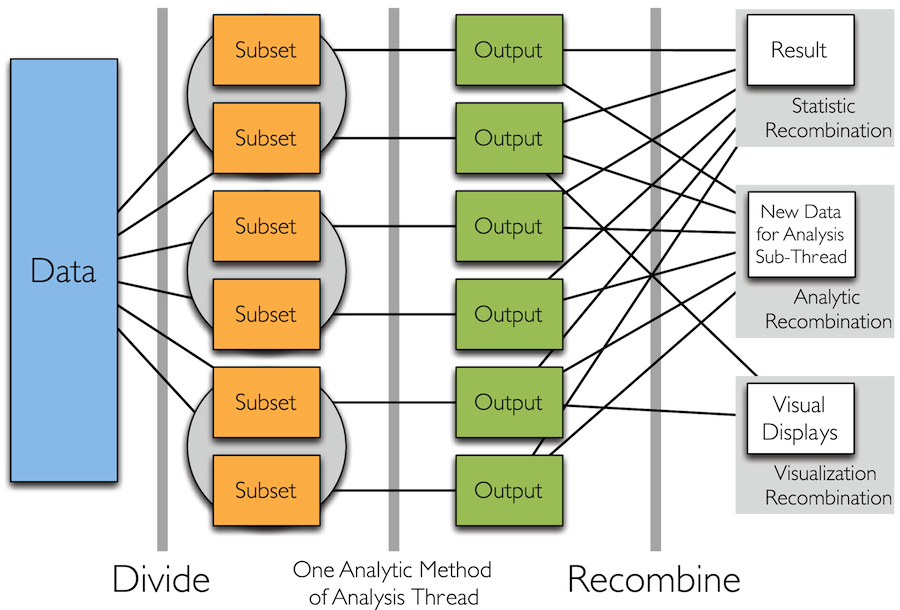
Divide and Recombine
- Specify meaningful, persistent divisions of the data
- Analytic or visual methods are applied independently to each subset of the divided data in embarrassingly parallel fashion
- Results are recombined to yield a statistically valid D&R result for the analytic method
-
plyr "split apply combine" idea over multiple machines
- http://vita.had.co.nz/papers/plyr.pdf
Divide and Recombine
Visual Recombination: Trelliscope
-
Most tools and approaches for big data either
- Summarize lot of data and make a single plot
- Are very specialized for a particular domain
- Summaries are critical
- But we must be able to visualize complex data in detail even when they are large!
- Trelliscope does this by building on Trellis Display
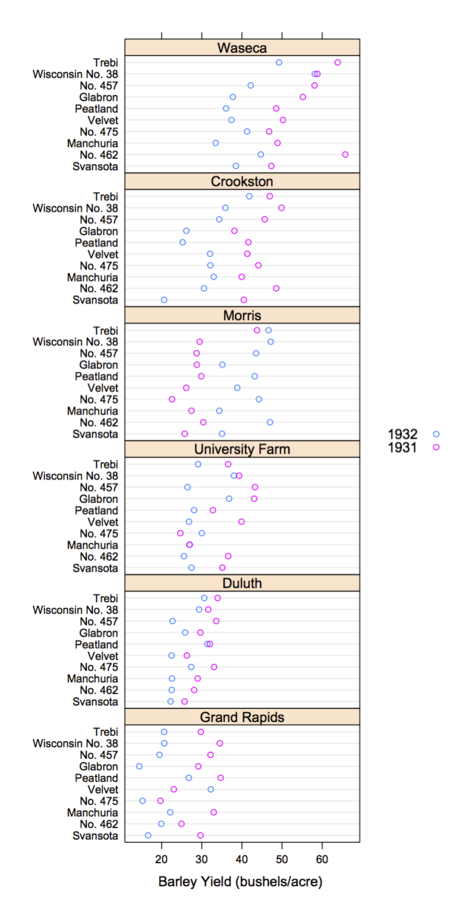
Trellis Display
- Data are split into meaningful subsets, usually conditioning on variables of the dataset
- A visualization method is applied to each subset
- The image for each subset is called a "panel"
- Panels are arranged in an array of rows, columns, and pages, resembling a garden trellis
Scaling Trellis
-
Big data lends itself nicely to the idea of small multiples
- small multiple: series of similar graphs or charts using the same scale + axes, allowing them to be easily compared
- Typically "big data" is big because it is made up of collections of smaller data from many subjects, sensors, locations, time periods, etc.
- Potentially thousands or millions of panels
- We can create millions of plots, but we will never be able to (or want to) view all of them!
Scaling Trellis
-
To scale, we can apply the same steps as in Trellis display, with one extra step:
- Data are split into meaningful subsets, usually conditioning on variables of the dataset
- A visualization method is applied to each subset
- A set of cognostic metrics is computed for each subset
- Panels are arranged in an array of rows, columns, and pages, resembling a garden trellis, with the arrangement being specified through interactions with the cognostics
Trelliscope
-
Extension of multi-panel display systems, e.g. Trellis Display or faceting in ggplot
-
Number of panels can be very large (in the millions)
-
Panels can be interactively navigated through the use of cognostics (each subset's metrics)
-
Provides flexible, scalable, detailed visualization of large, complex data
Trelliscope is Scalable
- 6 months of high frequency trading data
- Hundreds of gigabytes of data
- Split by stock symbol and day
- Nearly 1 million subsets
Tessera
Tessera is an implementation of D&R built on R
- Front end R packages that can tie to scalable back ends:
- trelliscope: visual recombination through interactive multipanel exploration with cognostics
- datadr: provides an interface to data operations, division, and analytical recombination methods
datadr vs. dplyr
- dplyr
- "A fast, consistent tool for working with data frame like objects, both in memory and out of memory"
- Provides a simple interface for quickly performing a wide variety of operations on data frames
- Often datadr is confused as a dplyr alternative or competitor
- There are some similarities:
- Both are extensible interfaces for data anlaysis / manipulation
- Both have a flavor of split-apply-combine
datadr vs. dplyr
-
Back end architecture:
- dplyr ties to SQL-like back ends
- datadr ties to key-value stores
-
Scalability:
- At scale, dplyr is a wrapper to SQL (all computations must be translatable to SQL operations - no R code)
- datadr's fundamental algorithm is MapReduce, which scales to extremely large volumes and allows ad hoc R code to be applied
-
Flexibility: dplyr data must be tabular while datadr data can be
any R data structure - Speed: dplyr will probably always be faster because its focused set of operations are optimized and usually applied against indexed databases whereas MapReduce always processes the entire data set
Differences
dplyr is great for subsetting, aggregating medium tabular data
datadr is great for scalable deep analysis of large, complex data
For more information (docs, code, papers, user group, blog, etc.): http://tessera.io
More Information
- website: http://tessera.io
- code: http://github.com/tesseradata
- @TesseraIO
- Google user group
-
Try it out
- If you have some applications in mind, give it a try!
- You don’t need big data or a cluster to use Tessera
- Ask us for help, give us feedback
Original Slides: http://slides.com/hafen/tessera-qut2016