Data Aggregation and Visualization with D3.js
A Bachelor Thesis by Sebastian Schrepfer
Overview
-
What is it all about?
-
Introduction
-
BitTorrent Basics
-
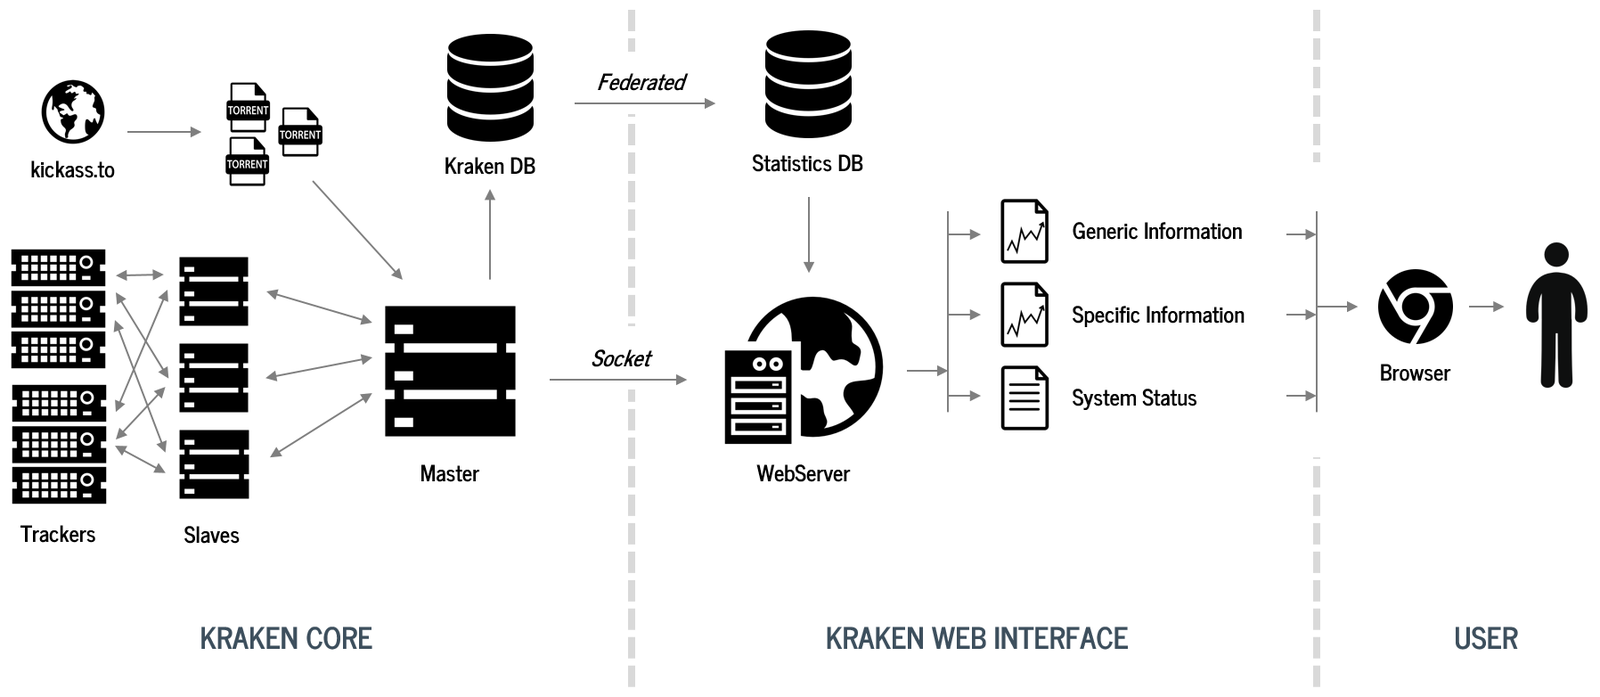
The Kraken Software
-
-
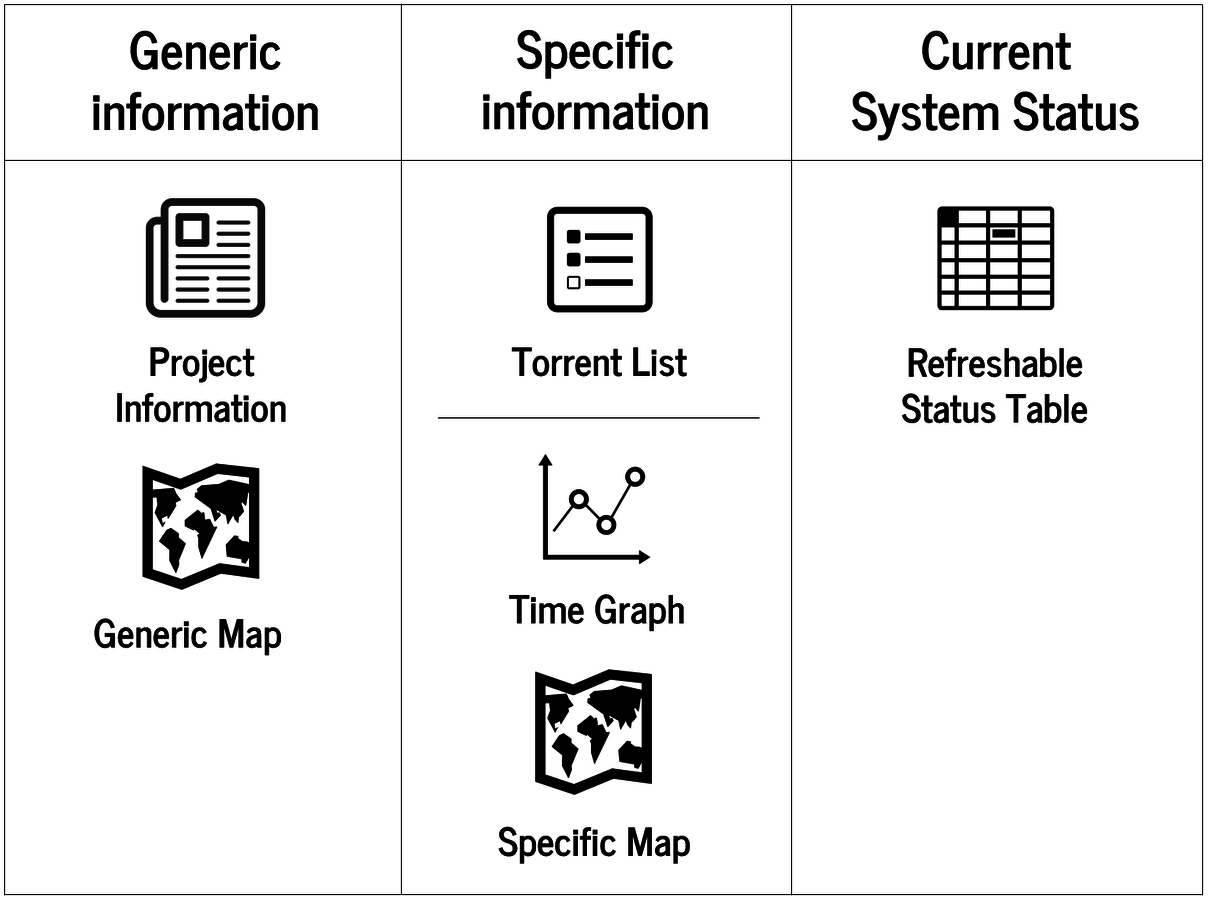
Kraken Web Interface
-
Data Aggregation
-
Data Visualization
-
-
Demonstration
live slides: http://goo.gl/uyJThr

}
}
previous work
my work
What is it all about?

Gathered data from BitTorrent network (geo located IPs) with duplicates and unsuitable
data structure
1
2


Data optimized for visualization;
redunancy removed
Web Interface with Visualizations on map and time graph
BitTorrent Basics


Hangover.1080p.mkv

Hangover.1080p.torrent

BitTorrent Portal Website

Hangover.
1080p.torrent
contains BitTorrent tracker URL
User A

BitTorrent Tracker
List of IP addresses of other peers
User A
User B
Hangover.1080p.mkv
User C
The Kraken Software
Kraken
BitTorrent Trackers

BitTorrent Portal Website
Multiple lists of IP addresses of peers

Multiple torrent files
1
2

Geo Localization

Database
Lists of IP addresses
Web Interface
Data Aggregation
18.12.2014 | Prisoners | 100.5.5.5 | CH
18.12.2014 | Prisoners | 92.21.1.4 | DE
18.12.2014 | Prisoners | 100.5.5.5 | CH
18.12.2014 | Prisoners |  81.1.1.5 | CH
18.12.2014 | Prisoners | 100.5.5.5 | CH
18.12.2014 | Prisoners | 100.5.5.5 | CH
18.12.2014 | Prisoners | 100.5.5.5 | CH
18.12.2014 | Taxi      |  81.1.1.5 | CH
18.12.2014 | Taxi      | 92.21.1.4 | DE
18.12.2014 | Taxi      | 92.21.1.4 | DE
18.12.2014 | Taxi      | 1.23.3.55 | FR
18.12.2014 | Taxi      | 1.23.3.55 | FR
18.12.2014 | Taxi      | 92.21.1.4 | DE
18.12.2014 | Taxi      | 92.21.1.4 | DE
18.12.2014 | Prisoners | 100.5.5.5 | CH
18.12.2014 | Prisoners | 92.21.1.4 | DE
18.12.2014 | Prisoners | 81.1.1.5 | CH
18.12.2014 | Taxi | 81.1.1.5 | CH
18.12.2014 | Taxi | 92.21.1.4 | DE
18.12.2014 | Taxi | 1.23.3.55 | FR18.12.2014 | Prisoners | CH | 2
18.12.2014 | Prisoners | DE | 1
18.12.2014 | Taxi | CH | 1
18.12.2014 | Taxi | DE | 1
18.12.2014 | Taxi | FR | 118.12.2014 | CH | 2
18.12.2014 | DE | 1
18.12.2014 | FR | 1SPECIFIC INFORMATION
GENERIC INFORMATION
KRAKEN CORE DB
Visualized content is easier to understand.
Visualizations. Why?
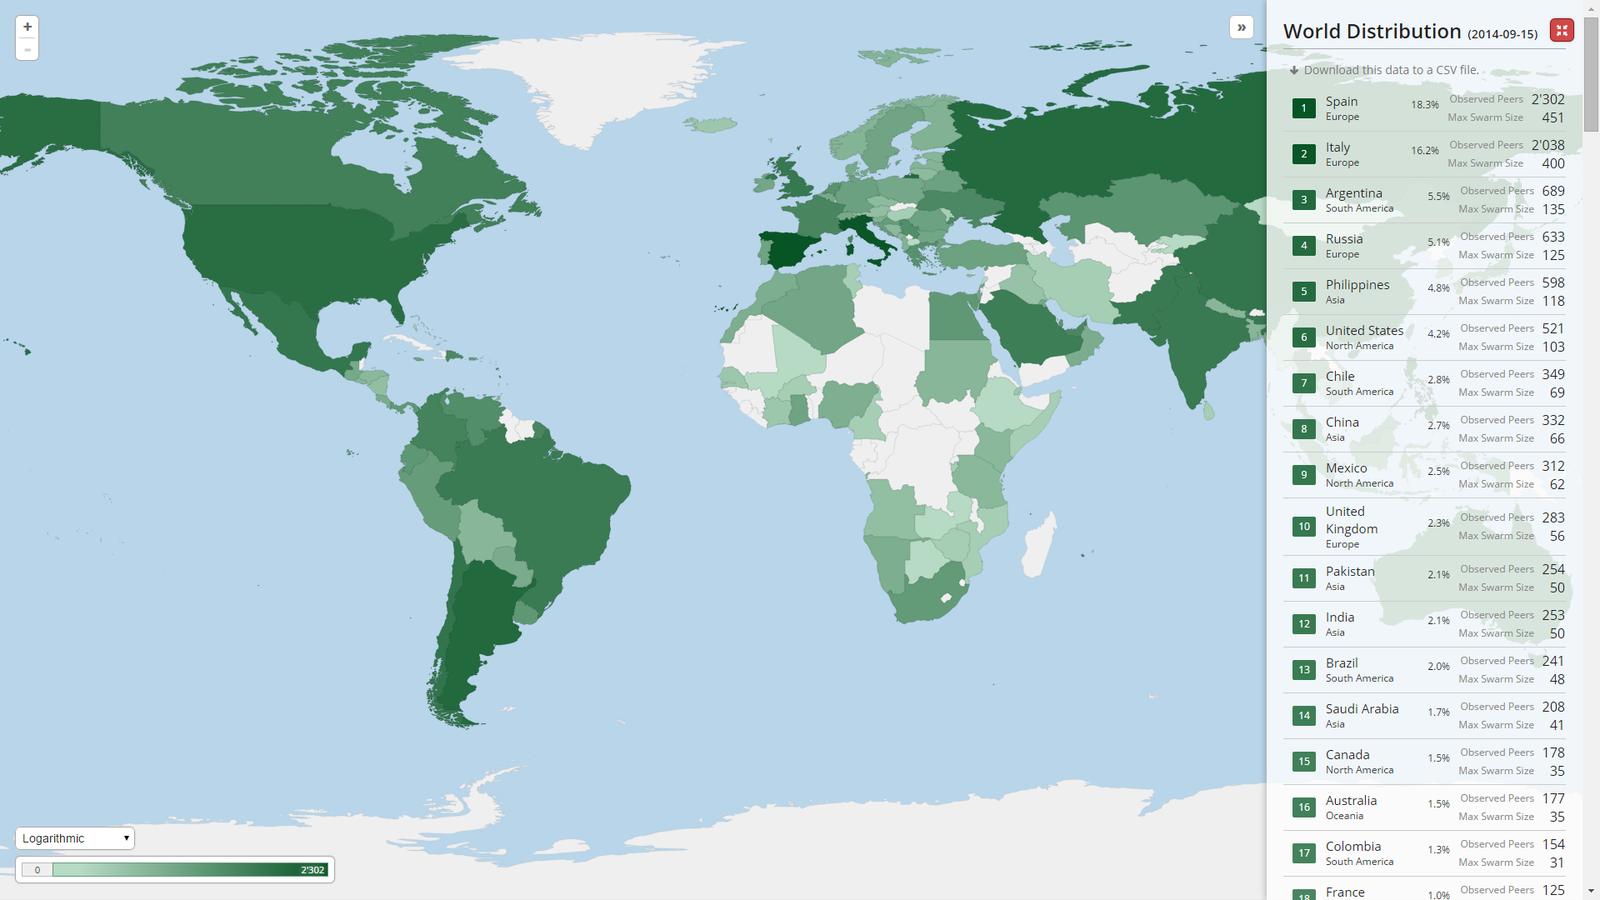
country_iso_code | observed_peers
---------------------------------
 ES              |          2302
 IT              |          2038
 AR              |           689
 RU              |           633
 PH              |           598
 US              |           521
 CL              |           349
 CN              |           332
 MX              |           312
 GB              |           283
 PK              |           254
 IN              |           253
 BR              |           241
 SA              |           208
 CA              |           178
 AU              |           177
 CO              |           154
 FR              |           125
 AE              |           120
 UA              |           112
 DO              |           108
 TW              |            94
 JP              |            84
                 |
        ...      |     ...
Data Driven Documents: D3.js
JavaScript library for manipulating documents based on data.
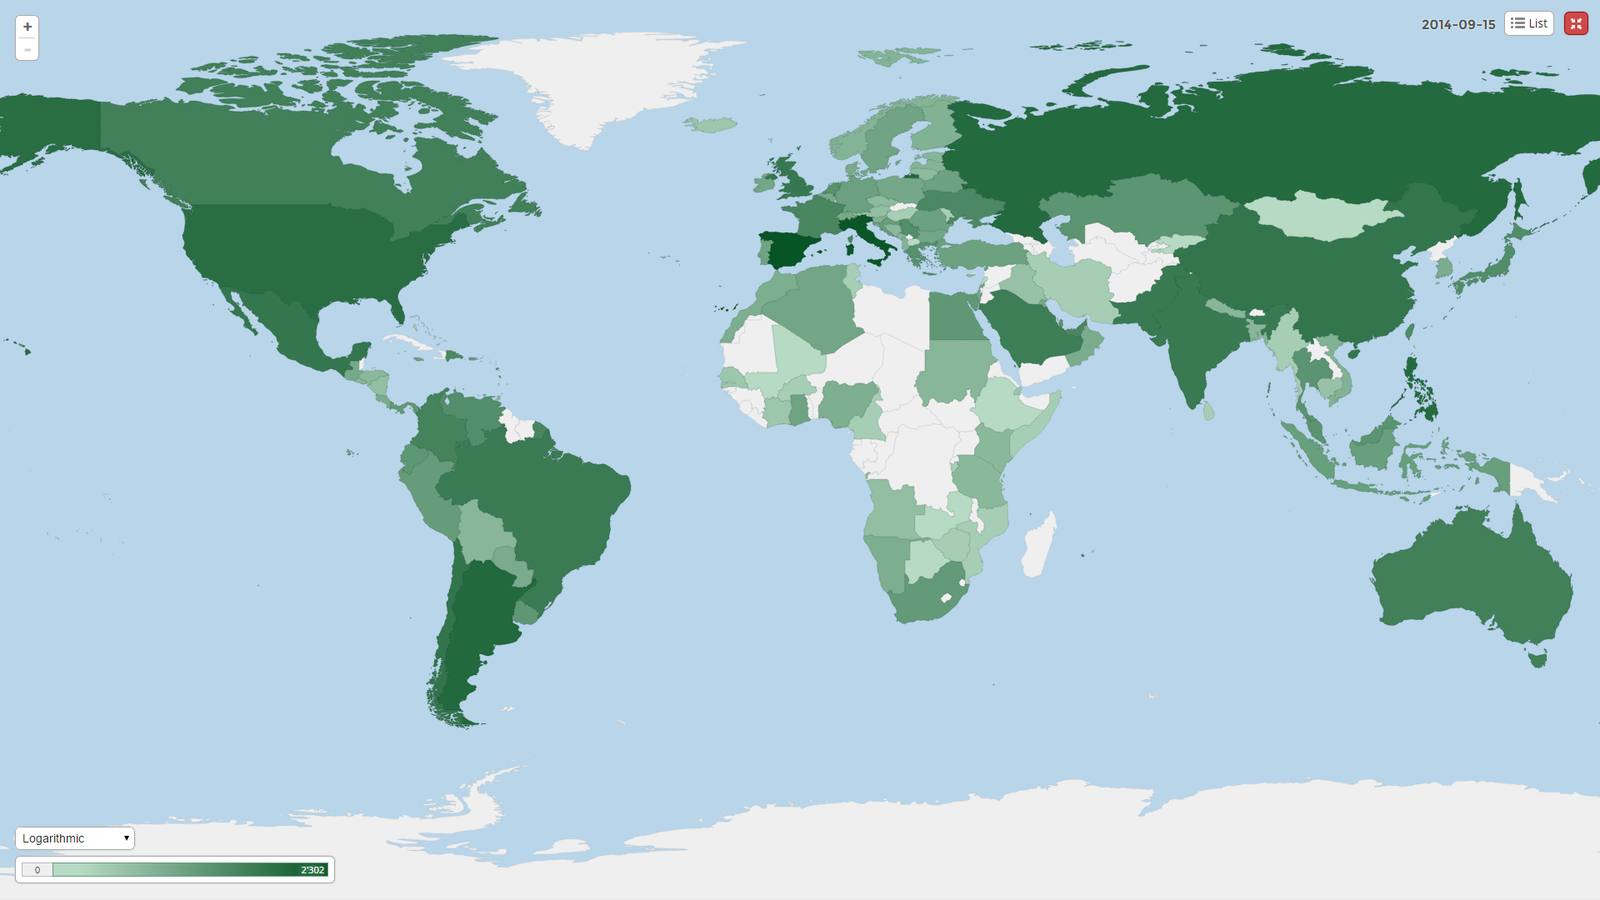
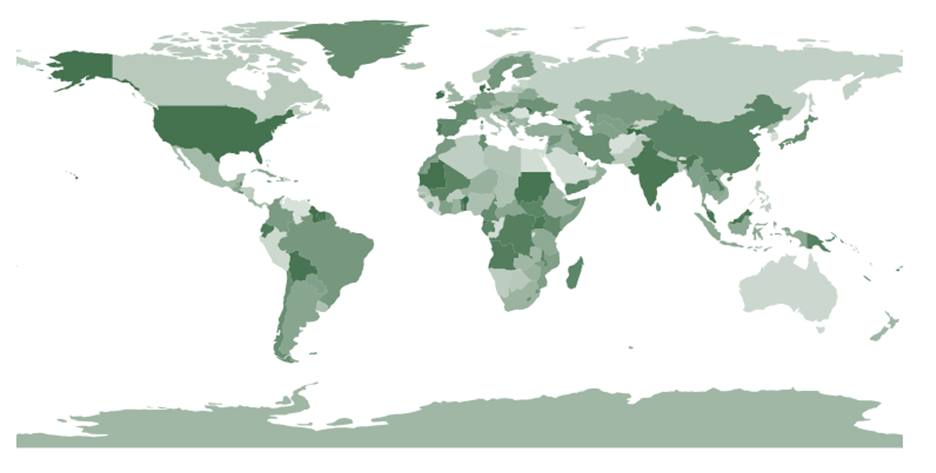
Map Visualization with D3.js
- Raw data from Shapefile to TopoJSON
- Visualizing TopoJSON data with D3.js and TopoJSON library
- Merging map and database data
Map Visualization with D3.js
Map Visualization with D3.js
- Raw data from Shapefile to TopoJSON
- Visualizing TopoJSON data with D3.js and TopoJSON library
- Merging map and database data
- Adding additional map features, which are not supported by D3.js
Drawbacks of D3.js (map)
- No Support for Zoom Buttons, only mouse zoom support.
- No Support for dragging boundaries.
- No support for window size changes (or fullscreen mode)
- In general, low-level framework, but with support for several complex functionalities (e.g. creating maps in 2D and 3D)
Time Chart with C3.js
Drawbacks of D3.js (map)
- No Support for Zoom Buttons, only mouse zoom support.
- No Support for dragging boundaries.
- No support for window size changes (or fullscreen mode)
- In general, low-level framework, but with support for several complex functionalities (e.g. creating maps in 2D and 3D)
The Web Interface
Final Result

Demonstration
Appendix
Data Aggregation: SQL
DELIMITER $$
CREATE EVENT `CREATE_DAILY_STATISTICS`
ON SCHEDULE EVERY 1 DAY STARTS '2014-09-30 00:03:00'
DO BEGIN

   -- yesterday's date
   SET @QUERYDATE = DATE(DATE_SUB(NOW(), INTERVAL 1 DAY));

   INSERT INTO `kraken-statistics`.statistics_peers
      (ip_address, country_iso_code, info_hash, date)

      (SELECT PEERS.IP_ADDRESS AS ip_address,
         PEERS.COUNTRY AS country_iso_code,
         ANNOUNCE_RESULT.INFO_HASH AS info_hash,
         @QUERYDATE AS date

      FROM `kraken-master`.ANNOUNCE_RESULT,
         `kraken-master`.PEERS
      WHERE ANNOUNCE_RESULT.ID = PEERS.ID
      AND DATE(ANNOUNCE_RESULT.TIMESTAMP) = @QUERYDATE
      GROUP BY PEERS.IP_ADDRESS,
         ANNOUNCE_RESULT.INFO_HASH);

   INSERT INTO `kraken-statistics`.statistics_torrentmeta
      (observed_peers, max_swarm_size, seeder_quota, info_hash, date)

      (SELECT observed_peers,
         max_swarm_size,
         seeder_quota,
         table1.info_hash,
         date

      FROM (
         SELECT MAX(TOTAL_PEERS) AS max_swarm_size,
            AVG(SEEDERS/TOTAL_PEERS) AS seeder_quota,
            INFO_HASH AS info_hash,
            @QUERYDATE AS date

         FROM `kraken-master`.`ANNOUNCE_RESULT`
         WHERE ANNOUNCE_COMPLETED = 1
         AND DATE(TIMESTAMP) = @QUERYDATE
         GROUP BY INFO_HASH
      ) AS table1, (
         SELECT COUNT(*) AS observed_peers,
            info_hash AS info_hash
         FROM `kraken-statistics`.statistics_peers
         WHERE date = @QUERYDATE
         GROUP BY info_hash
      ) AS table2

      WHERE table1.info_hash = table2.info_hash);

   INSERT INTO `kraken-statistics`.statistics_torrents
      (info_hash, title, filesize, publish_date)

      (SELECT INFO_HASH AS info_hash,
         TORRENT_TITLE AS title,
         TORRENT_SIZE_KB AS filesize,
         DATE(PUBLISH_DATE) AS publish_date

      FROM `kraken-master`.TORRENTS
      WHERE INFO_HASH NOT IN (
         SELECT info_hash
         FROM `kraken-statistics`.statistics_torrents)
      AND INFO_HASH IN (
         SELECT info_hash
         FROM `kraken-statistics`.statistics_torrentmeta
         WHERE date = @QUERYDATE));

END $$
DELIMITER ;
Module Pattern
kraken.systemstatus = ( function($, moment, d3, errorHandling) {

   "use strict";

   var servletUrl = null;

   function convertTimestamp(timestamp) {
      [...]
   }

   function init(servletUrlNew) {
      servletUrl = servletUrlNew;
	  [...]
   }

   [...]

   return {
      init: init
   };

}(jQuery, moment, d3, kraken.errorHandling));
Architecture
Technologies
Sass
Compass
HTML5
CSS3
C3.js
moment.js
jQuery
D3.js
Maven
Ant
JSP
MySQL
Jave EE
Tomcat
normalize.css
Module Pattern
BUILD
BACK-END
FRONT-END: JS
FRONT-END