Climbing Up and Down the Abstraction Ladder
Empirically Modeling Visual Perception for Effective Information Visualization
Hook
Visualizations are everywhere
print("hello world")Framing / Grounding Model
possible framing 1:
Abstraction Ladder

More concrete
More abstract
Framing / Grounding Model
possible framing 2:
Algebraic Visualization Design
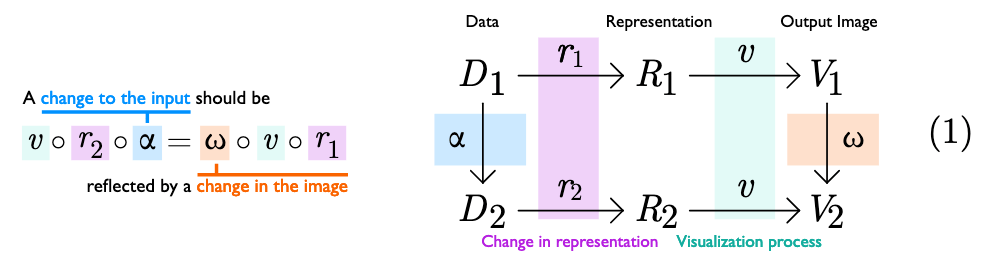
Framing / Grounding Model
possible framing 3:
Marr's levels of analysis
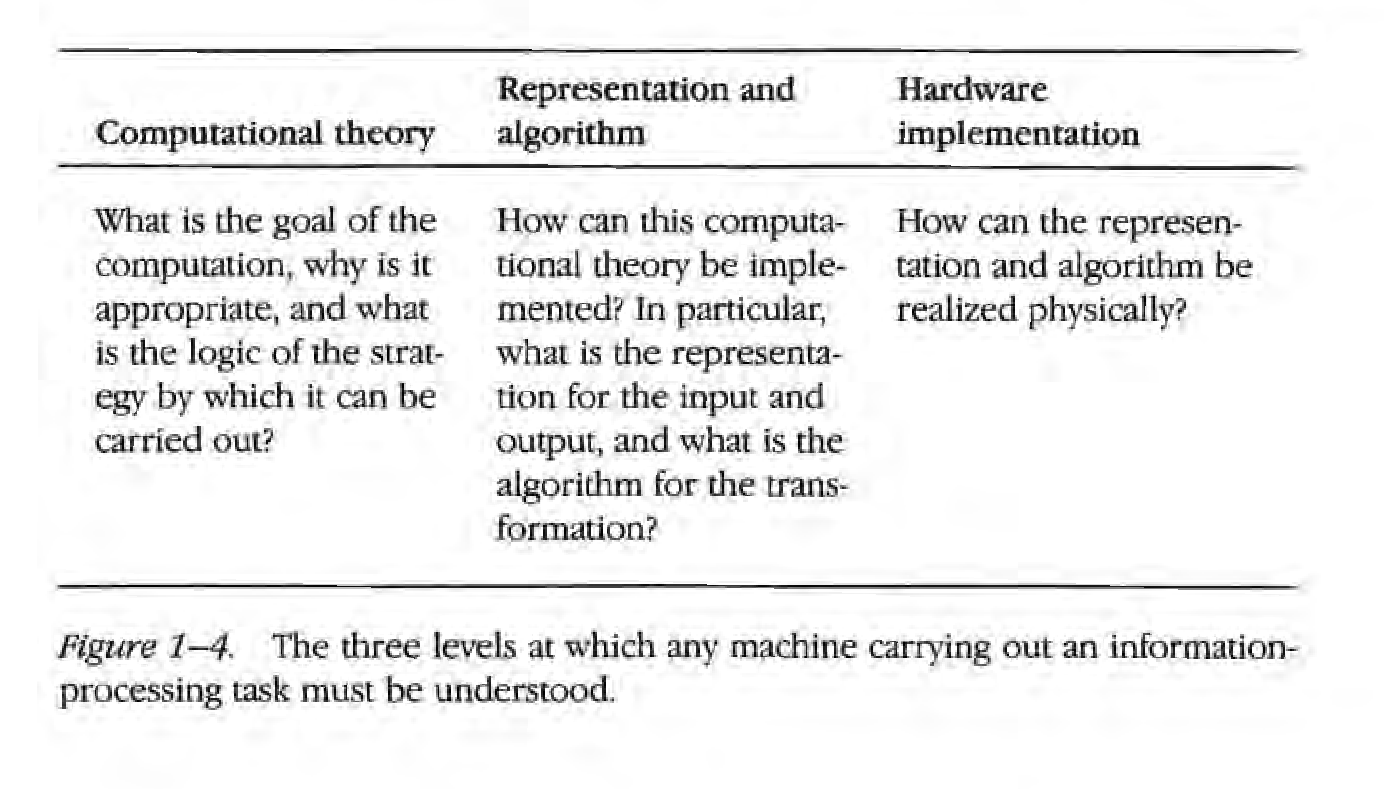
More concrete
More abstract
Background
Or: what's up with existing work?
Existing empirical studies are often black-box and descriptive
Cleveland and McGill, position-length experiment
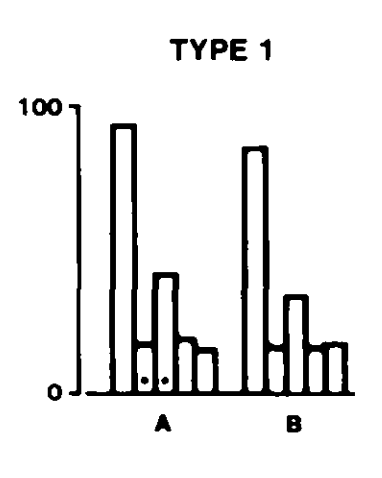
Q: What percent is the smaller of the larger?
accuracy
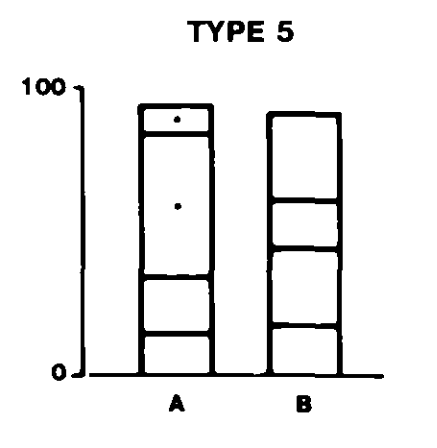
ranking
position
length
position > length
automatic tool design
BUT WHY?
Background
Proposed theories of graph comprehension are too high-level to aid experiment design
in fact, the most cited Theory of Graph Comprehension was influenced by theories of language comprehension at the time it was proposed
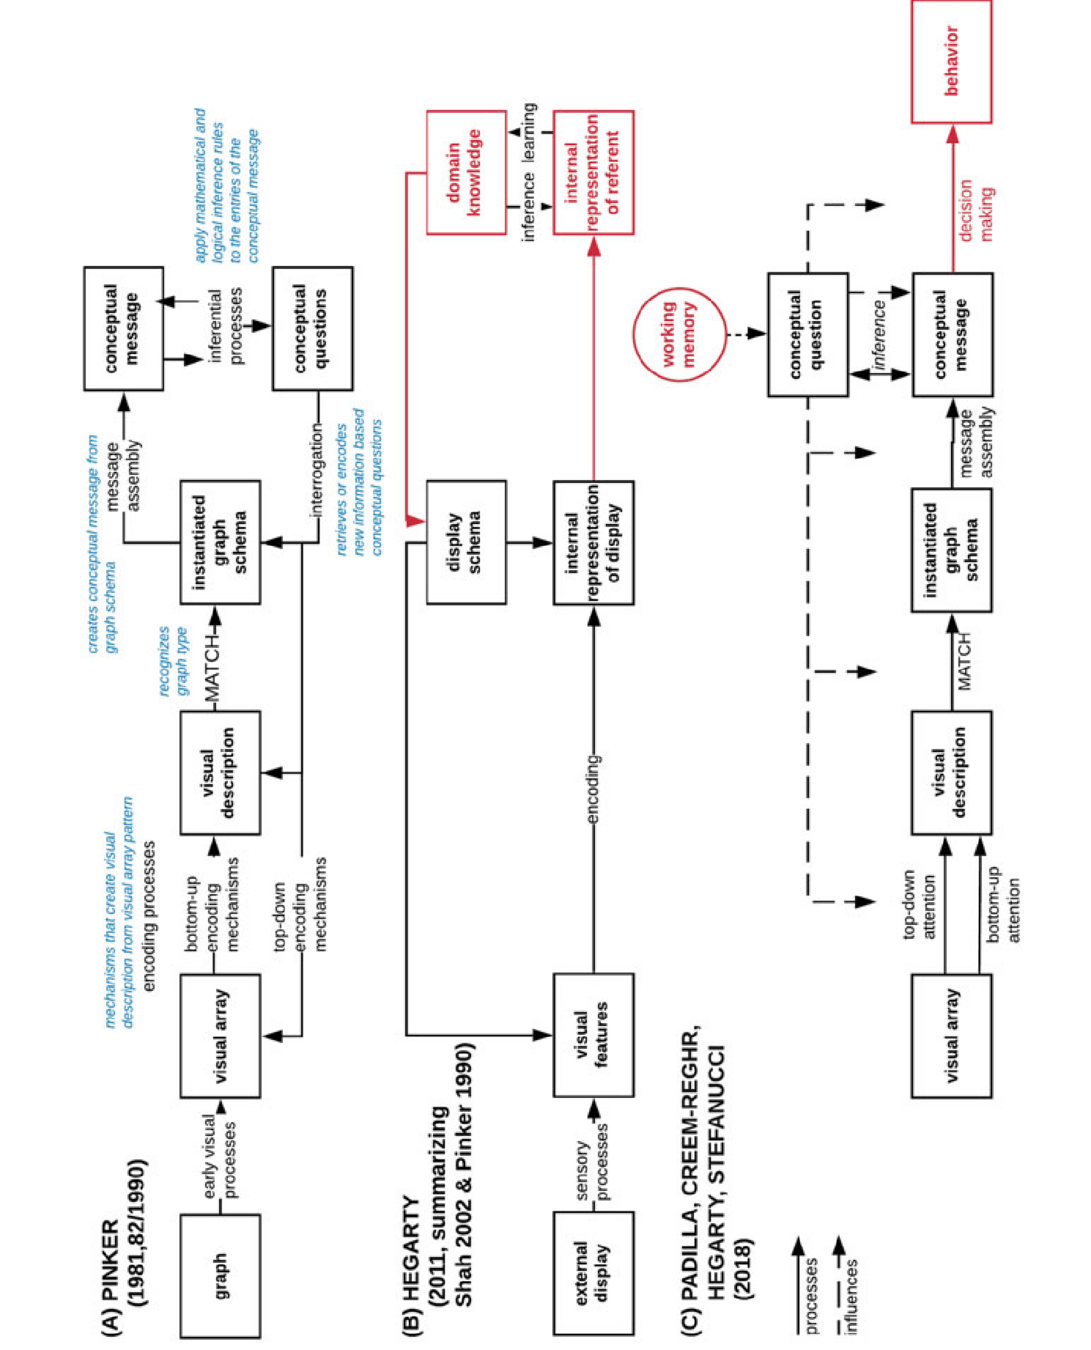
How do you measure "graph schema" or "internal representation of display"?
Not falsifiable
Background
When they're not high-level, they focus on things like predicting eye scan paths or time it takes to finish task
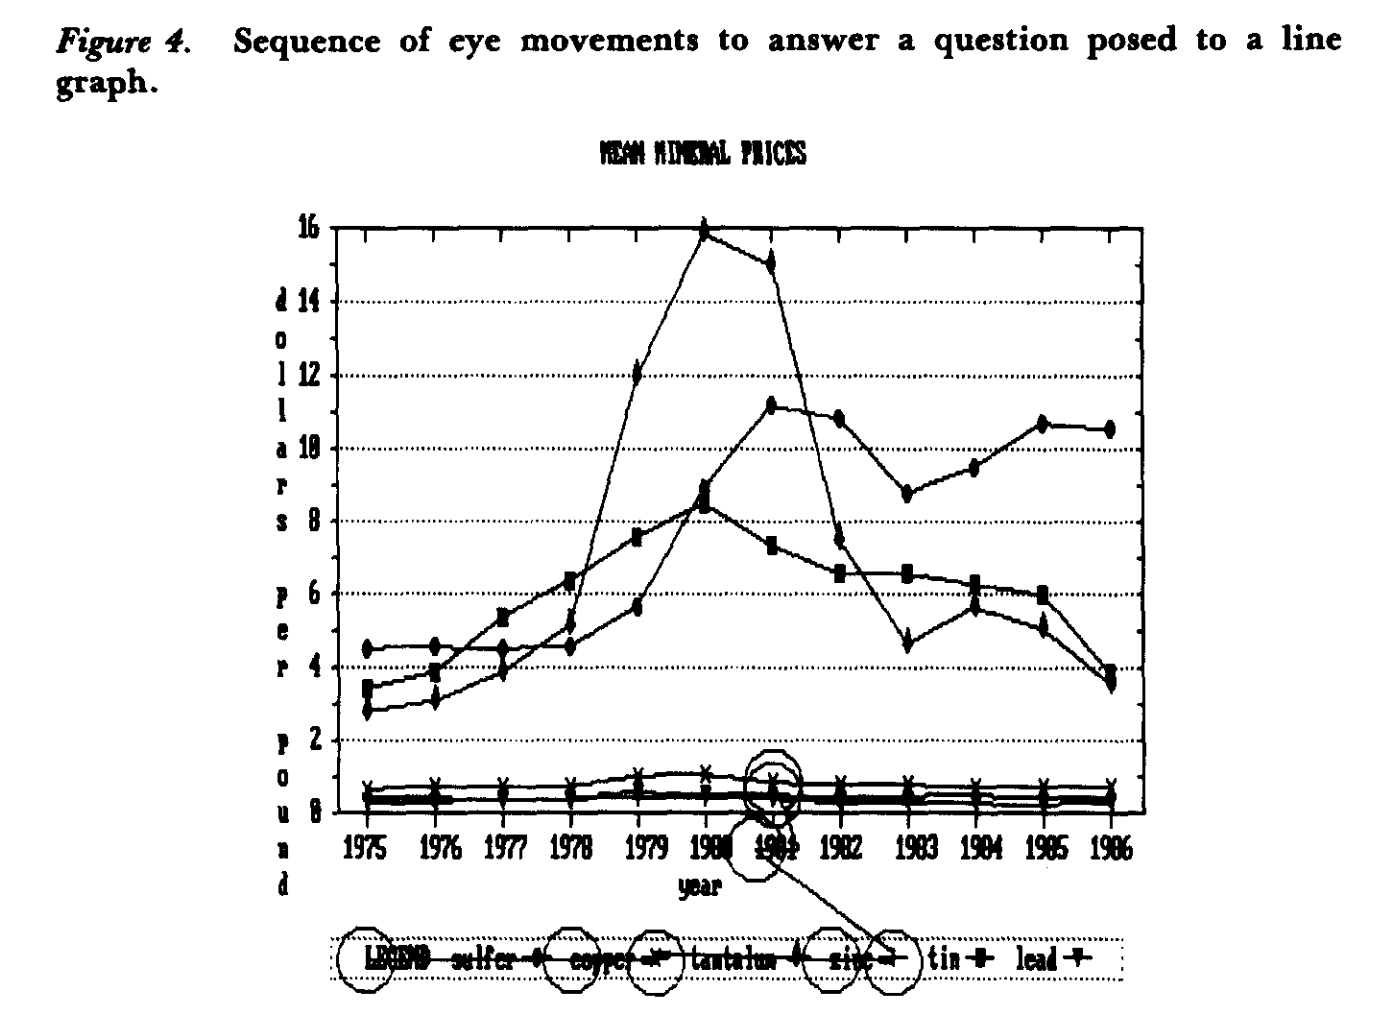
Q: Did tin exceed $8.00 per pound in 1981?
Background → Motivation
building computational, predictive models that operationalize the algorithmic level of visualization perception using empirically measurable data.
Paper 1: Old Wine in A New Bottle? Signal Detection Theory to Lineups
* Research question: How do we quantify the "signal" in visual discoveries, and why we should use Signal Detection Theory to analyze the performance on visual lineup data
* Contribution: re-analyzed prior study data using SDT
* Key Takeaway: Average participant most sensitive to rainbow but still have conservative criterion → Reda and Szafir's finding that rainbow color ramps don't lead to false discoveries
* Link to thesis: the need for more rigorous, theory-driven methods to understand users' perceptual sensitivity an decision bias and move beyond simple "correct/incorrect" evaluations
Paper 2: To Cut or Not to Cut? Y-Axis Truncation
* Research question: When are y-axis truncations actually "deceptive"?
* Contribution: controlled study + Data <-> Visual Forms <-> Tasks
* Key Takeaway: y-axis truncation has minimal impact on visuals whose data relations are unaffected by truncation; non-monotonic truncation is especially bad for visual whose data relations are affected by truncation
* Link to thesis: the need for more rigorous, theory-driven methods to understand users' perceptual sensitivity an decision bias and move beyond simple "correct/incorrect" evaluations
Paper 3: Seeing Eye to AI? Deep-feature based similarity metrics
* Research question: Do DF-based similarity metrics "judge" the similarity of visualizations that same way that humans do?
* Contribution: replication of two prior studies using extended DF-based metrics
* Key Takeaway: Approximates well for scatterplot similarity but fail for basic visual channels like glyph shape and color
* Link to thesis: while computational models can approximate some aspect of human visual perception, they don't inherently explain the underlying process or why we perceive
→ We need computational theories that are explicitly about the decoding process, moving beyond just mimicking outcomes
Thesis Work Part 1: Visual Decoding Operators
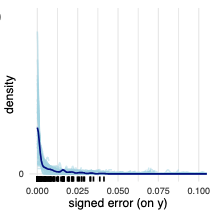
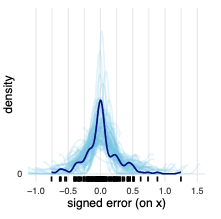
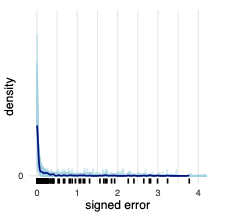
{PDF, CDF} * {median, mode}
Find Median on CDF
i.e., project from where y = 0.5 to the curve
Thesis Work Part 1: Visual Decoding Operators
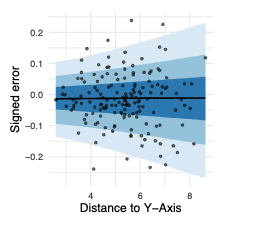
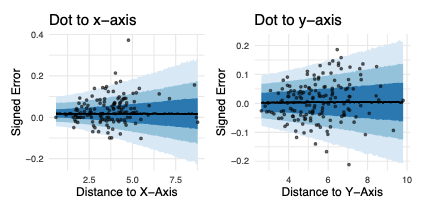
Project from dot to axes
Thesis Work Part 1: Visual Decoding Operators
PDF Mode
Find highest point on curve
Thesis Work Part 1: Visual Decoding Operators
CDF Mode
Find maximum slope on curve
Thesis Work Part 1: Visual Decoding Operators
PDF Median
split area into two
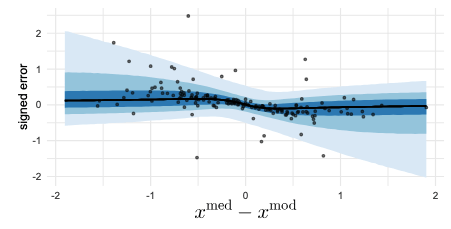
sensor fusion between median and mode operator
Proposed Work
- Instead of telling participants exactly what to do, we ask them to perform the high-level conceptual task
- The error profiles we obtained from the previous work will help
Timeline
...