Data visualization workshop
Shirley Wu
(@sxywu)
You will learn:
SVG Elements
rect
x: x-coordinate of top-left
y: y-coordinate of top-left
width
height
circle
cx: x-coordinate of center
cy: y-coordinate of center
r: radius
text
x: x-coordinate
y: y-coordinate
dx: x-coordinate offset
dy: y-coordinate offset
text-anchor: horizontal text alignment
Hi!
path
d: path to follow
Moveto, Lineto, Curveto, Arcto
SVG Paths

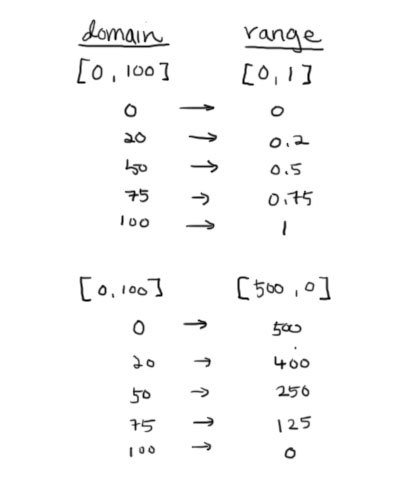
Scales
  d3.scaleLinear()
    .domain([min, max]) // input
    .range([min, max]); // output
scale: mapping from
data attributes (domain)
to display (range)
date → x-value
value → y-value
value → opacity
etc.
Scales
// get min/max
var height = 600;
var data = [
    {date: new Date('01-01-2015'), temp: 0},
    {date: new Date('01-01-2017'), temp: 3}
];

var min = d3.min(data, d => d.date);
var max = d3.max(data, d => d.date);

// or use extent, which gives back [min, max]
var extent = d3.extent(data, d => d.date);

var yScale = d3.scaleLinear()
  .domain([min, max])
  .range([height, 0]);
Scales
// continuous
d3.scaleLinear()
d3.scaleLog()
d3.scaleTime()

// ordinal
d3.scaleBand()
Scales I use often:
Selection & Data
<svg>
<rect />
<rect />
<rect />
<rect />
<rect />
</svg>
<script>
const height = 600;
const rectWidth = 100;
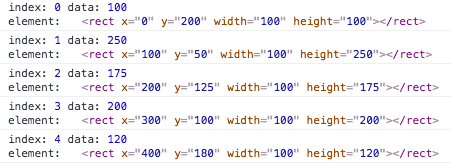
const data = [100, 250, 175, 200, 120];
d3.selectAll('rect')
.data(data)
.attr('x', (d, i) => i * rectWidth)
.attr('y', d => height - d)
.attr('width', rectWidth)
.attr('height', d => d)
.attr('fill', 'blue')
.attr('stroke', '#fff');
</script>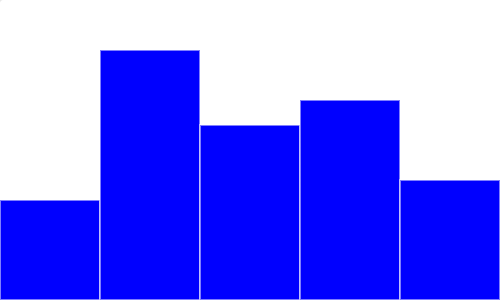
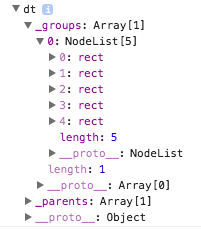
Selection & Data
5 rectangle elements
Select all rectangle elements that exist
  <svg>
    <rect />
    <rect />
    <rect />
    <rect />
    <rect />
  </svg>
  <script>
    const height = 600;
    const rectWidth = 100;
    const data = [100, 250, 175, 200, 120];

    d3.selectAll('rect')
    	.data(data)
    	.attr('x', (d, i) => i * rectWidth)
    	.attr('y', d => height - d)
    	.attr('width', rectWidth)
    	.attr('height', d => d)
    	.attr('fill', 'blue')
    	.attr('stroke', '#fff');

  </script>
"Bind" data to the selections
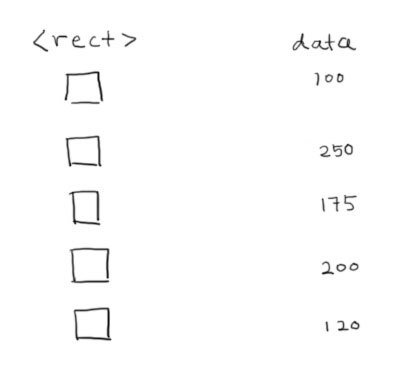
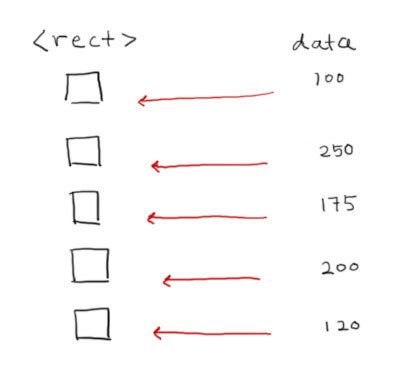
Selection & Data
<svg>
<rect />
<rect />
<rect />
<rect />
<rect />
</svg>
<script>
const height = 600;
const rectWidth = 100;
const data = [100, 250, 175, 200, 120];
d3.selectAll('rect')
.data(data)
.attr('x', (d, i) => i * rectWidth)
.attr('y', d => height - d)
.attr('width', rectWidth)
.attr('height', d => d)
.attr('fill', 'blue')
.attr('stroke', '#fff');
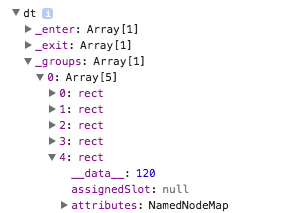
</script>Loop through each rectangle selection
Get passed in (data, index)
Selection & Data
  <svg>
    <rect />
    <rect />
    <rect />
    <rect />
    <rect />
  </svg>
  <script>
    const height = 600;
    const rectWidth = 100;
    const data = [100, 250, 175, 200, 120];

    d3.selectAll('rect')
    	.data(data)
    	.attr('x', (d, i) => i * rectWidth)
    	.attr('y', d => height - d)
    	.attr('width', rectWidth)
    	.attr('height', d => d)
    	.attr('fill', 'blue')
    	.attr('stroke', '#fff');

</script>Enter-append
<svg></svg>
<script>
var rectWidth = 100;
var height = 300;
var data = [100, 250, 175, 200, 120];
var svg = d3.select('svg');
svg.selectAll('rect')
.data(data)
.enter().append('rect')
.attr('x', (d, i) => i * rectWidth)
.attr('y', d => height - d)
.attr('width', rectWidth)
.attr('height', d => d)
.attr('fill', 'blue')
.attr('stroke', '#fff');
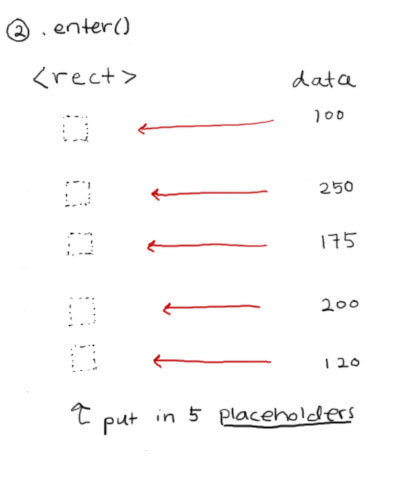
</script>Wut, no rectangle elements?!
So what are we even selecting?
A: an empty selection
So how are those bars appearing?
Enter-append
  <svg></svg>
  <script>
    var rectWidth = 100;
    var height = 300;
    var data = [100, 250, 175, 200, 120];

    var svg = d3.select('svg');
    svg.selectAll('rect')
    	.data(data)
    	.enter().append('rect')
    	.attr('x', (d, i) => i * rectWidth)
    	.attr('y', d => height - d)
    	.attr('width', rectWidth)
    	.attr('height', d => d)
    	.attr('fill', 'blue')
    	.attr('stroke', '#fff');

  </script>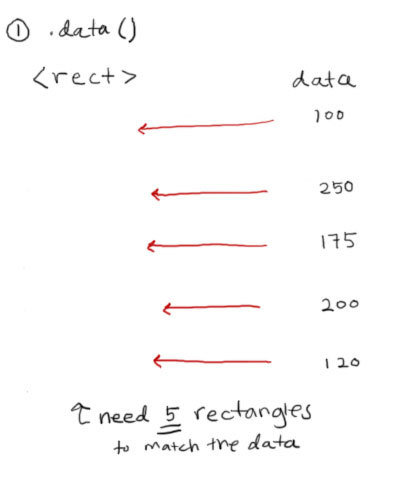

Magic ✨
Enter-append
<svg></svg>
<script>
var rectWidth = 100;
var height = 300;
var data = [100, 250, 175, 200, 120];
var svg = d3.select('svg');
svg.selectAll('rect')
.data(data)
.enter().append('rect')
.attr('x', (d, i) => i * rectWidth)
.attr('y', d => height - d)
.attr('width', rectWidth)
.attr('height', d => d)
.attr('fill', 'blue')
.attr('stroke', '#fff');
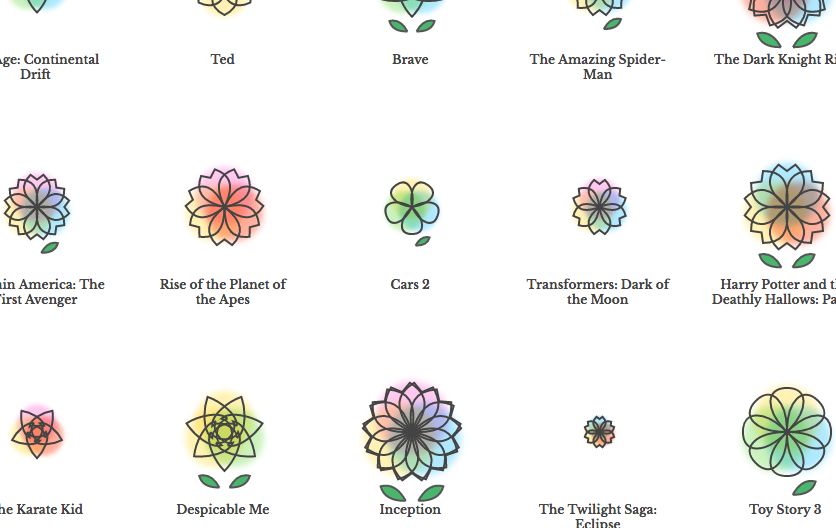
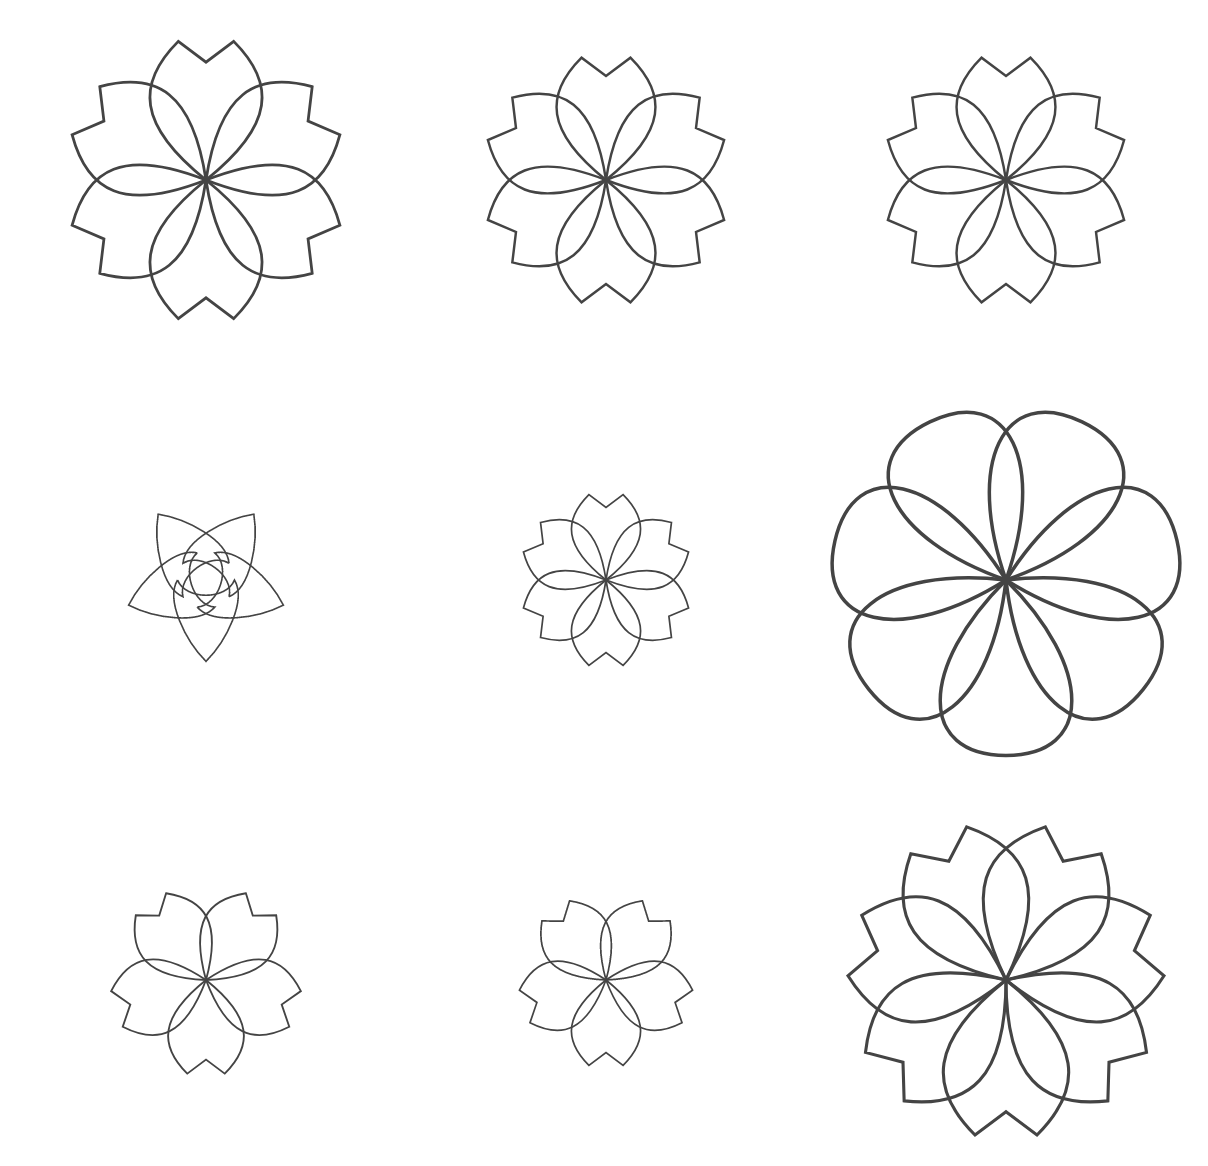
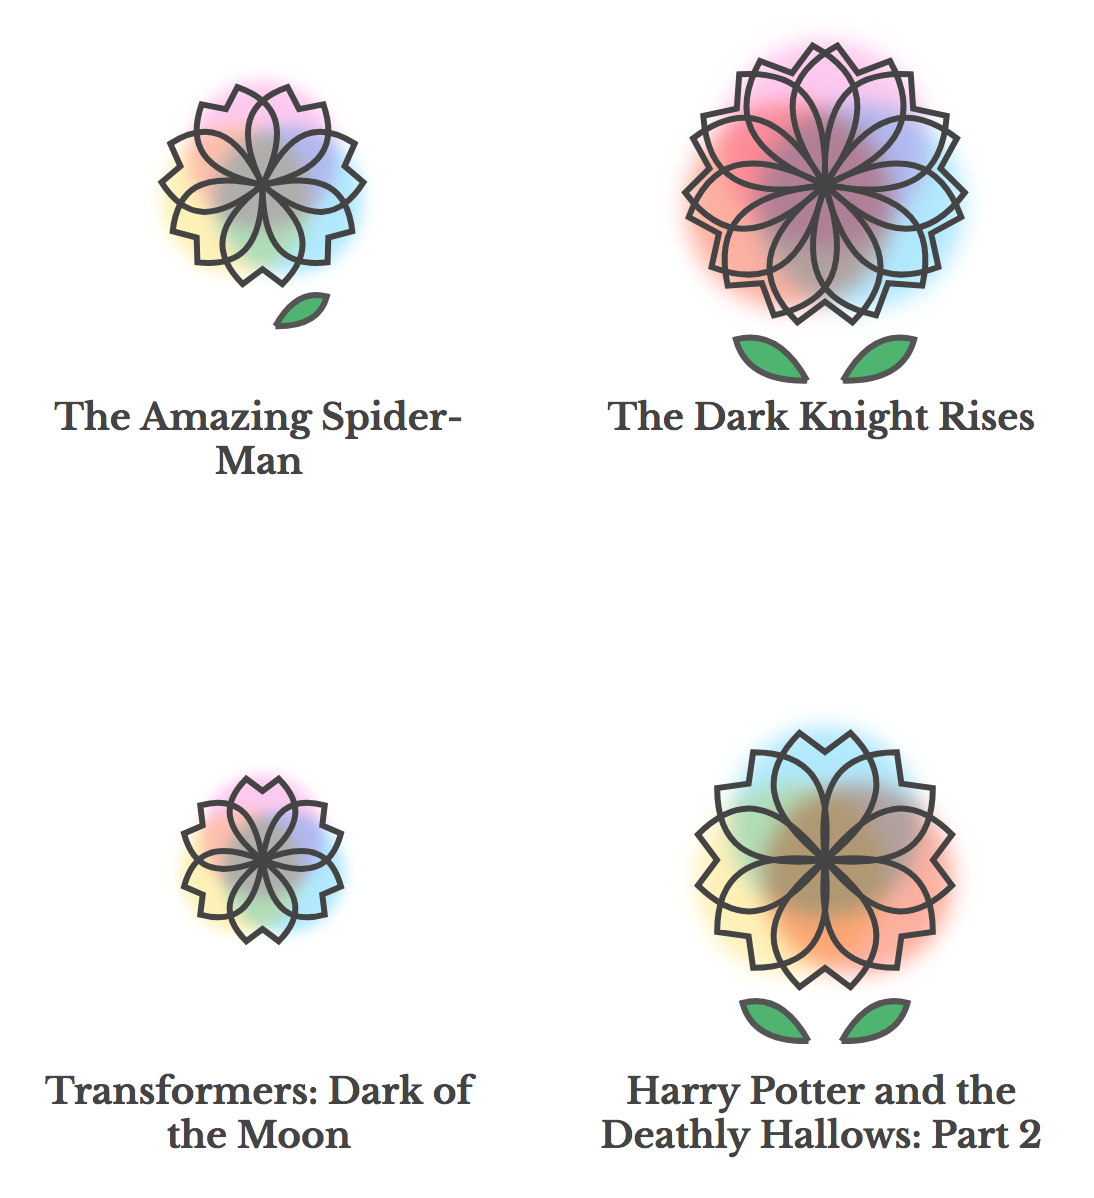
</script>Let's make a flower
Type of petal: parental guidance rating
Size of flower: IMDb rating out of 10
Number of petals: number of IMDb votes
- Create scale (scaleLinear and scaleQuantize)
- Get data ready, and use the first movie data
- Create number of petals based on data
- Rotate and scale petals
Hint: use SVG transform's translate, rotate, and scale (in that order)
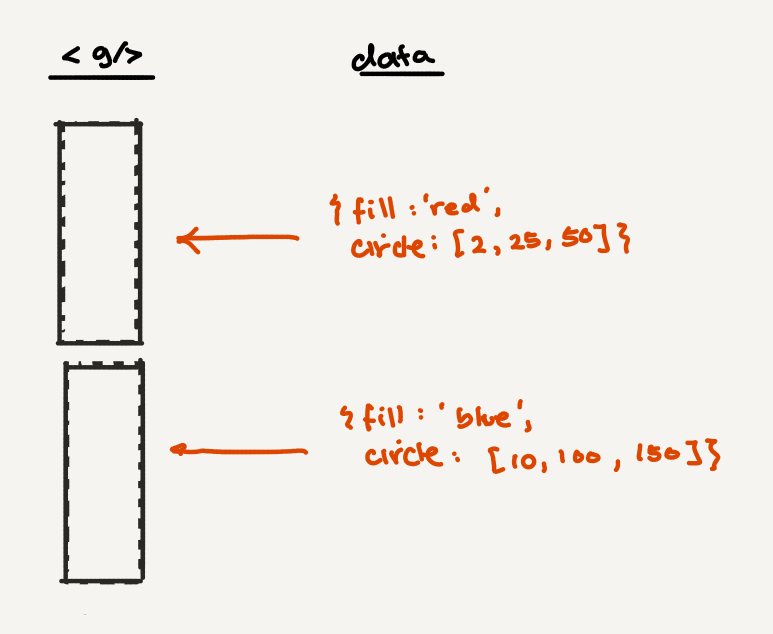
nesting elements
Nest elements when you want to apply the same styles and transforms to a group of elements
<g> element that consist of petals and leaves, has translate and scale applied
<path> element for each petal with rotate applied
nesting elements
const data = [
  {fill: 'red', circle: [2, 25, 50]},
  {fill: 'blue', circle: [10, 100, 150]},
];

const svg = d3.select("body").append("svg")
  .attr("width", 960)
  .attr("height", 500)

const groups = svg.selectAll('g')
  .data(data).enter().append('g')
  .attr('fill', d => d.fill)
  .attr('transform', 'translate(10,10)');

const circles = groups.selectAll('circle')
  .data(d => d.circle).enter().append('circle')
  .attr('cx', d => d)
  .attr('r', 10);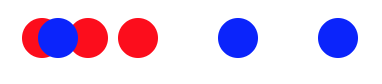
nesting elements
const data = [
{fill: 'red', circle: [2, 25, 50]},
{fill: 'blue', circle: [10, 100, 150]},
];
const svg = d3.select("body").append("svg")
.attr("width", 960)
.attr("height", 500)
const groups = svg.selectAll('g')
.data(data).enter().append('g')
.attr('fill', d => d.fill)
.attr('transform', 'translate(10,10)');
const circles = groups.selectAll('circle')
.data(d => d.circle).enter().append('circle')
.attr('cx', d => d)
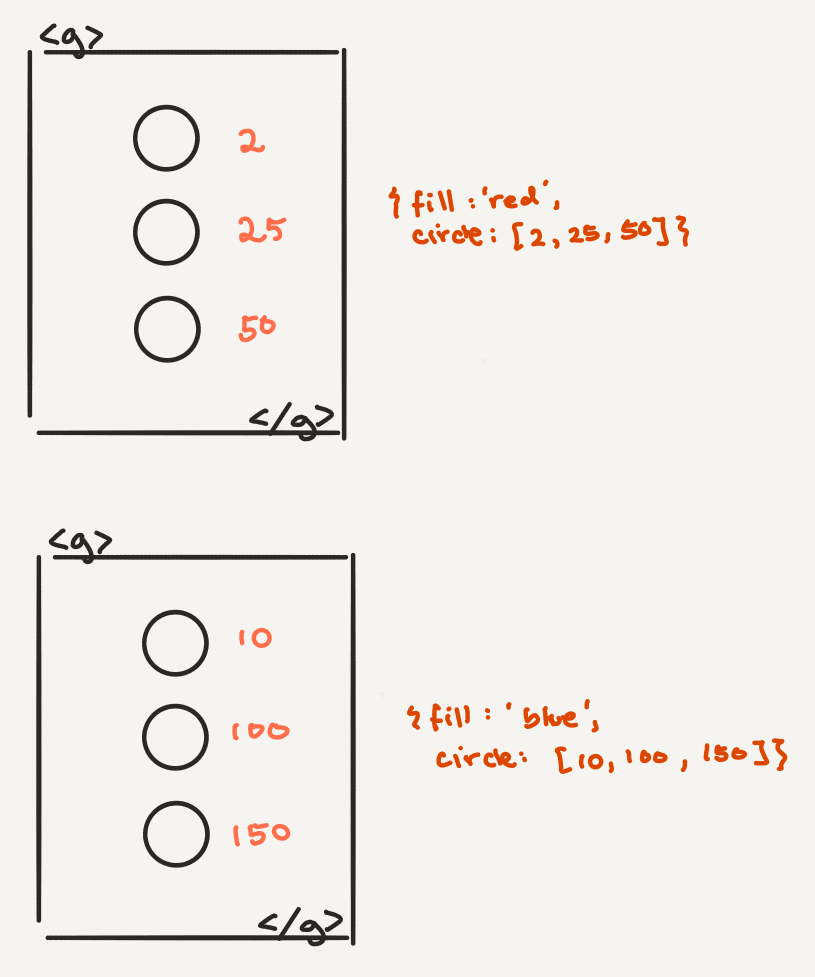
.attr('r', 10);Use <g> element to nest child elements *in SVG, only <g> elements can have children
nesting elements
const data = [
  {fill: 'red', circle: [2, 25, 50]},
  {fill: 'blue', circle: [10, 100, 150]},
];

const svg = d3.select("body").append("svg")
  .attr("width", 960)
  .attr("height", 500)

const groups = svg.selectAll('g')
  .data(data).enter().append('g')
  .attr('fill', d => d.fill)
  .attr('transform', 'translate(10,10)');

const circles = groups.selectAll('circle')
  .data(d => d.circle).enter().append('circle')
  .attr('cx', d => d)
  .attr('r', 10);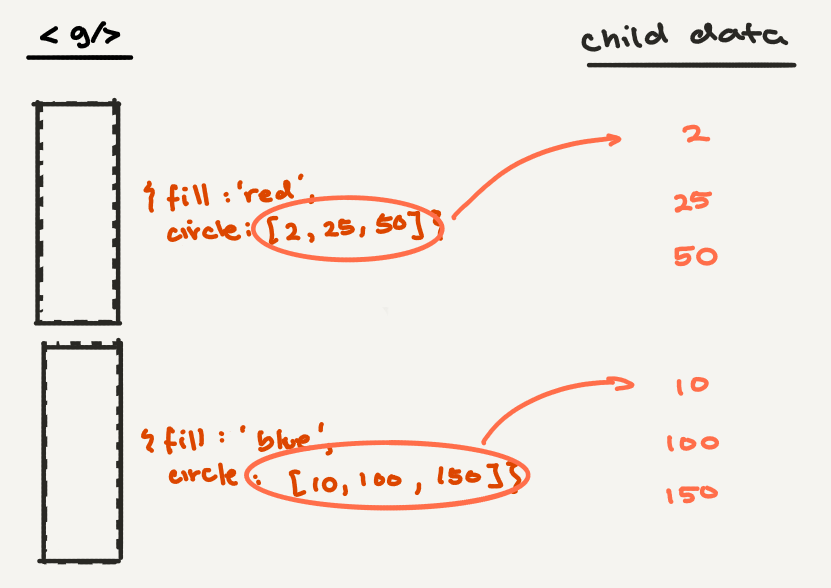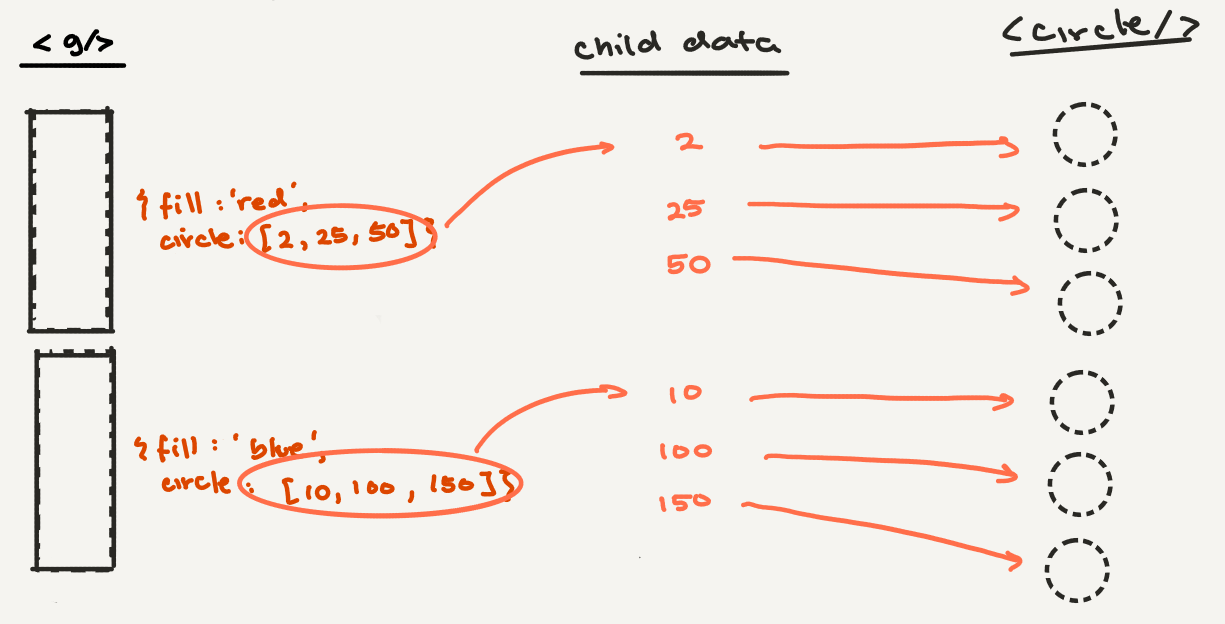
nesting elements
const data = [
  {fill: 'red', circle: [2, 25, 50]},
  {fill: 'blue', circle: [10, 100, 150]},
];

const svg = d3.select("body").append("svg")
  .attr("width", 960)
  .attr("height", 500)

const groups = svg.selectAll('g')
  .data(data).enter().append('g')
  .attr('fill', d => d.fill)
  .attr('transform', 'translate(10,10)');

const circles = groups.selectAll('circle')
  .data(d => d.circle).enter().append('circle')
  .attr('cx', d => d)
  .attr('r', 10);
nesting elements
make all the flowers!
Type of petal: parental guidance rating
Size of flower: IMDb rating out of 10
Number of petals: number of IMDb votes
- Create scales like before
- Create group containers for each flower
- For each flower, calculate number of petals and draw them like before