1.8 Representation Power of functions
Why do we need complex functions ?
Recap: Six jars
What we saw in the previous chapter?
(c) One Fourth Labs
Repeat the slide comparing MP neuron, Perceptron and Sigmoid. Highlight that none of them cannot deal with non-linearly separable data.
Why do we care about continuous functions ?
(c) One Fourth Labs
1. On LHS show the update equations for w and b and write down that \deltaw=partial derivative \deltab=partial derivative
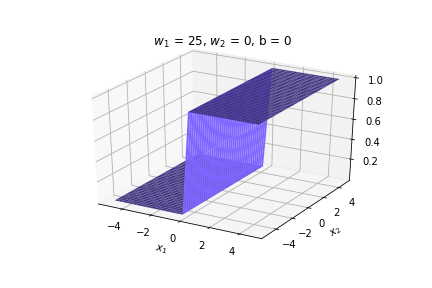
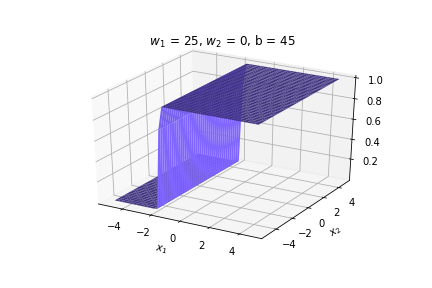
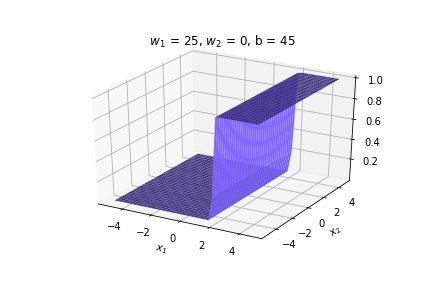
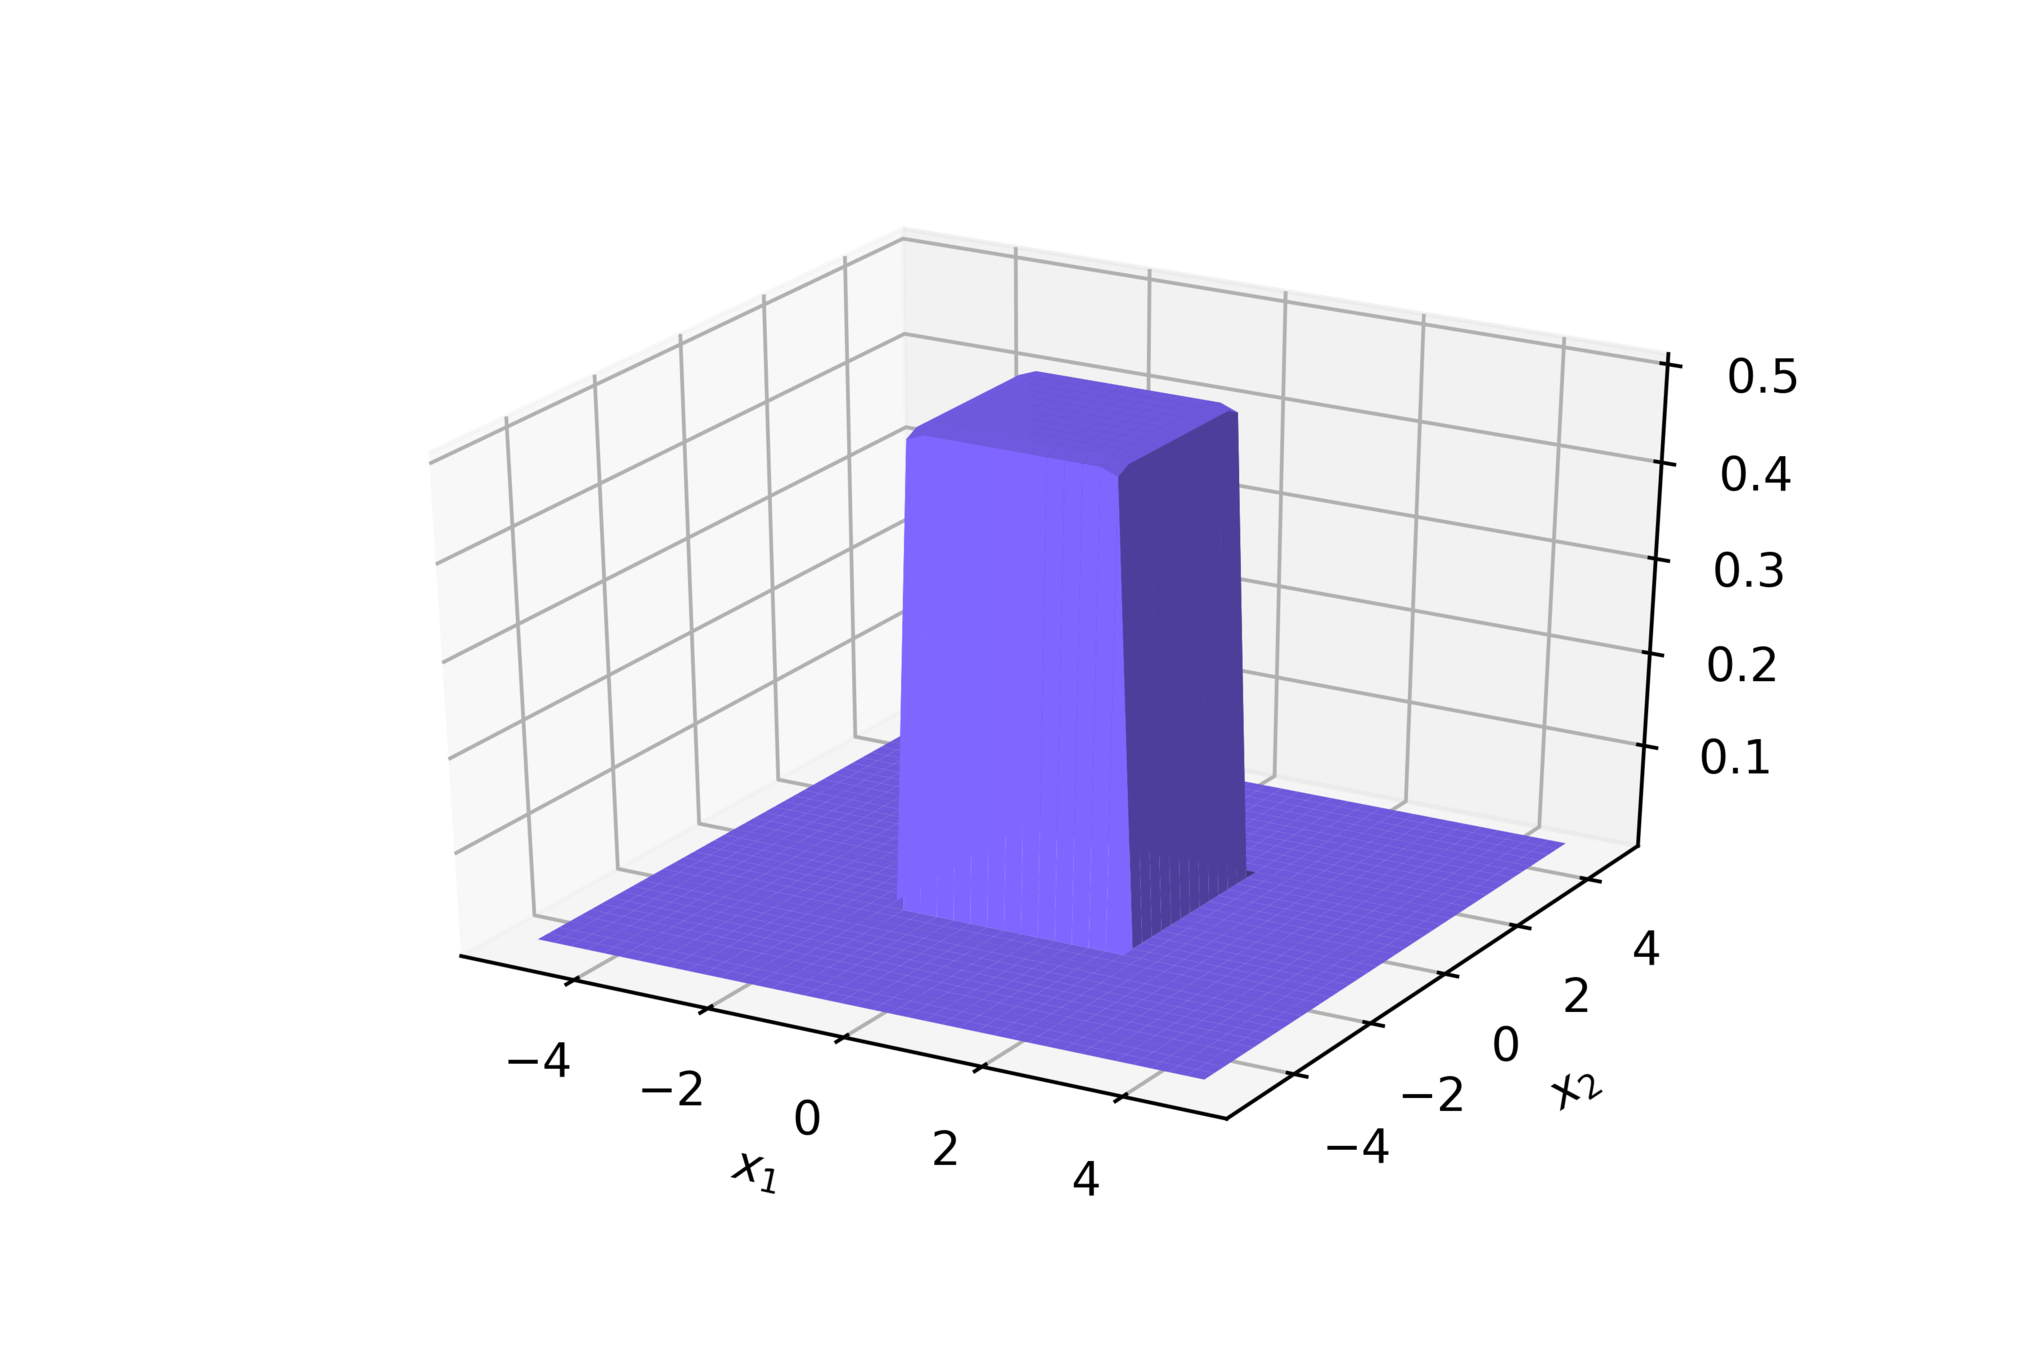
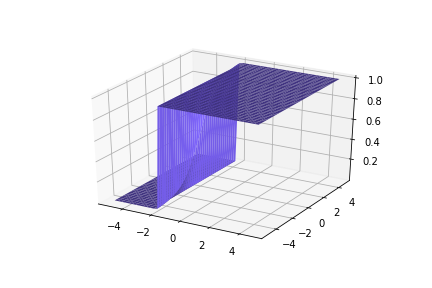
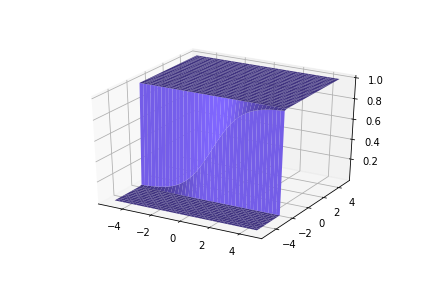
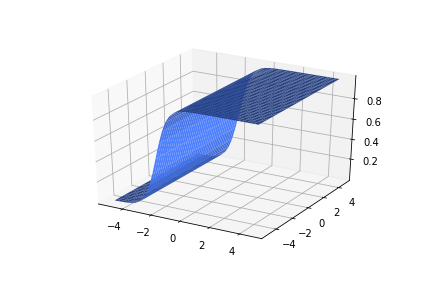
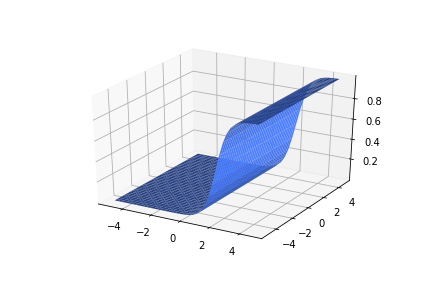
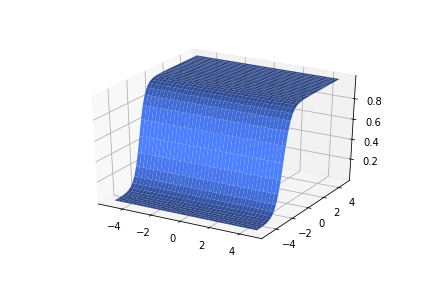
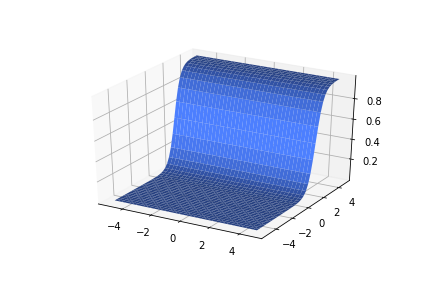
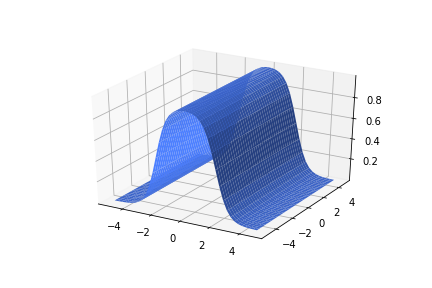
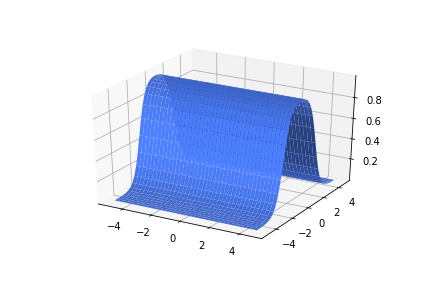
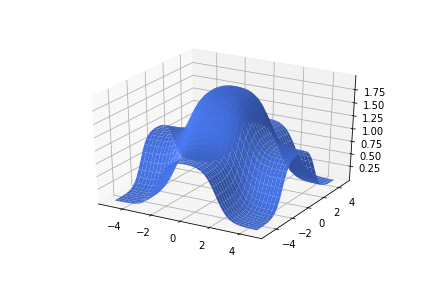
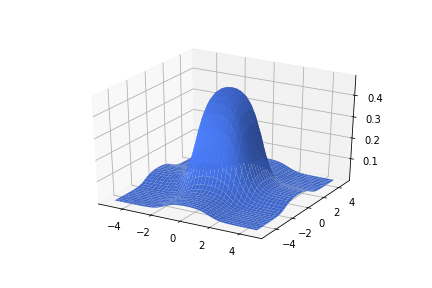
2. On RHS show examples of smooth functions, sigmoid in 2d, asymmetric sigmoid in 3d (w1 !=w2!=0), some other complex function in 3d. For each of the 3 examples contrast it with a non-continuous function. Show the equations also below the plots
Recap: Continuous Functions
Modeling Complex Relations
Why do we need complex functions ?
(c) One Fourth Labs
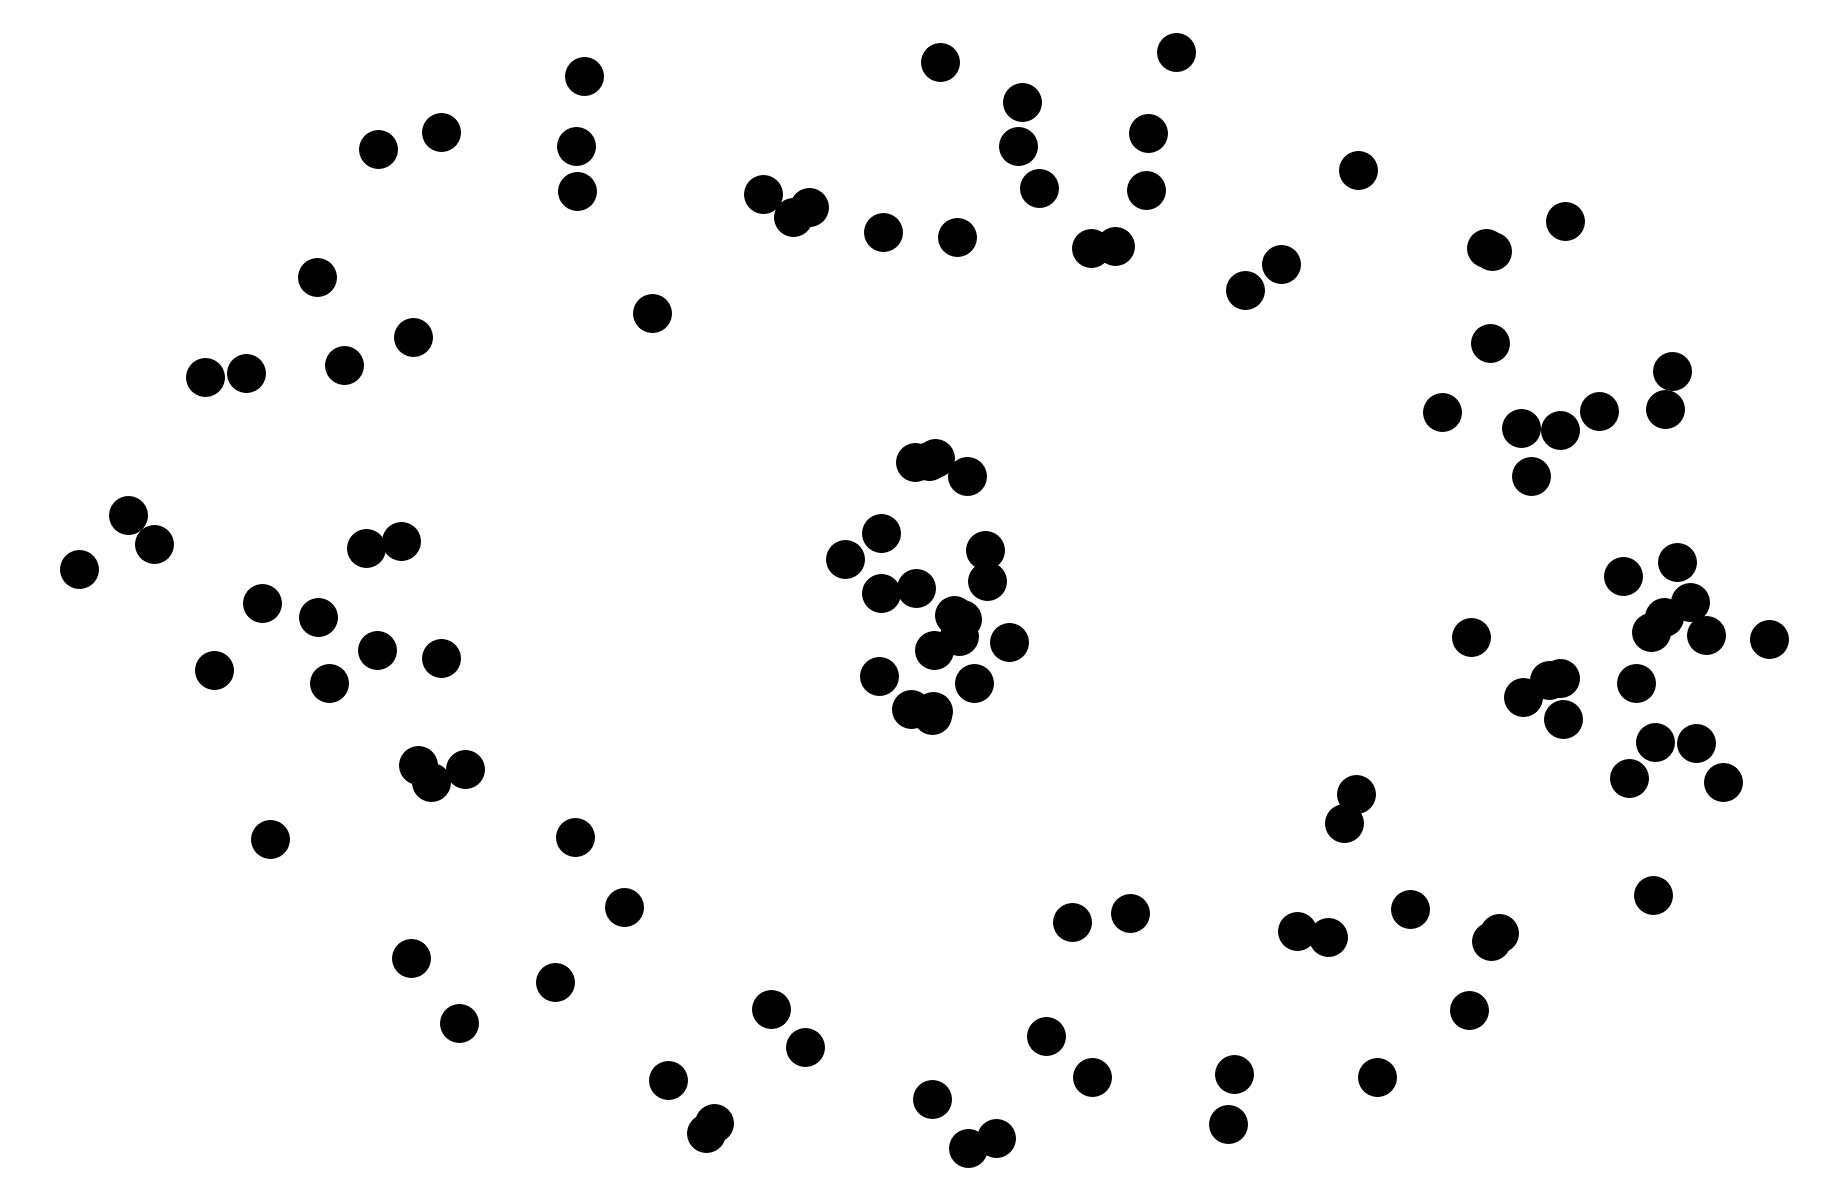
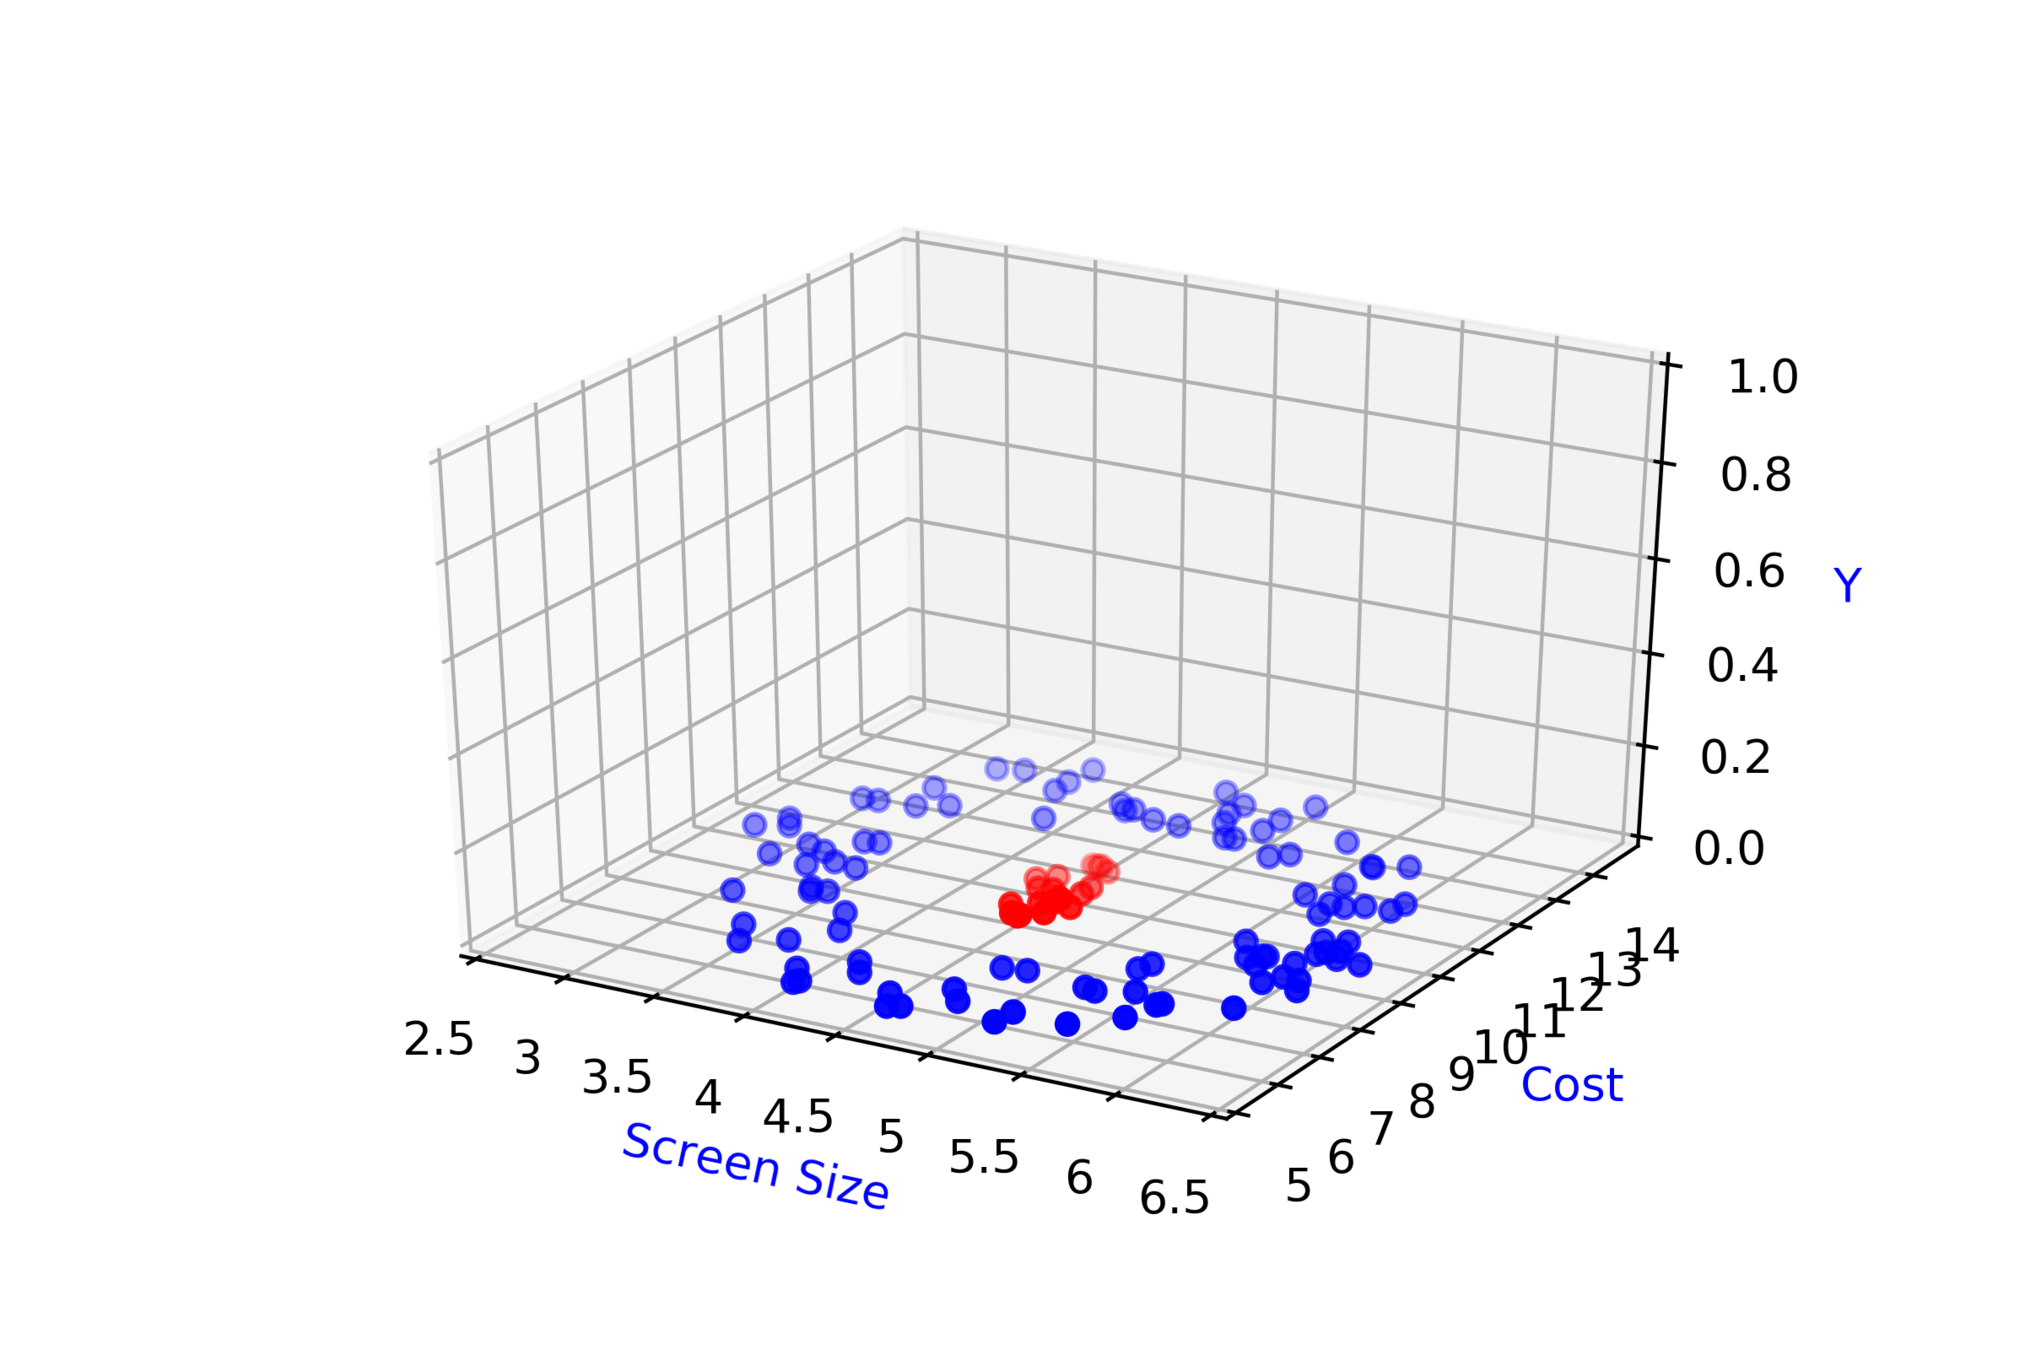
1. Show x1 axis and x2-axis only first
2. Label x1 as screen size, x2 as cost
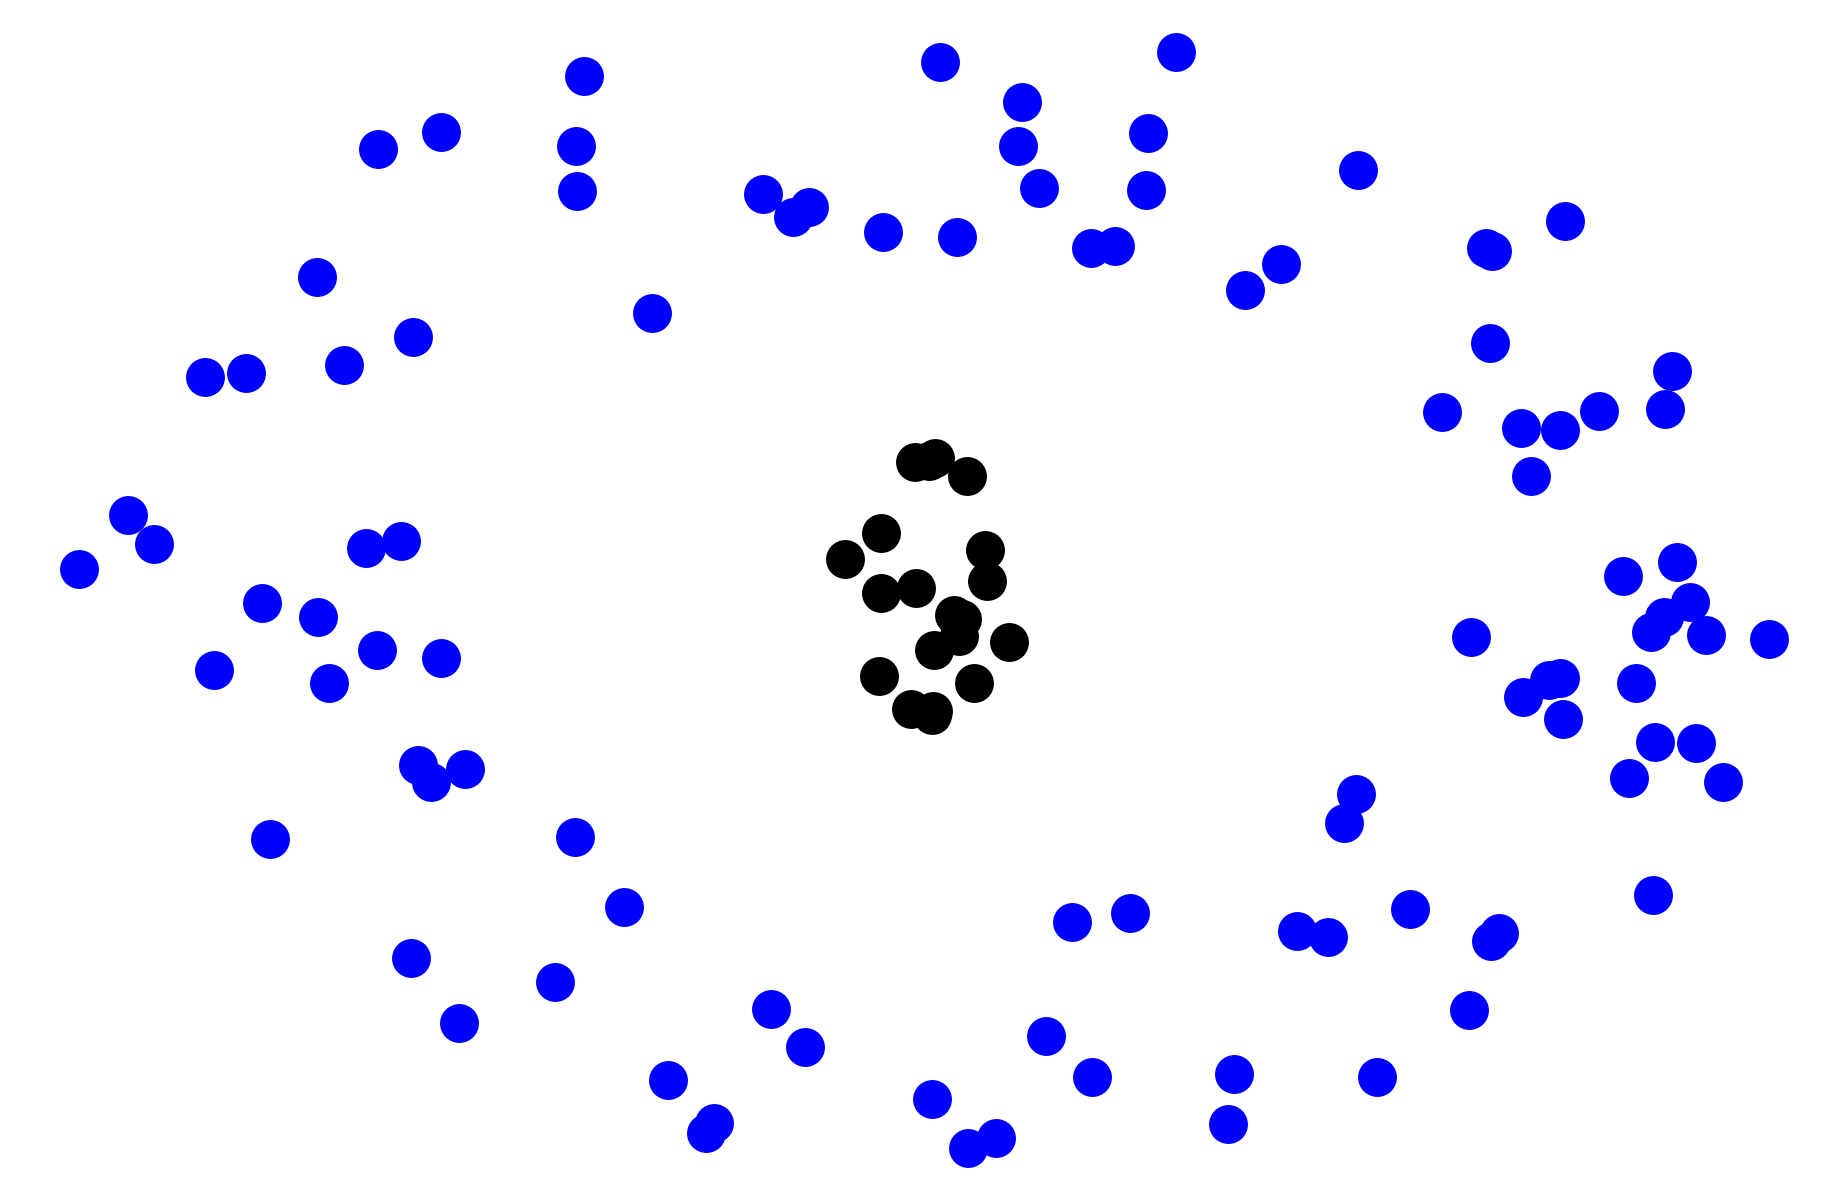
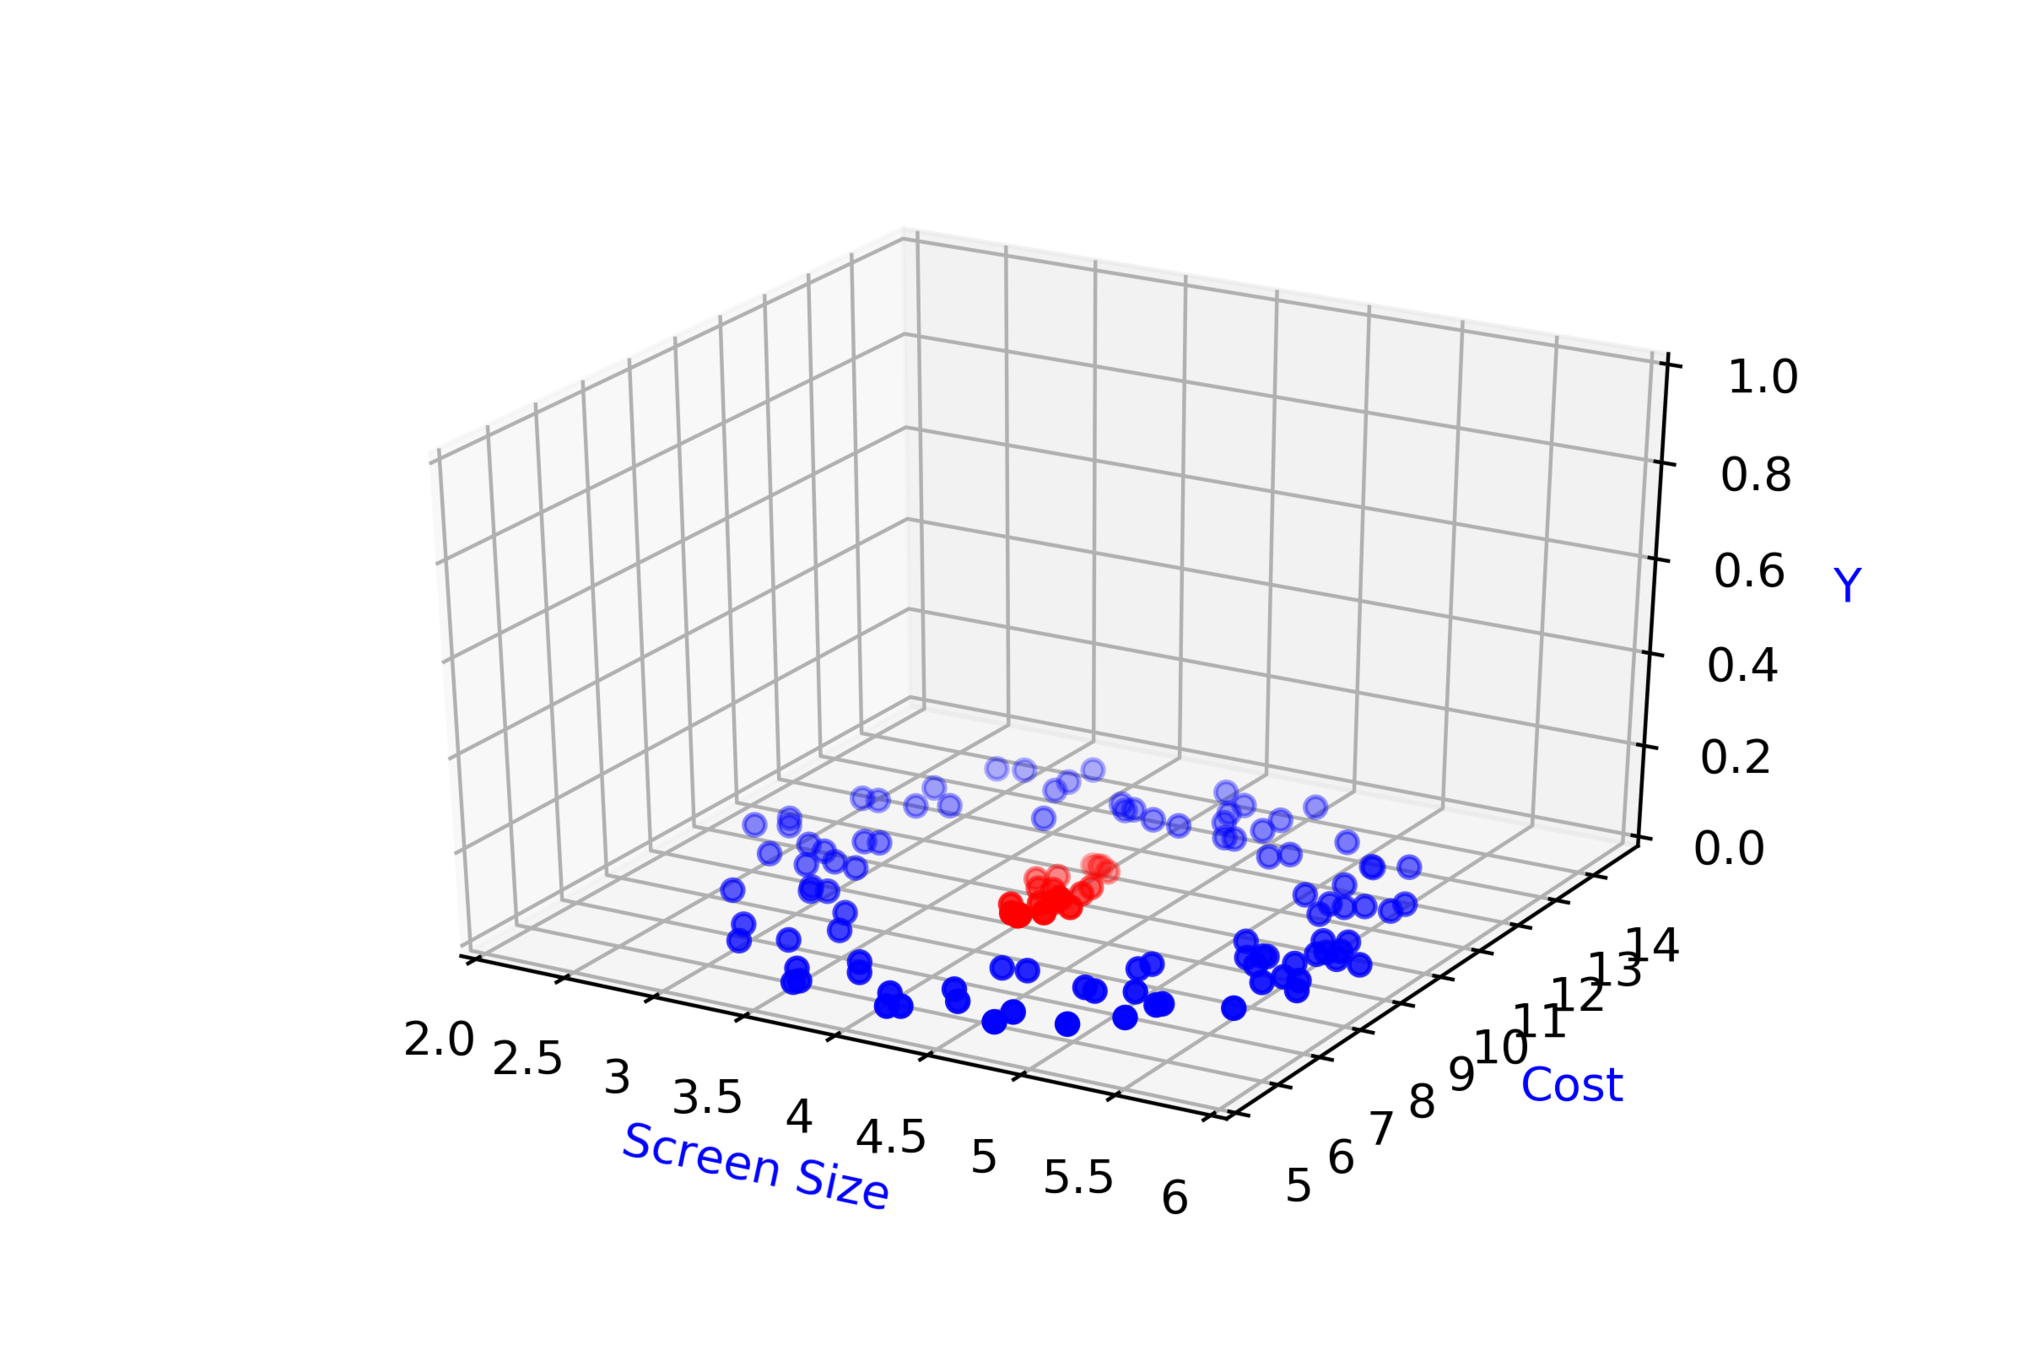
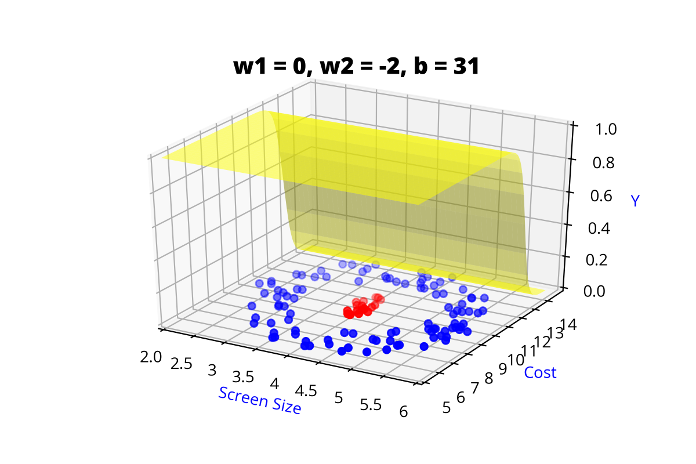
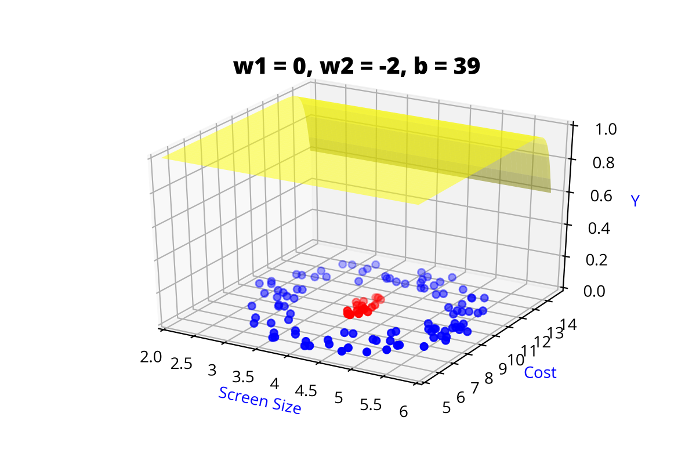
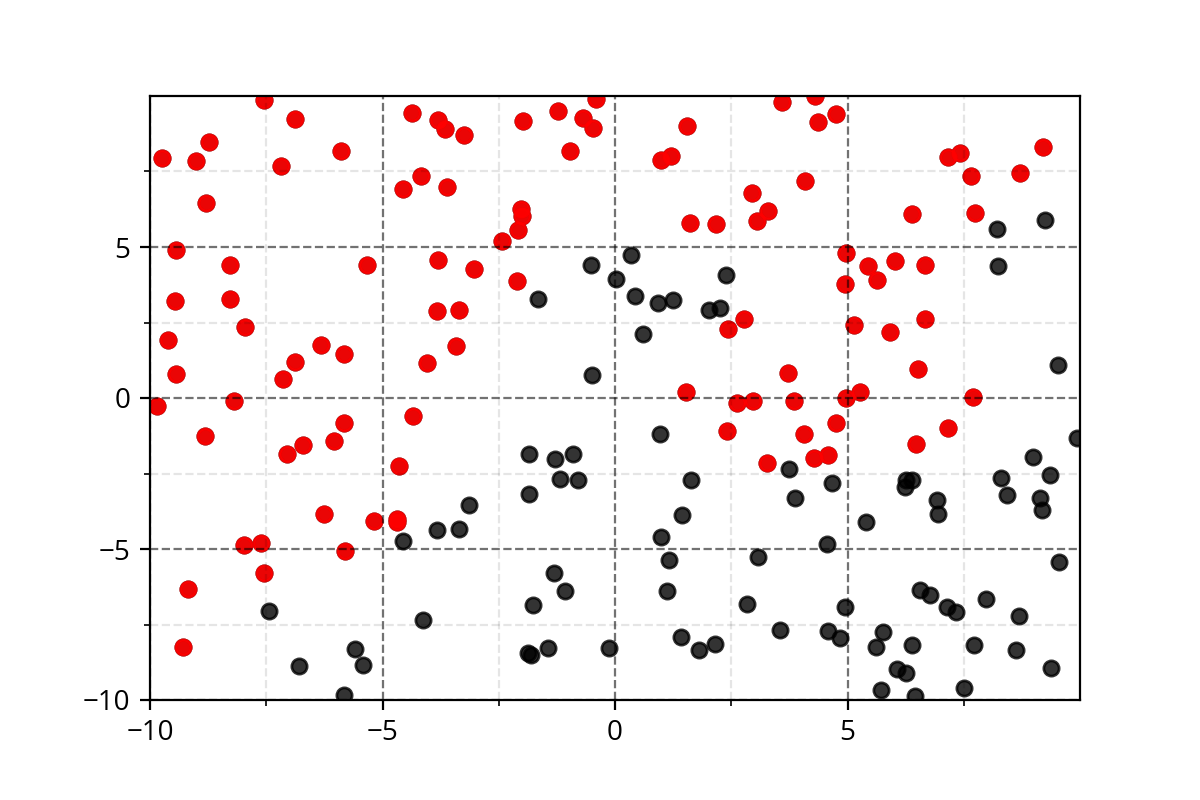
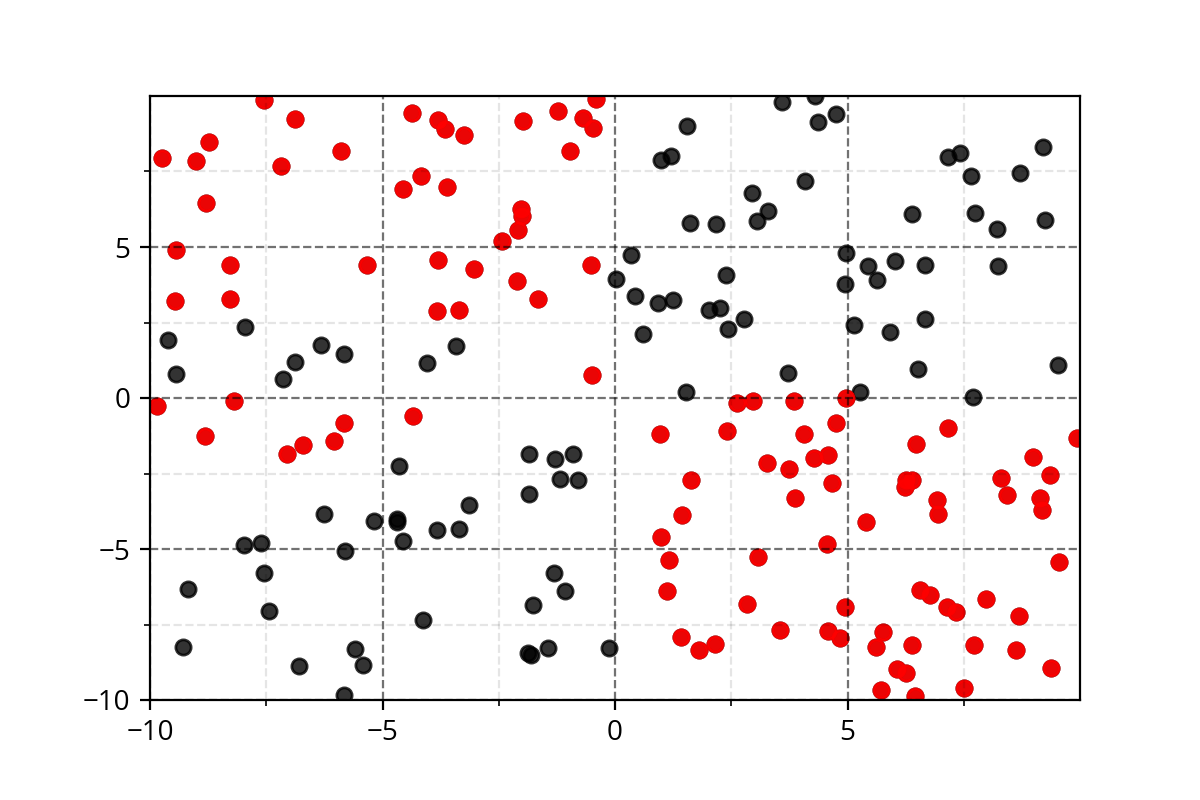
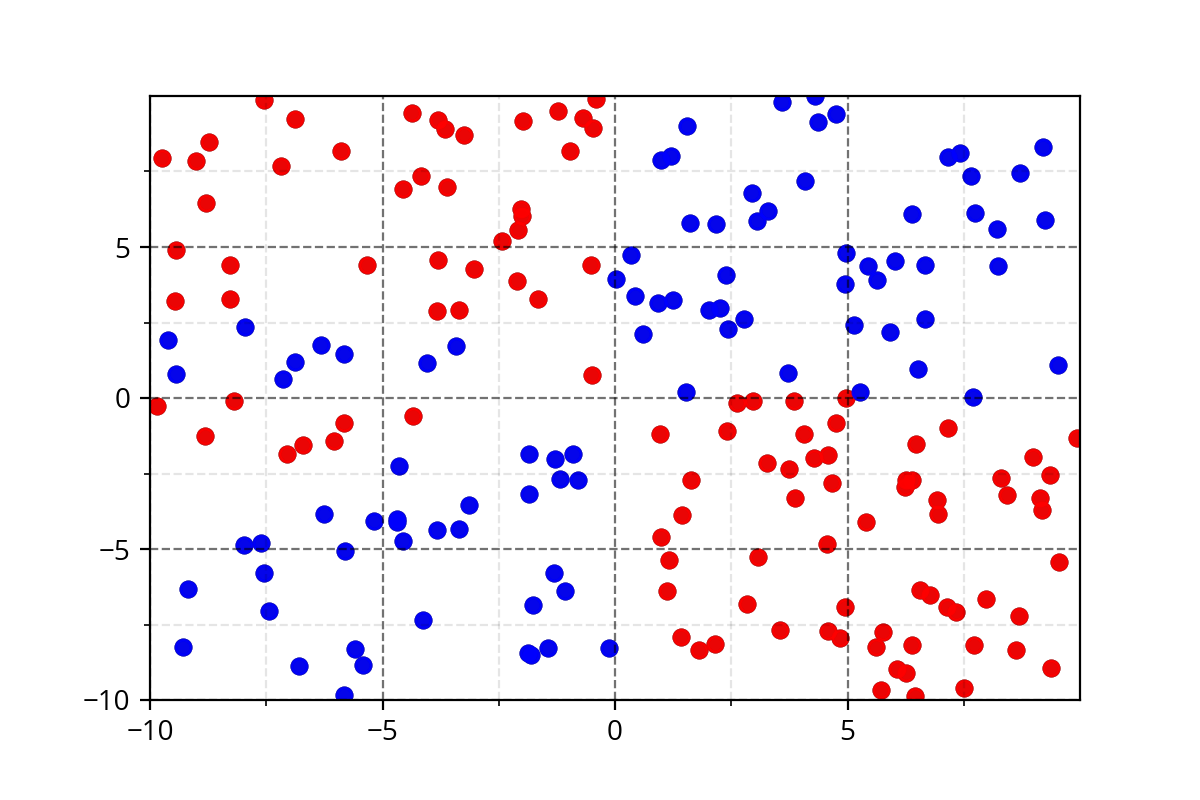
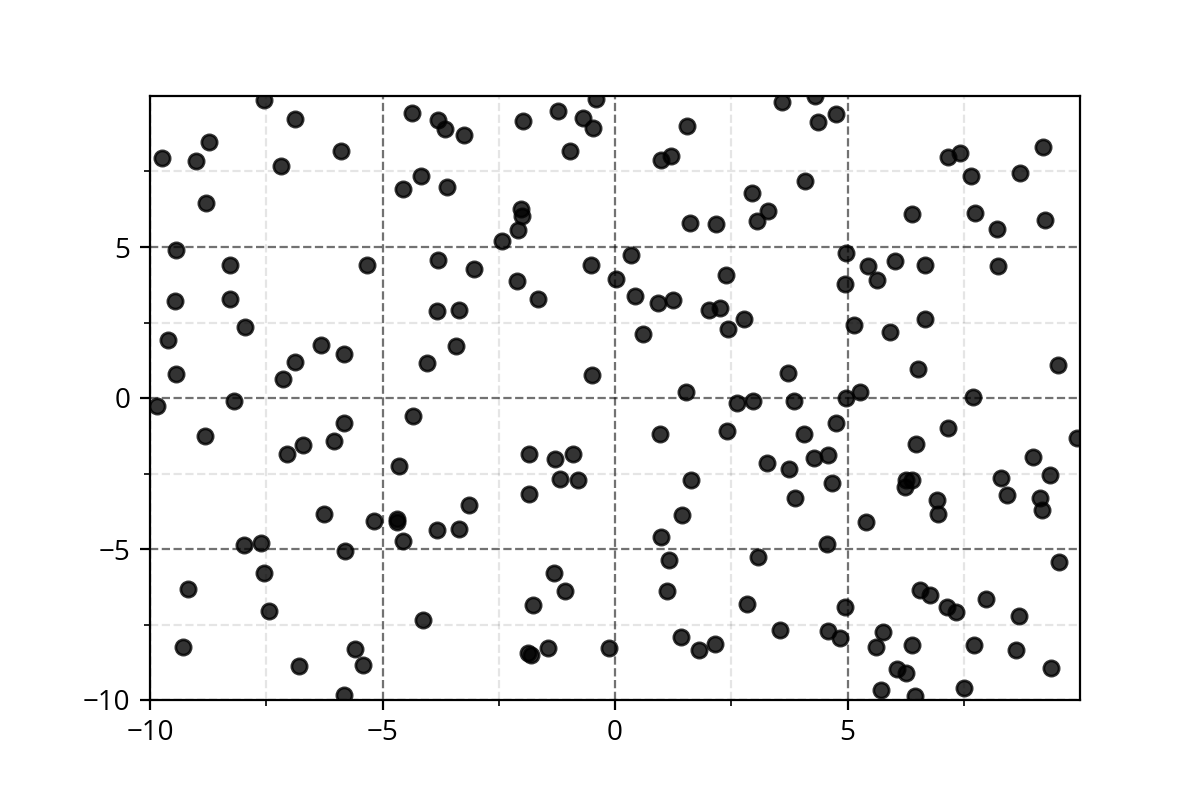
3. Now create points in two concentric circles such that phones in the range of screen size 4.5 to 5.5inch and cost 8K to 12k are positive and points outside this range are negative (all points will be black first and then the positive points will become green and negative points as blue
4. Overall the plot should look something like the cookie plot on this URL but with some gap and slightly better separation between + and - points
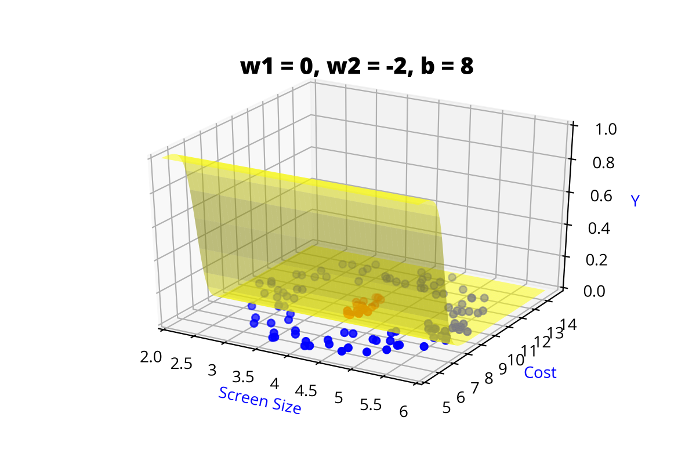
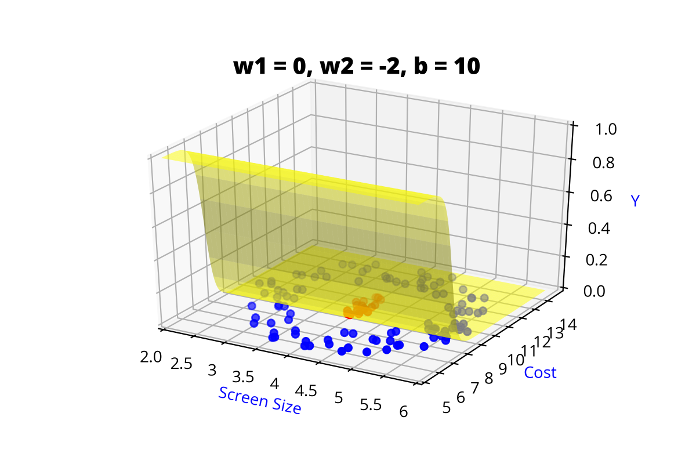
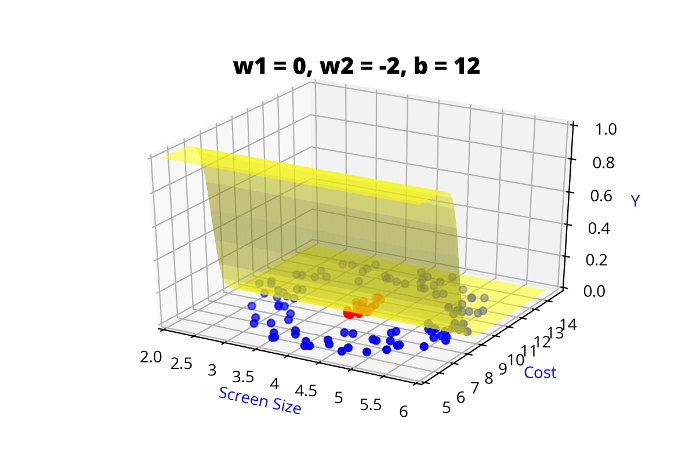
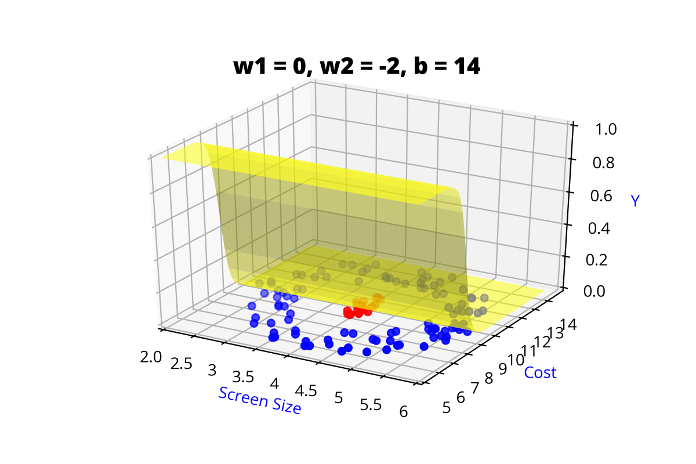
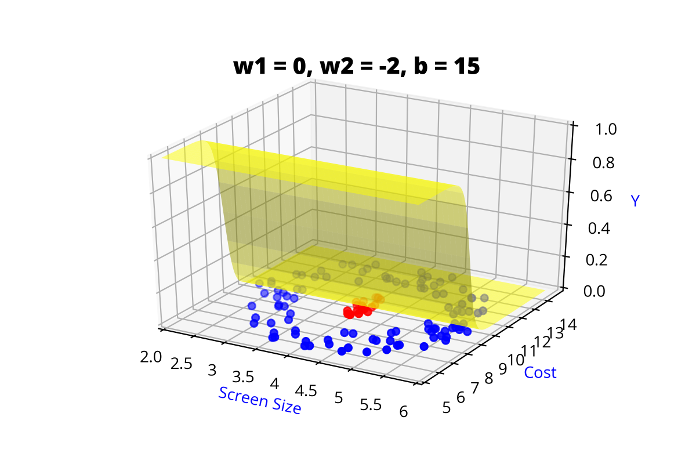
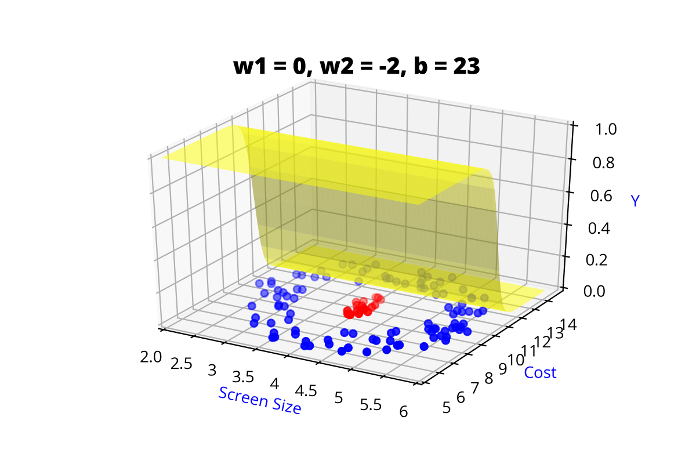
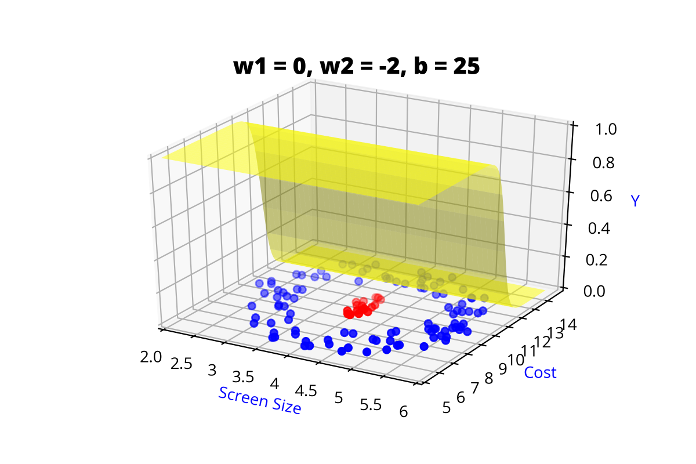
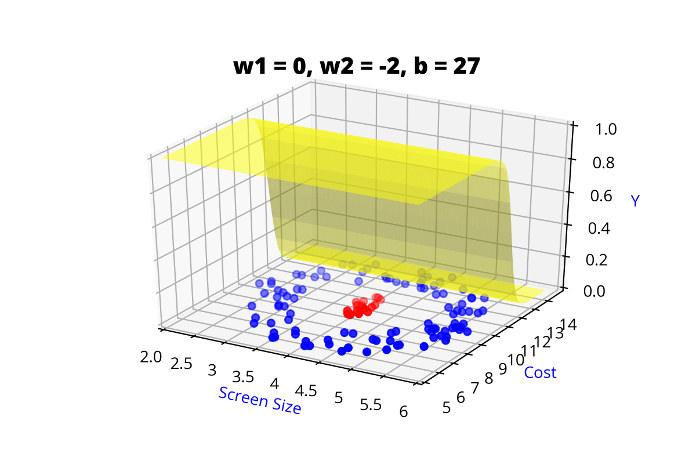
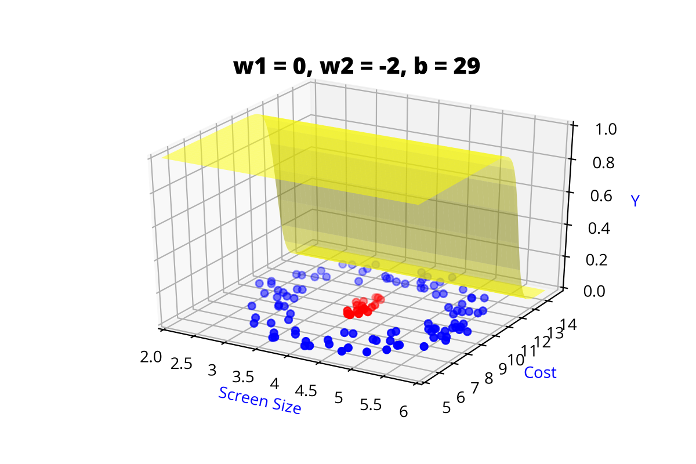
5. Now on the LHS write the function \hat_y = \hat_f (x_1, x_2)
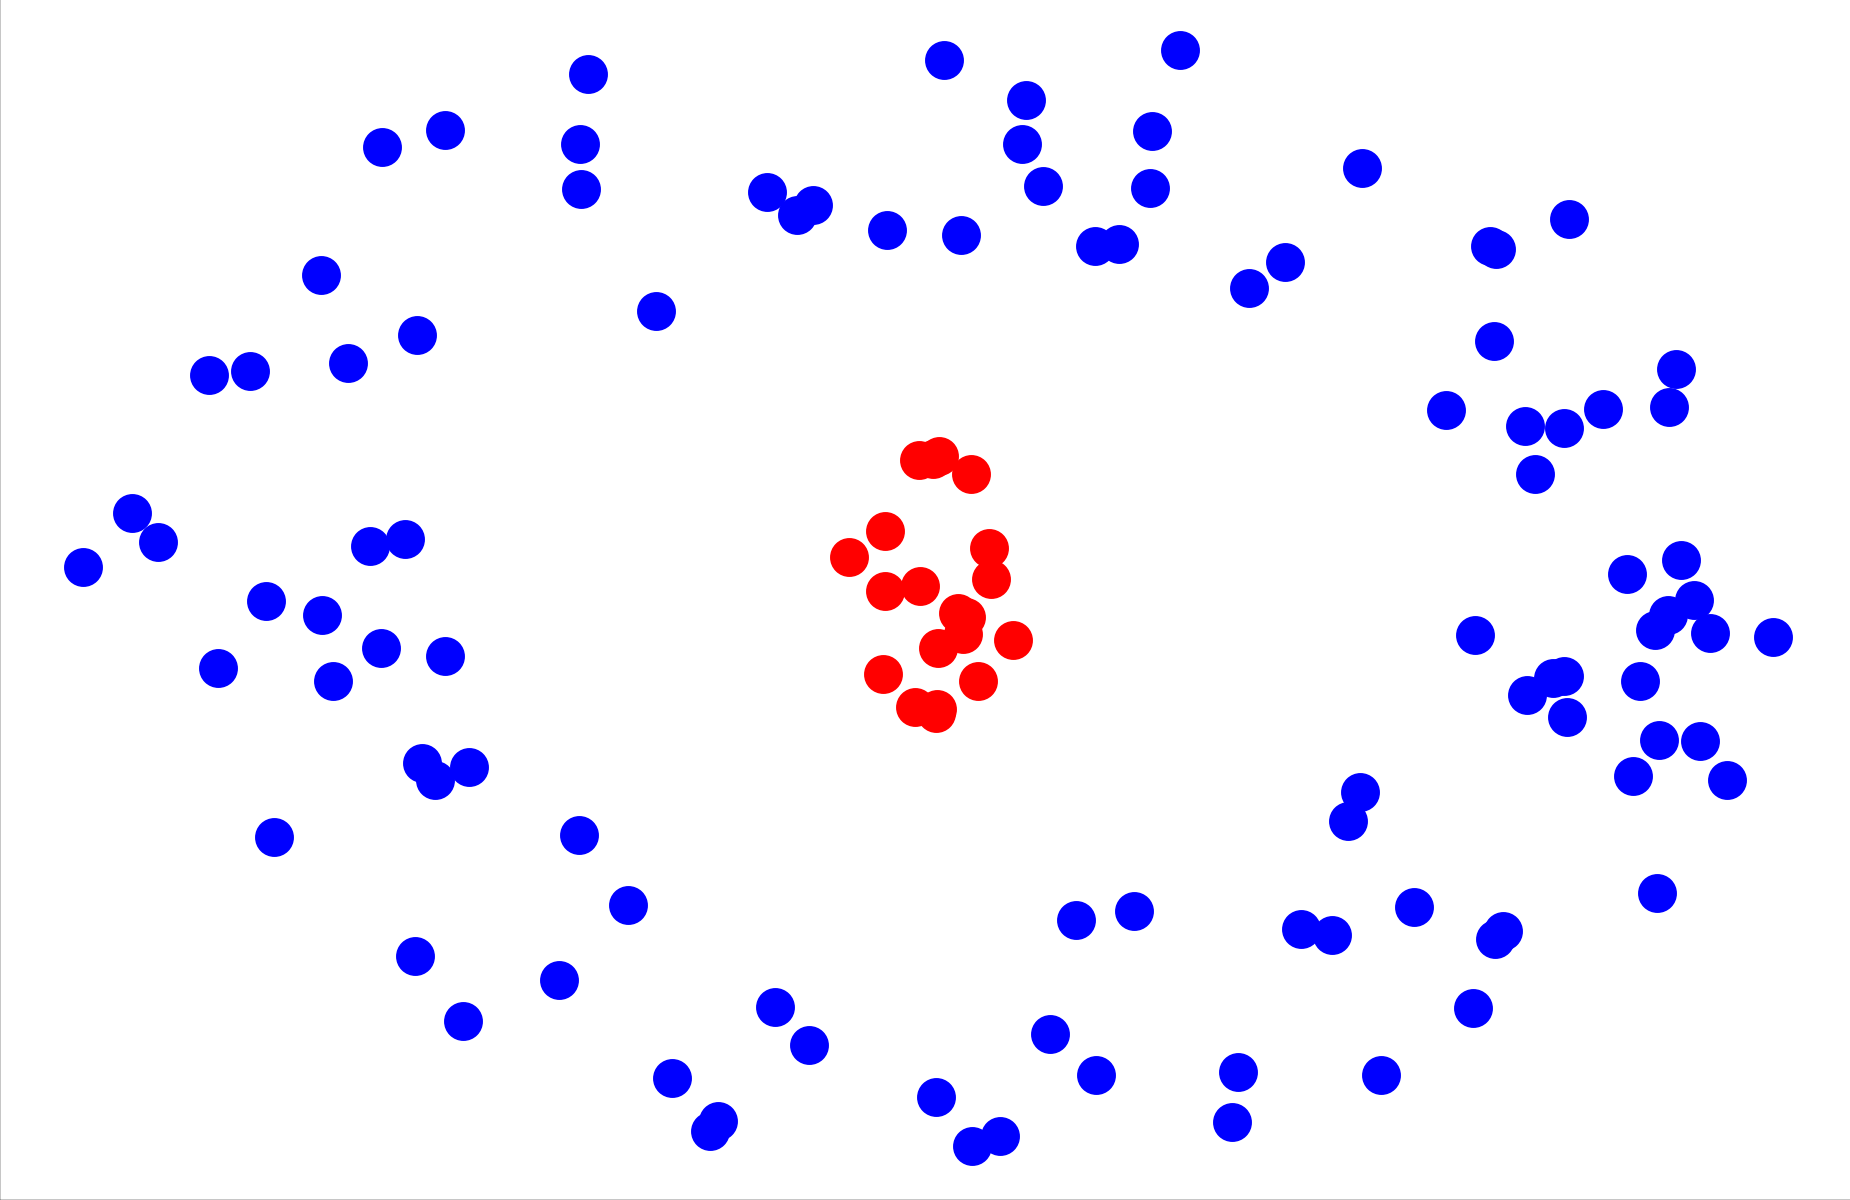
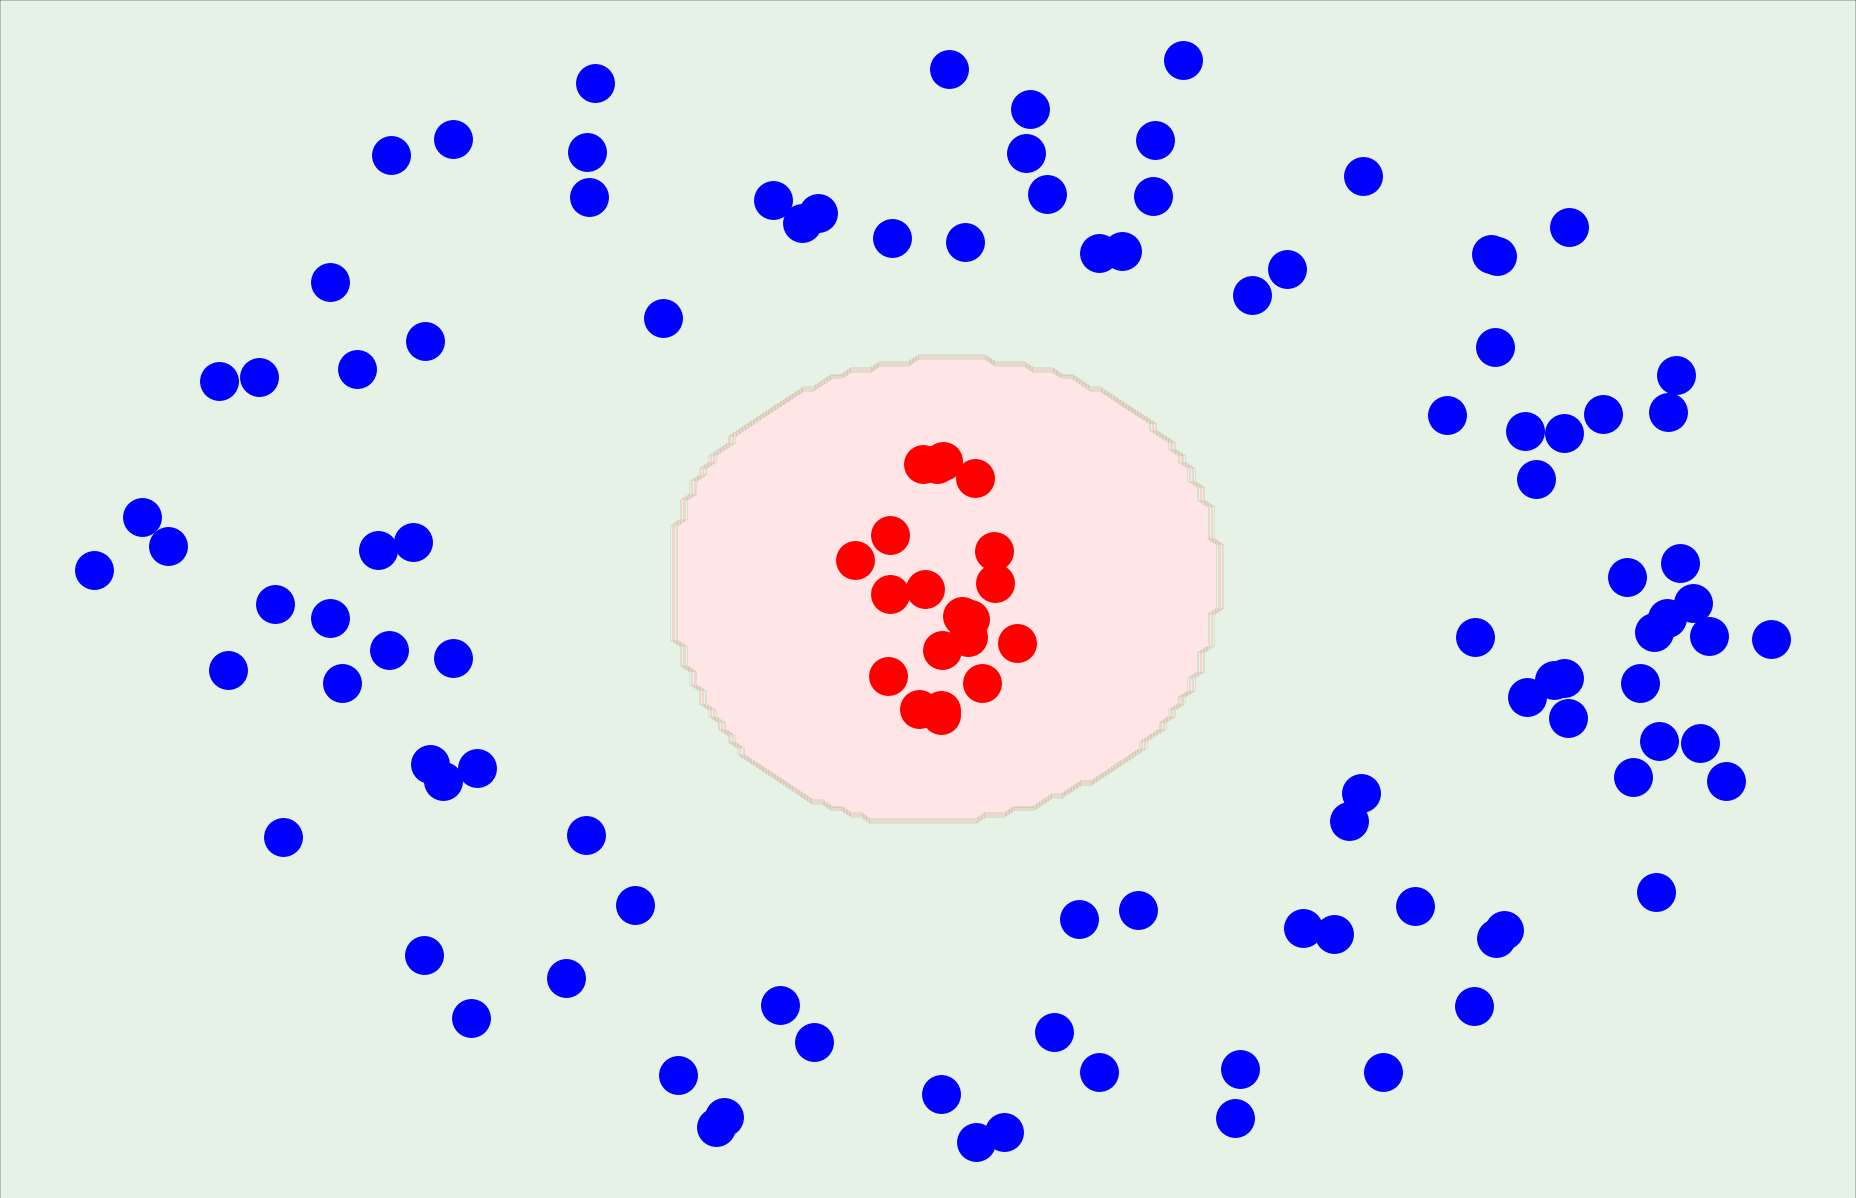
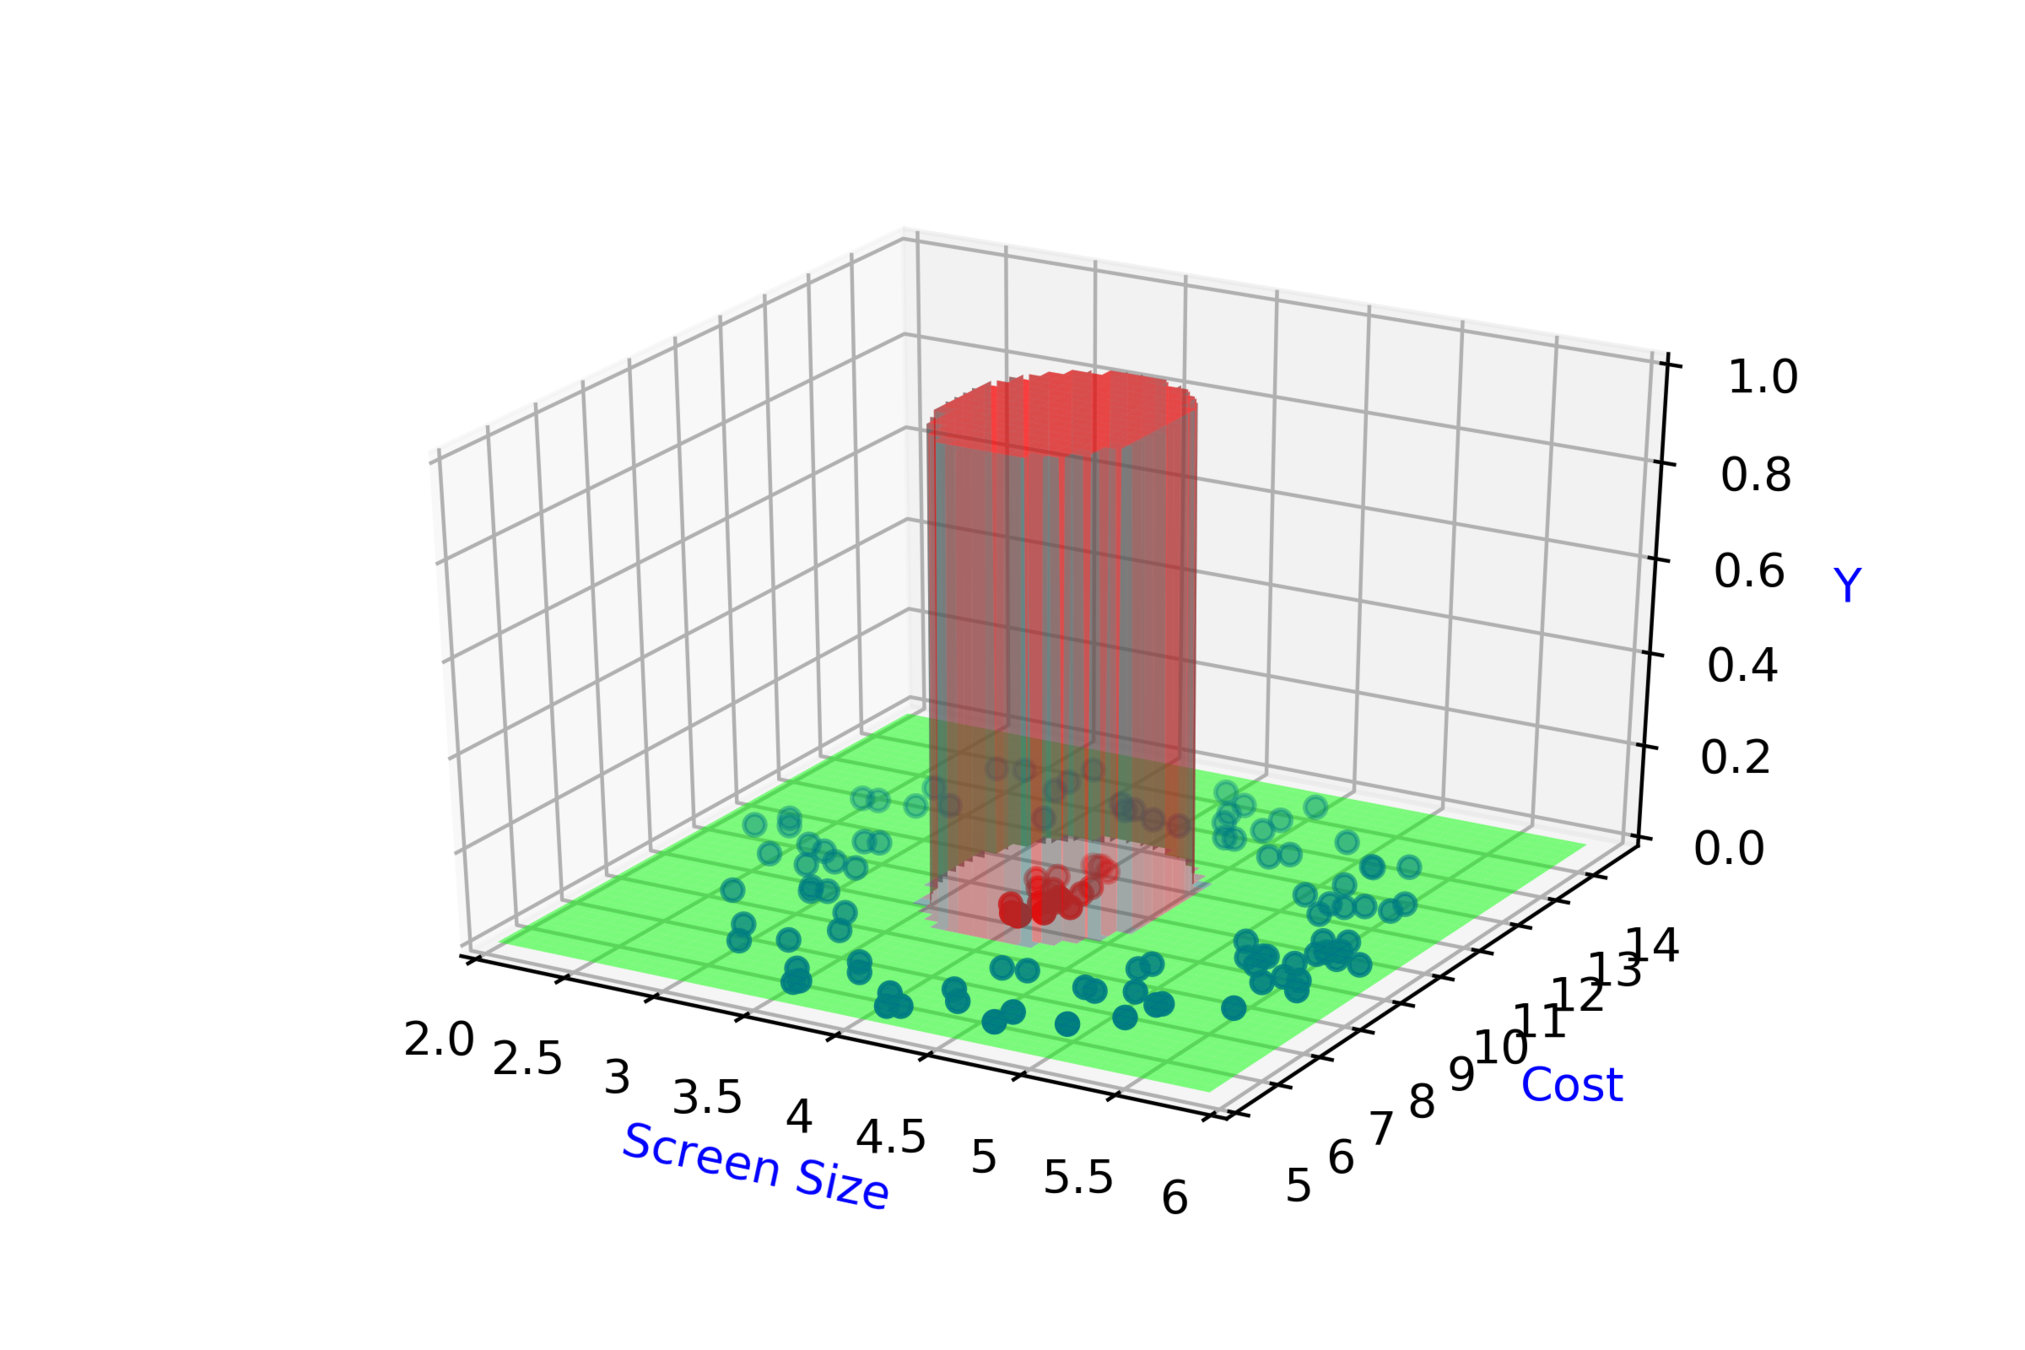
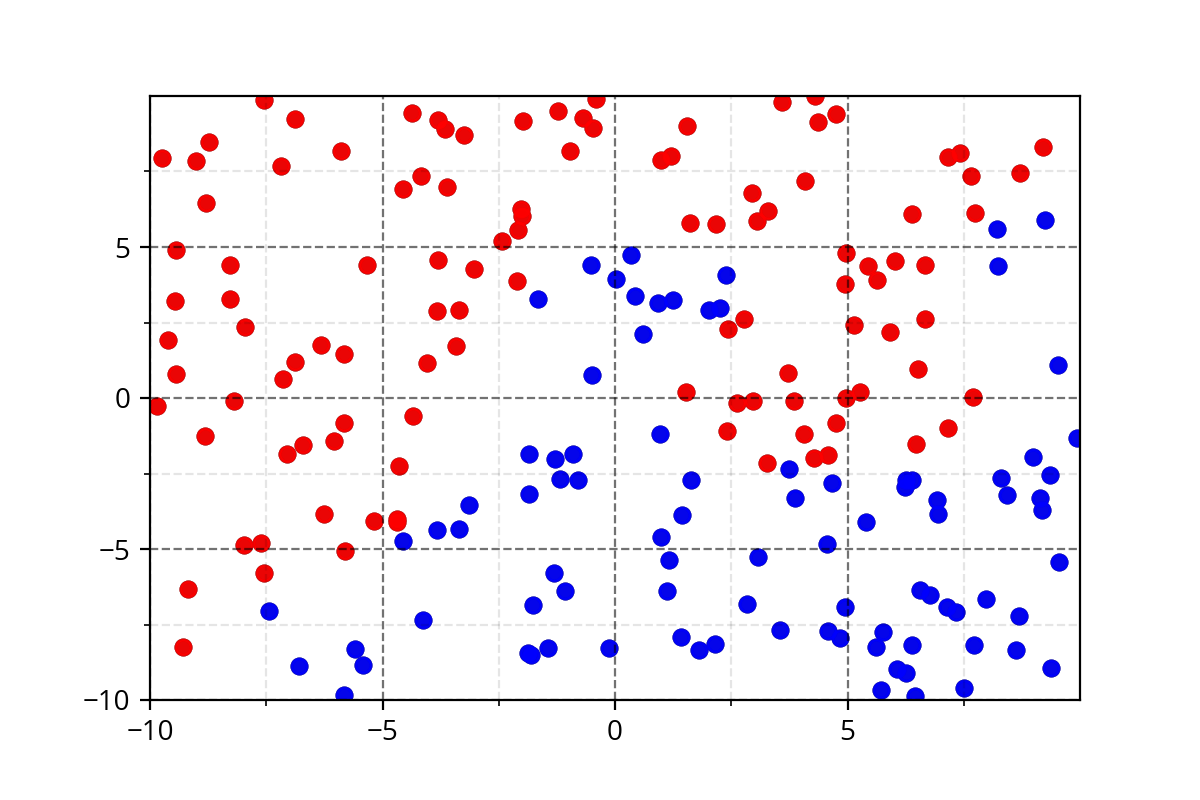
6. Now on the plot show that the function needs to output 1 (show as green zone) for the +ve points and output 0 (show as red zone) for the -ve points
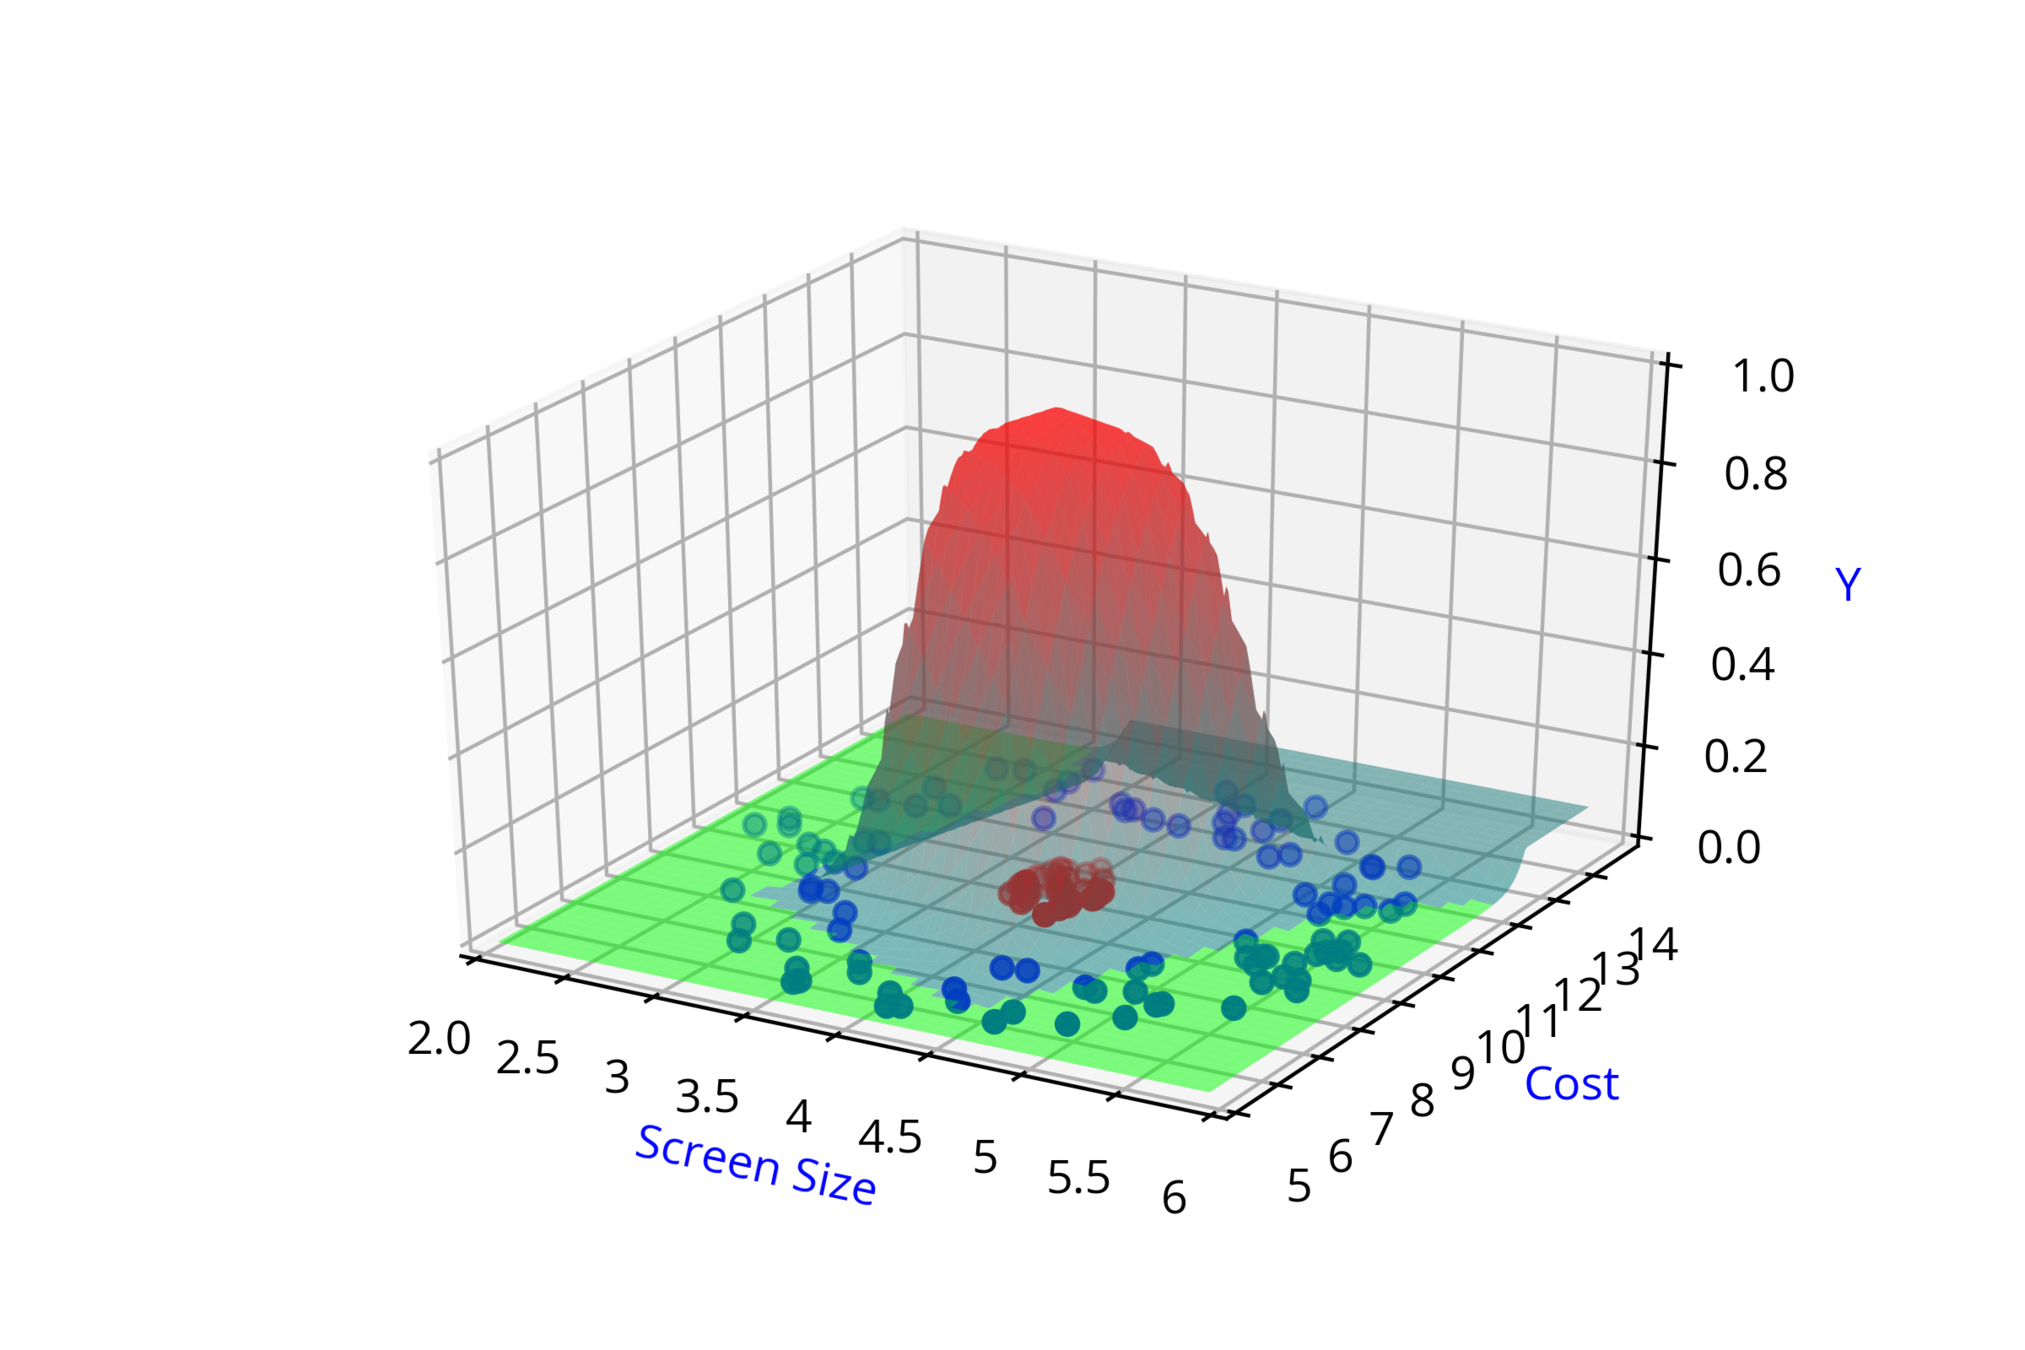
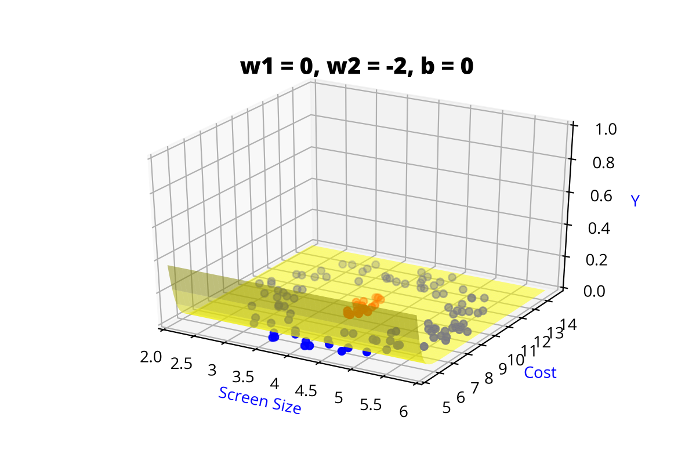
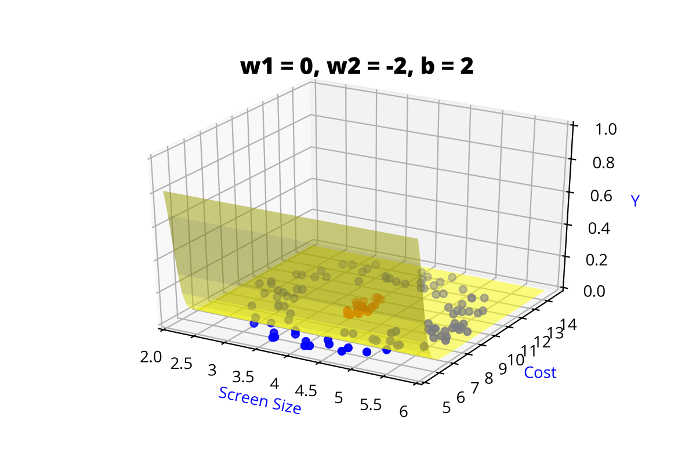
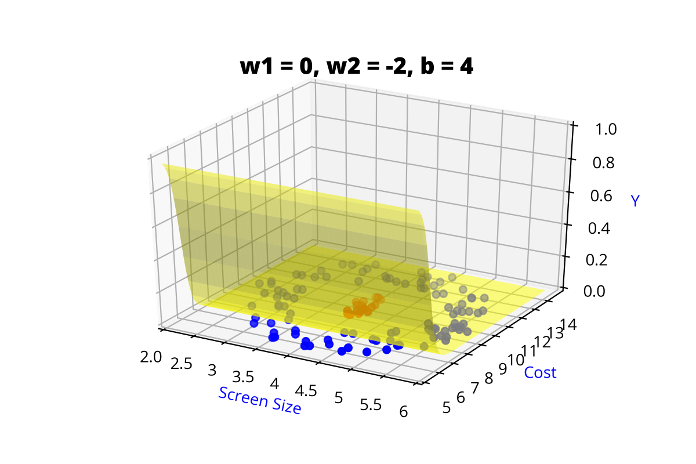
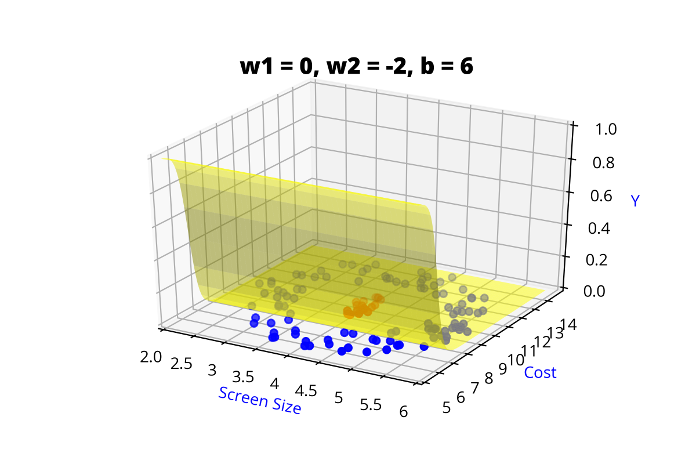
7. now complete the function by making it smooth and continuous by seamlessly connecting the green and the red zones (in the background I will be saying that what we need continuous functions)
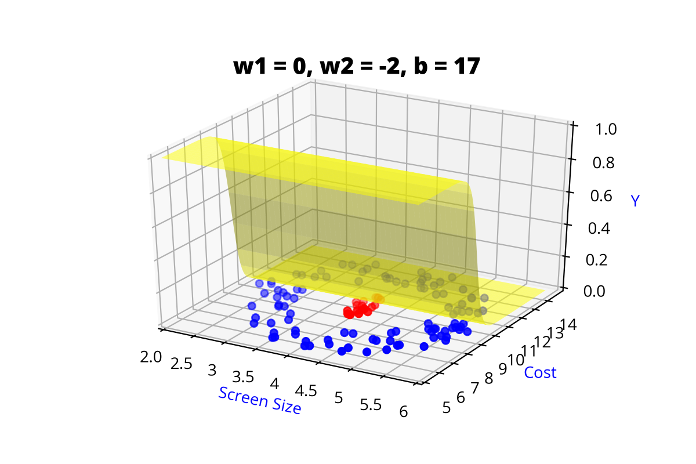
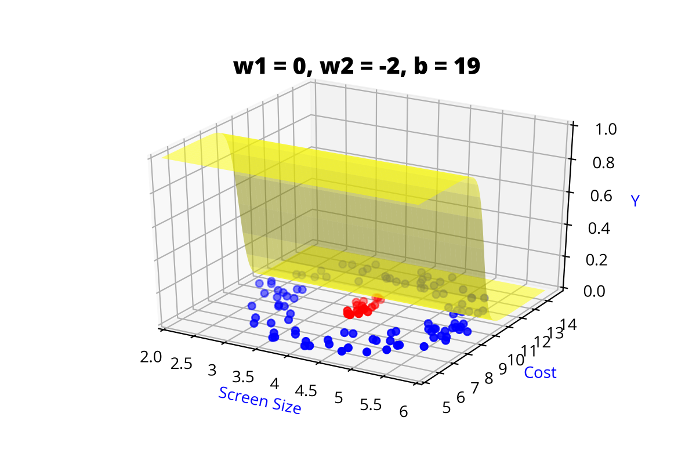
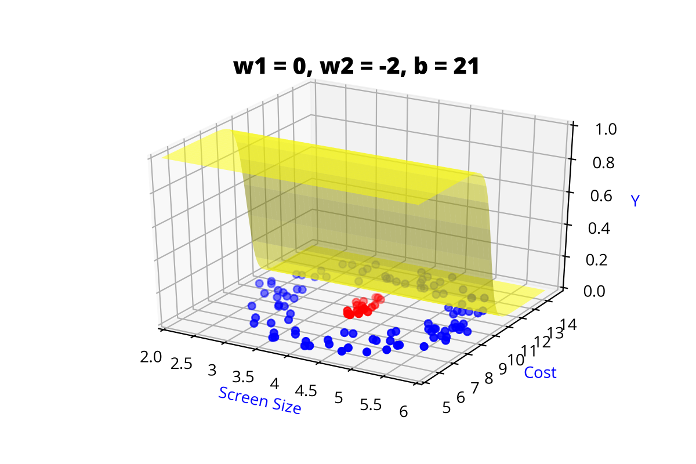
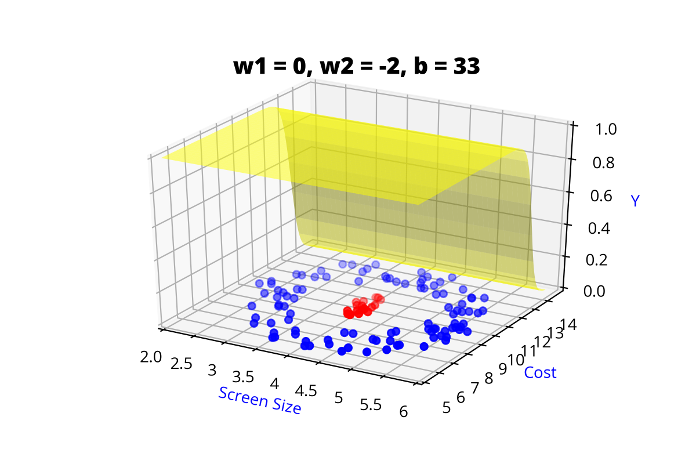
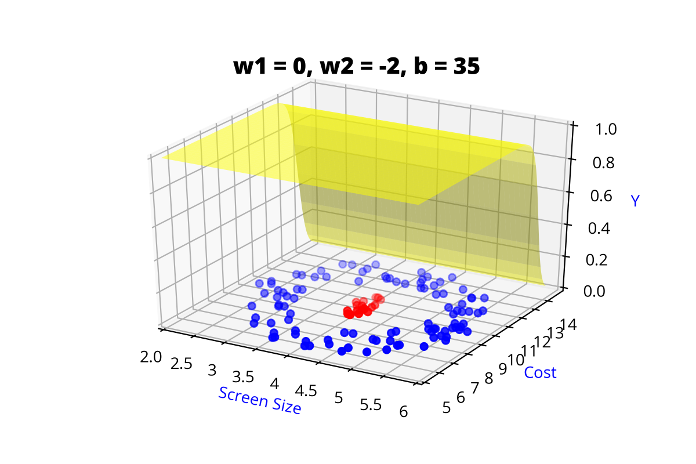
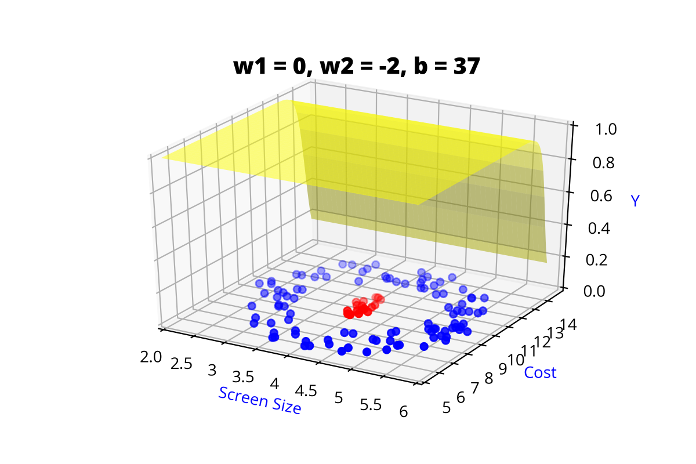
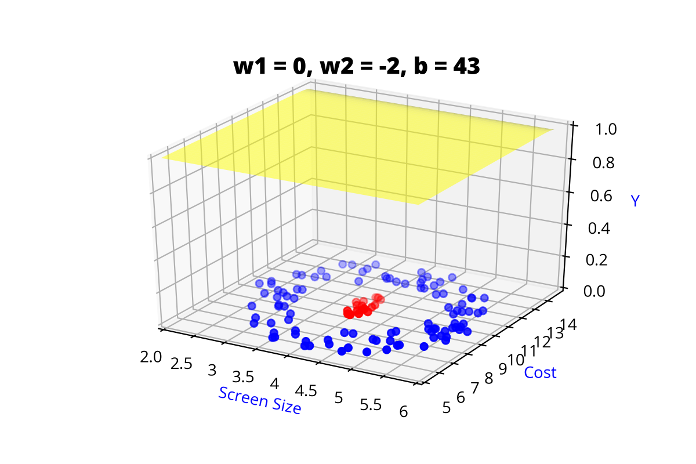
8. the above function should be something that we can write as f(x1, x2; w1, w2, b) and now show that by varying w1, w2, you can get different variants(in bg I will say that and our job is to find one which has the least error)
Modeling Complex Relations
Why do we need complex functions ?
(c) One Fourth Labs
\( x_1 \)
\(x_2\)
Screen Size
Cost
3.5
4.5
8k
12k
\( \hat{y} = 1\)
\( \hat{y} = 0 \)
\( \hat{y} = \hat{f}(x_1,x_2) \)
\( \hat{y} =\hat{f}(\hat{y_1},\hat{y_2},\hat{y_3},\hat{y_4}, w_9, w_{10}, w_{11},w_{12}, b_{5} )\)
\( \hat{y_2} = \hat{f}(x_1,x_2,w_3,w_4,b_2) \)
\( \hat{y_1} = \hat{f}(x_1,x_2,w_1,w_2,b_1) \)
\( \hat{y_3} = \hat{f}(x_1,x_2,w_5,w_6,b_3) \)
\( \hat{y_4} = \hat{f}(x_1,x_2,w_7,w_8,b_4) \)
Modeling Complex Relations
Why do we need complex functions ?
(c) One Fourth Labs
\( x_1 \)
\(x_2\)
Screen Size
Cost
3.5
4.5
8k
12k
\( \hat{y} = \hat{f}(x_1,x_2) \)
\( \hat{y} = 1\)
\( \hat{y} = 0 \)
\( \hat{y} =\hat{f}(\hat{y_1},\hat{y_2},\hat{y_3},\hat{y_4}, w_9, w_{10}, w_{11},w_{12}, b_{5} )\)
\( \hat{y_2} = \hat{f}(x_1,x_2,w_3,w_4,b_2) \)
\( \hat{y_1} = \hat{f}(x_1,x_2,w_1,w_2,b_1) \)
\( \hat{y_3} = \hat{f}(x_1,x_2,w_5,w_6,b_3) \)
\( \hat{y_4} = \hat{f}(x_1,x_2,w_7,w_8,b_4) \)
Modeling Complex Relations
Why do we need complex functions ?
(c) One Fourth Labs
\( \hat{y} = \hat{f}(x_1,x_2) \)
\( \hat{y} =\hat{f}(\hat{y_1},\hat{y_2},\hat{y_3},\hat{y_4}, w_9, w_{10}, w_{11},w_{12}, b_{5} )\)
\( \hat{y_2} = \hat{f}(x_1,x_2,w_3,w_4,b_2) \)
\( \hat{y_1} = \hat{f}(x_1,x_2,w_1,w_2,b_1) \)
\( \hat{y_3} = \hat{f}(x_1,x_2,w_5,w_6,b_3) \)
\( \hat{y_4} = \hat{f}(x_1,x_2,w_7,w_8,b_4) \)
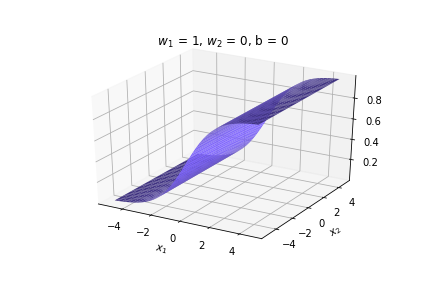
\( \hat{y} = \frac{1}{1+e^{-(w_1* x_1 + w_2*x_2+b)}} \)

\(w_1\)
\(w_2\)
\(x_2\)
\(x_1\)
\( \hat{y} \)


Are such complex functions seen in most real world examples ?
If so, how do I even come up with such complex functions?
Modeling Complex Relations
Why do we need complex functions ?
(c) One Fourth Labs
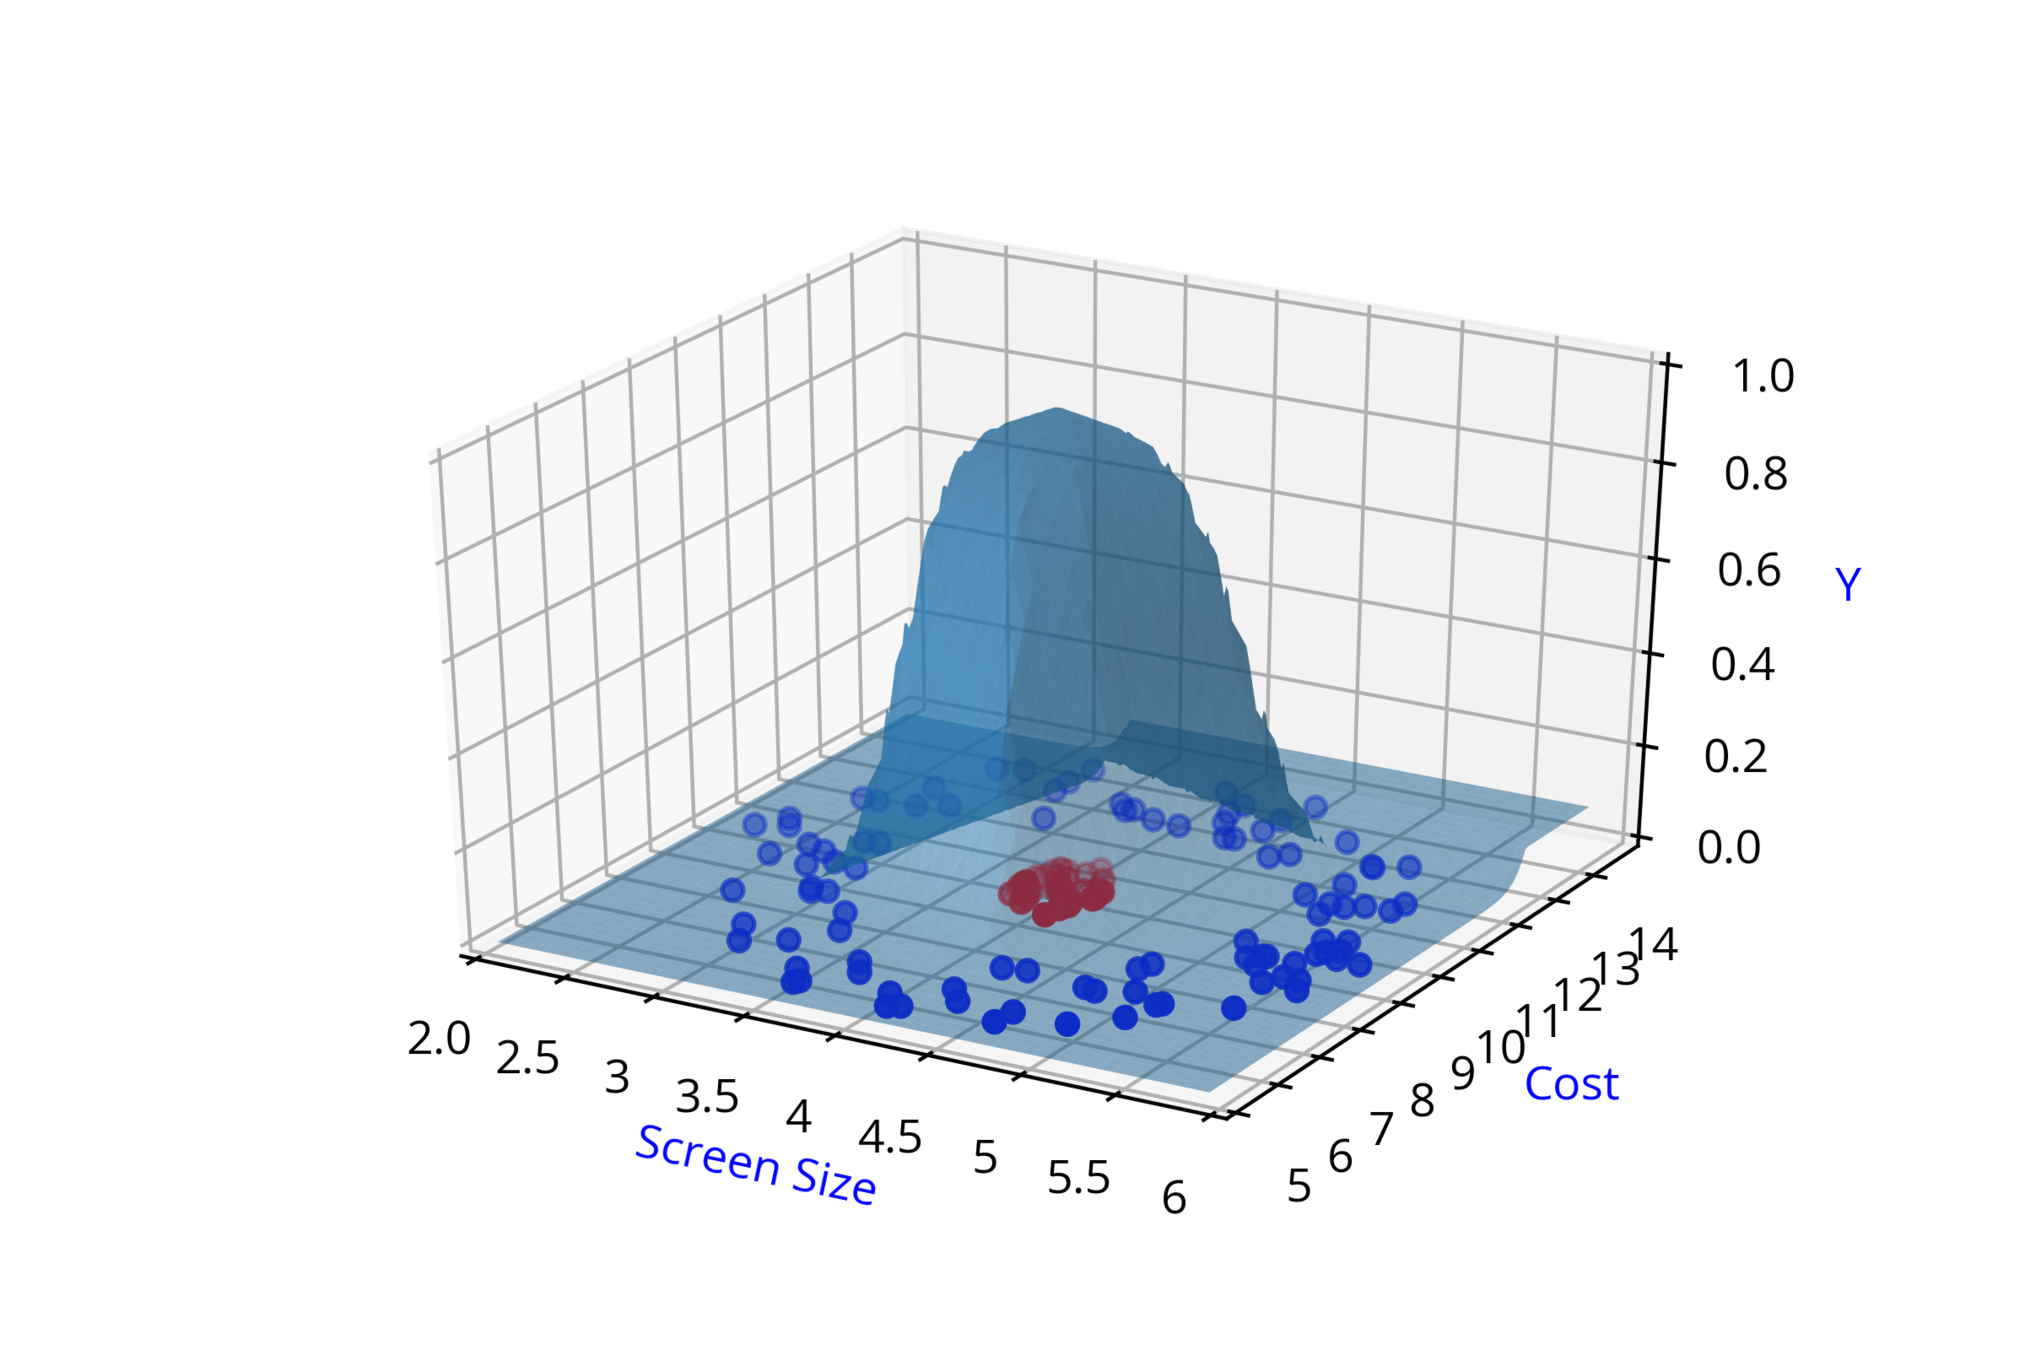
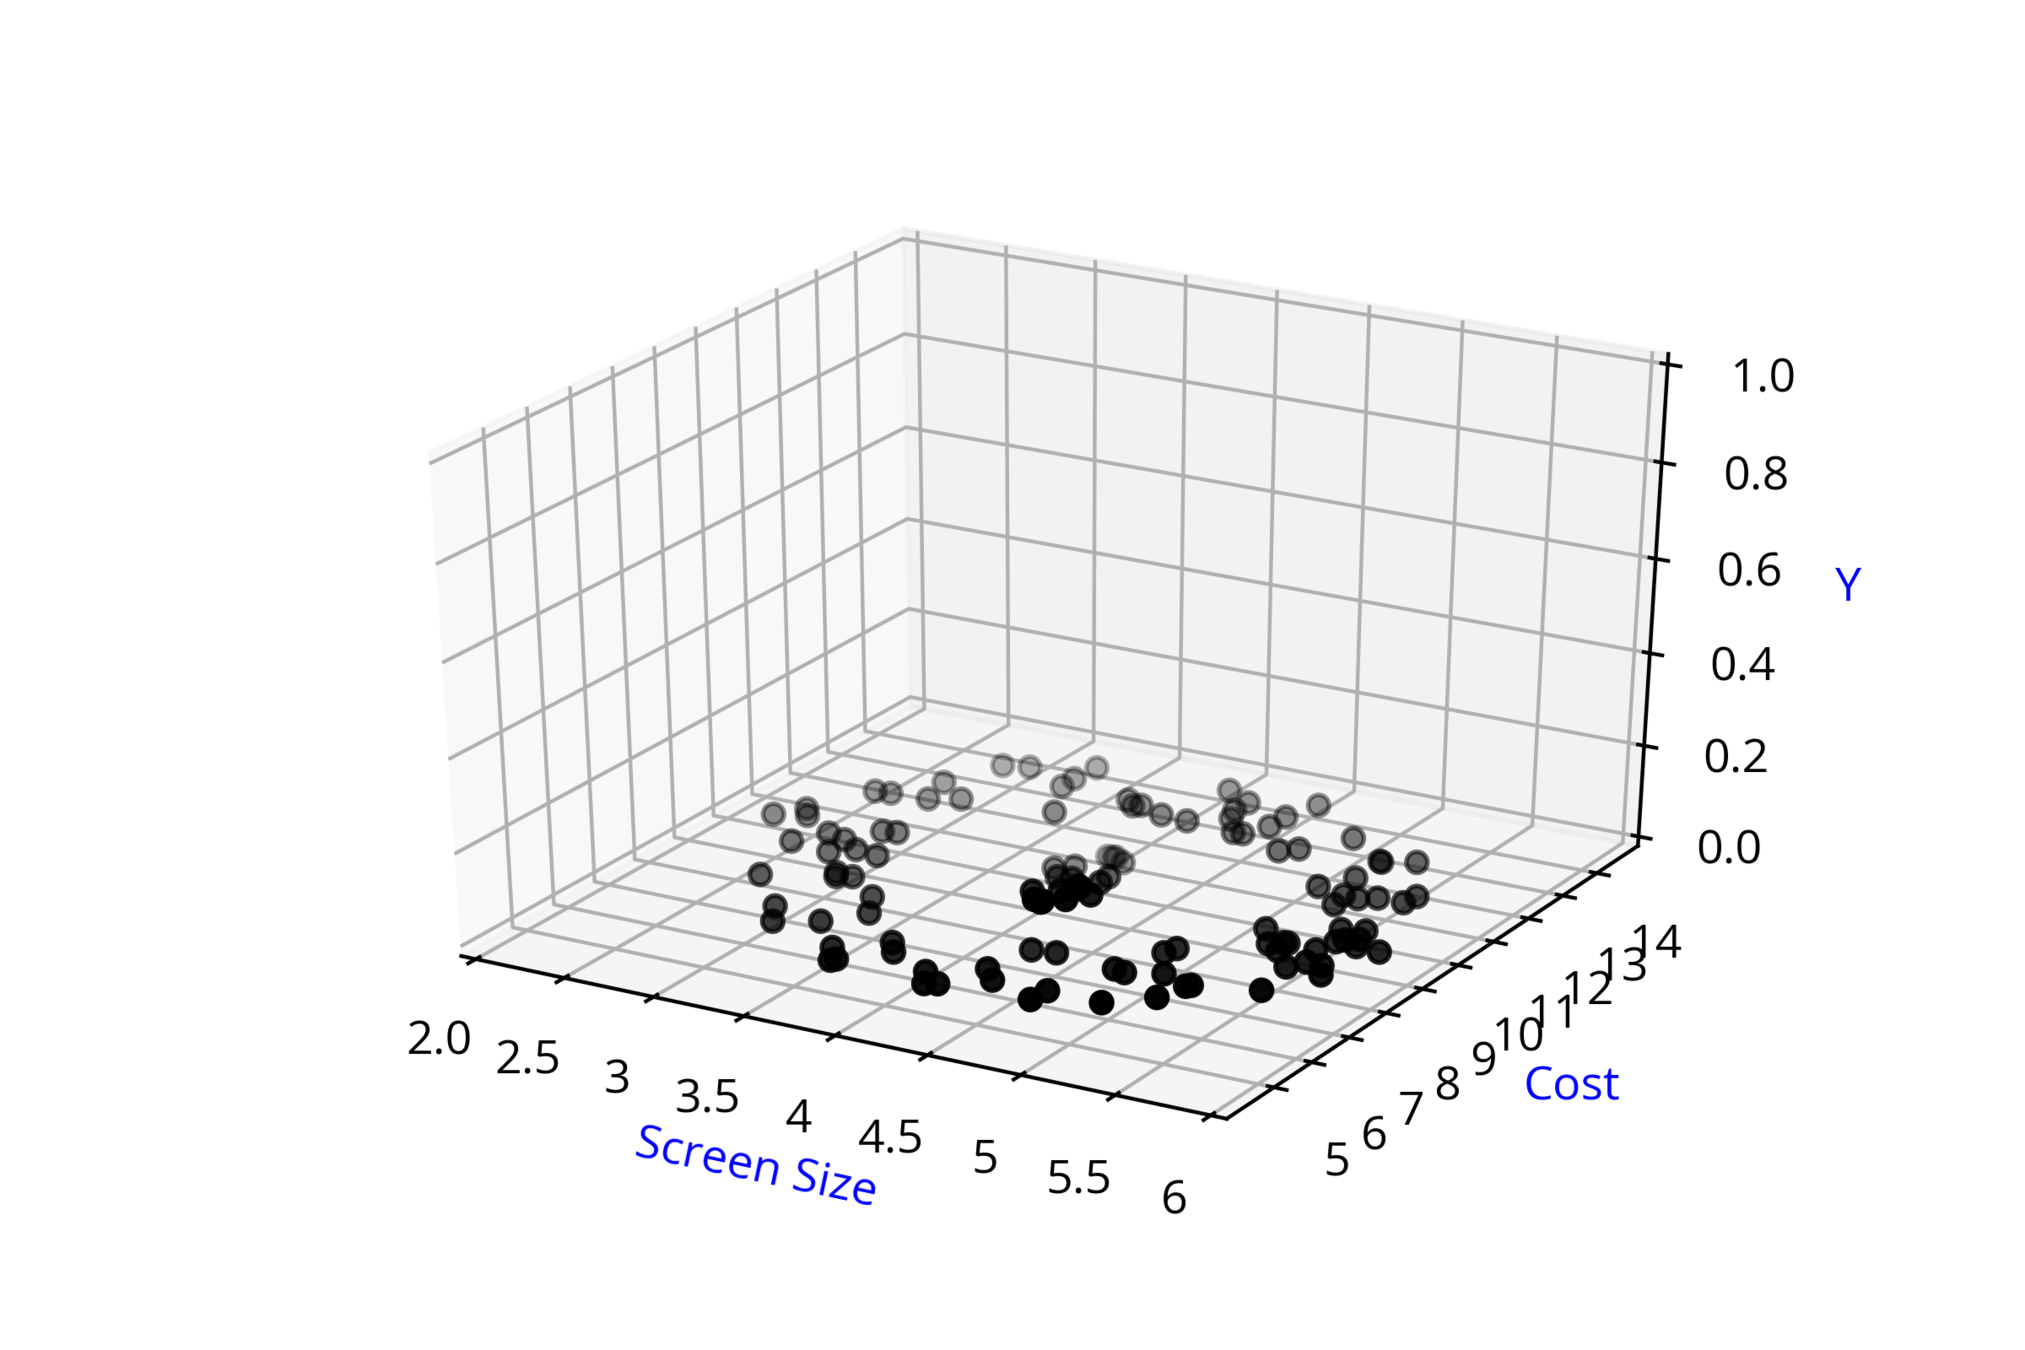
Continue with the above slide and again show that sigmoid cannot fit this data no matter how you adjust this
In the RHS bottom corner show the cartoon person with 2 functions:
1) Are such complex functions seen in most real world examples ?
2) If so, how do I even come up with such complex functions?
Modeling Complex Relations
Are such complex functions seen in most real world examples ?
(c) One Fourth Labs
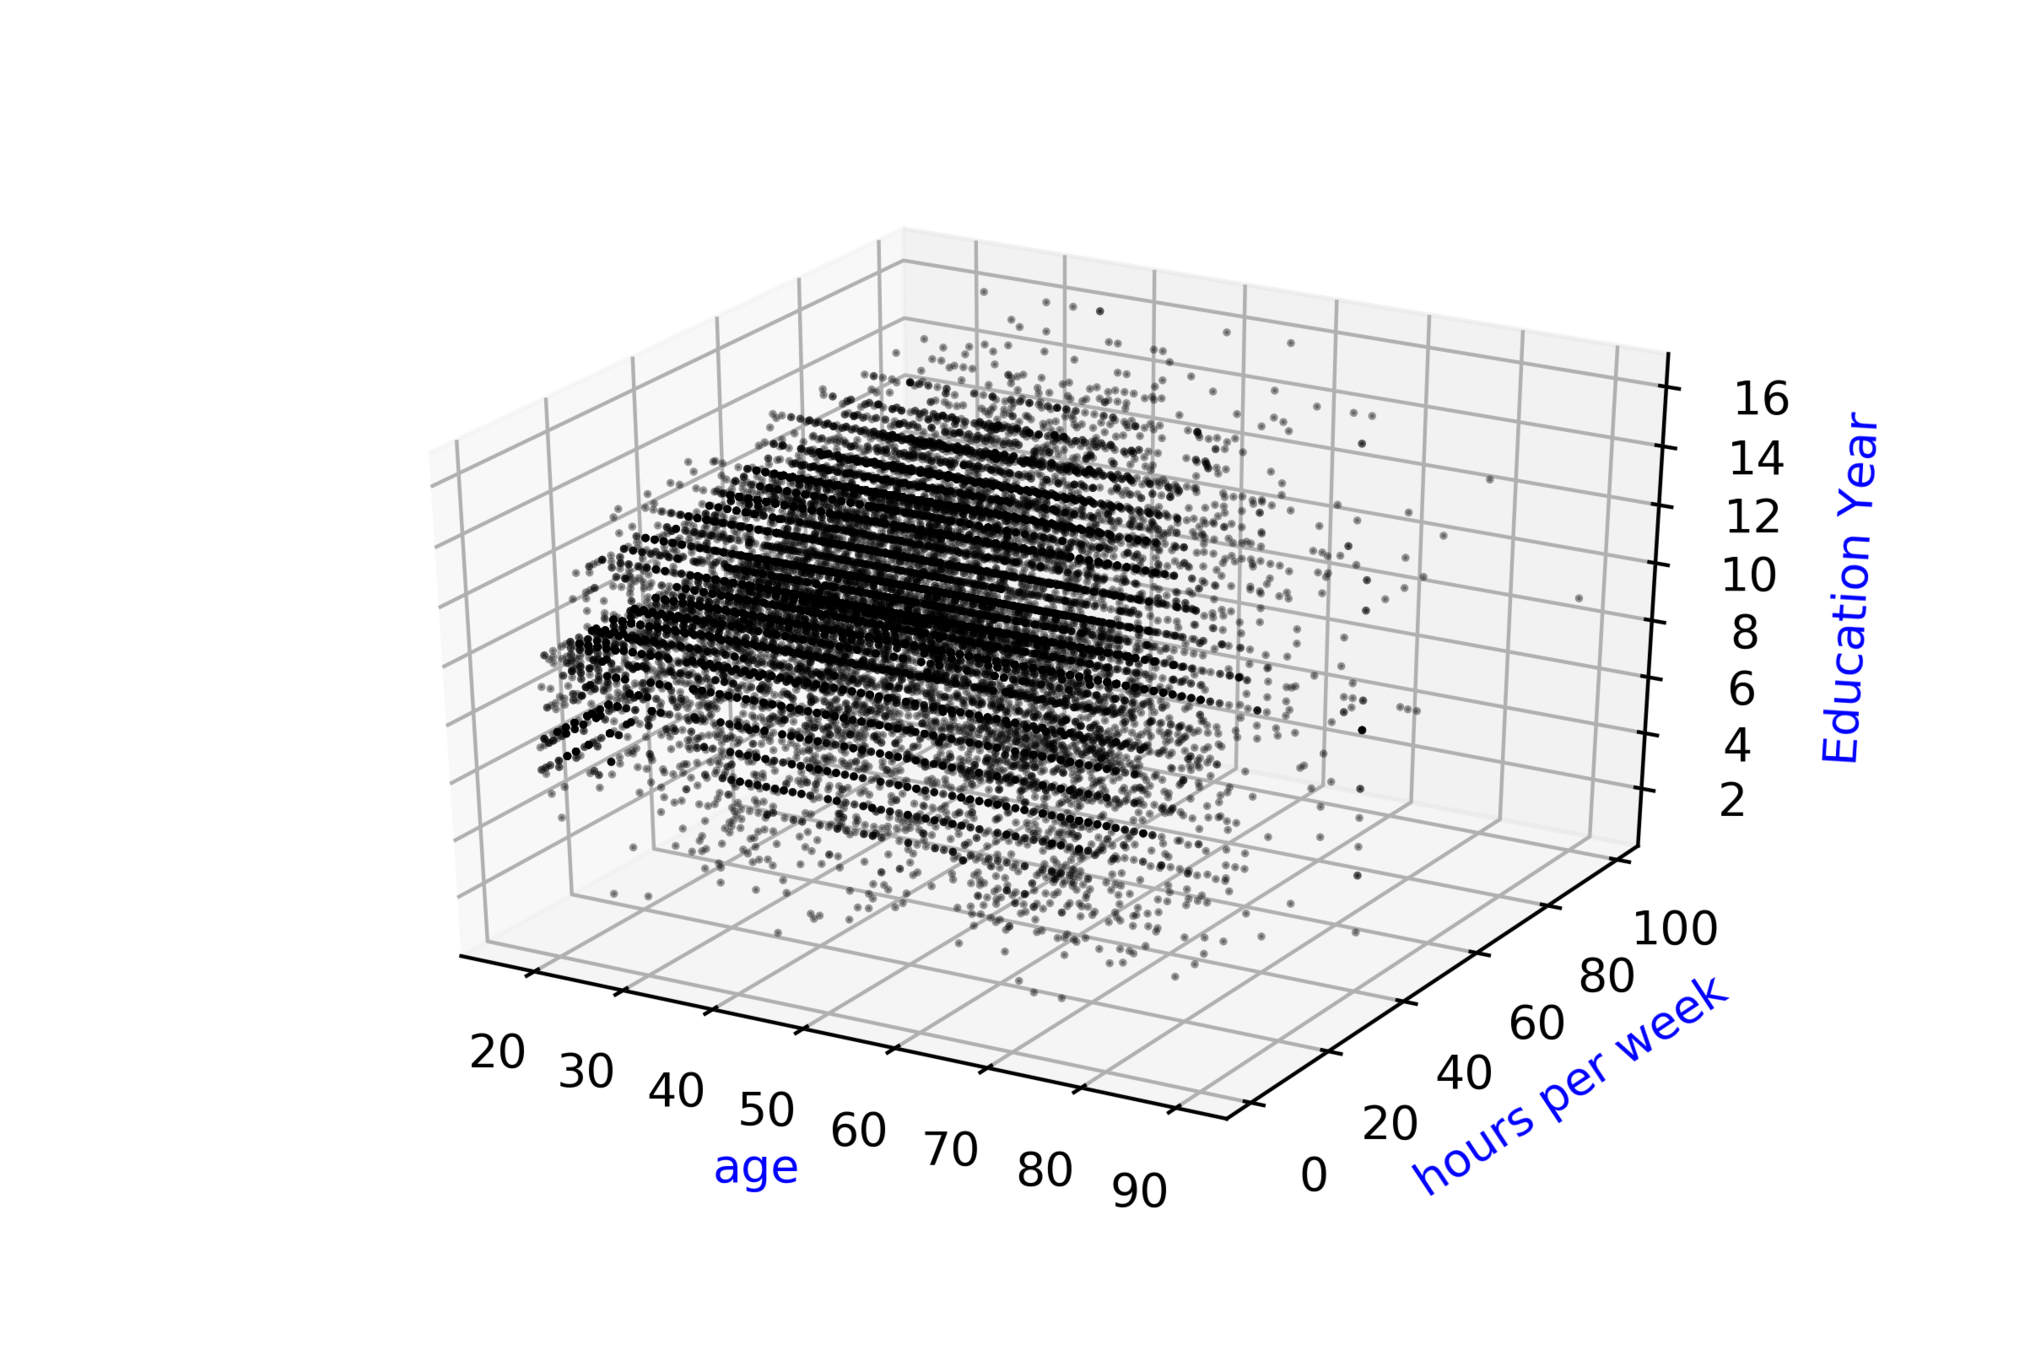
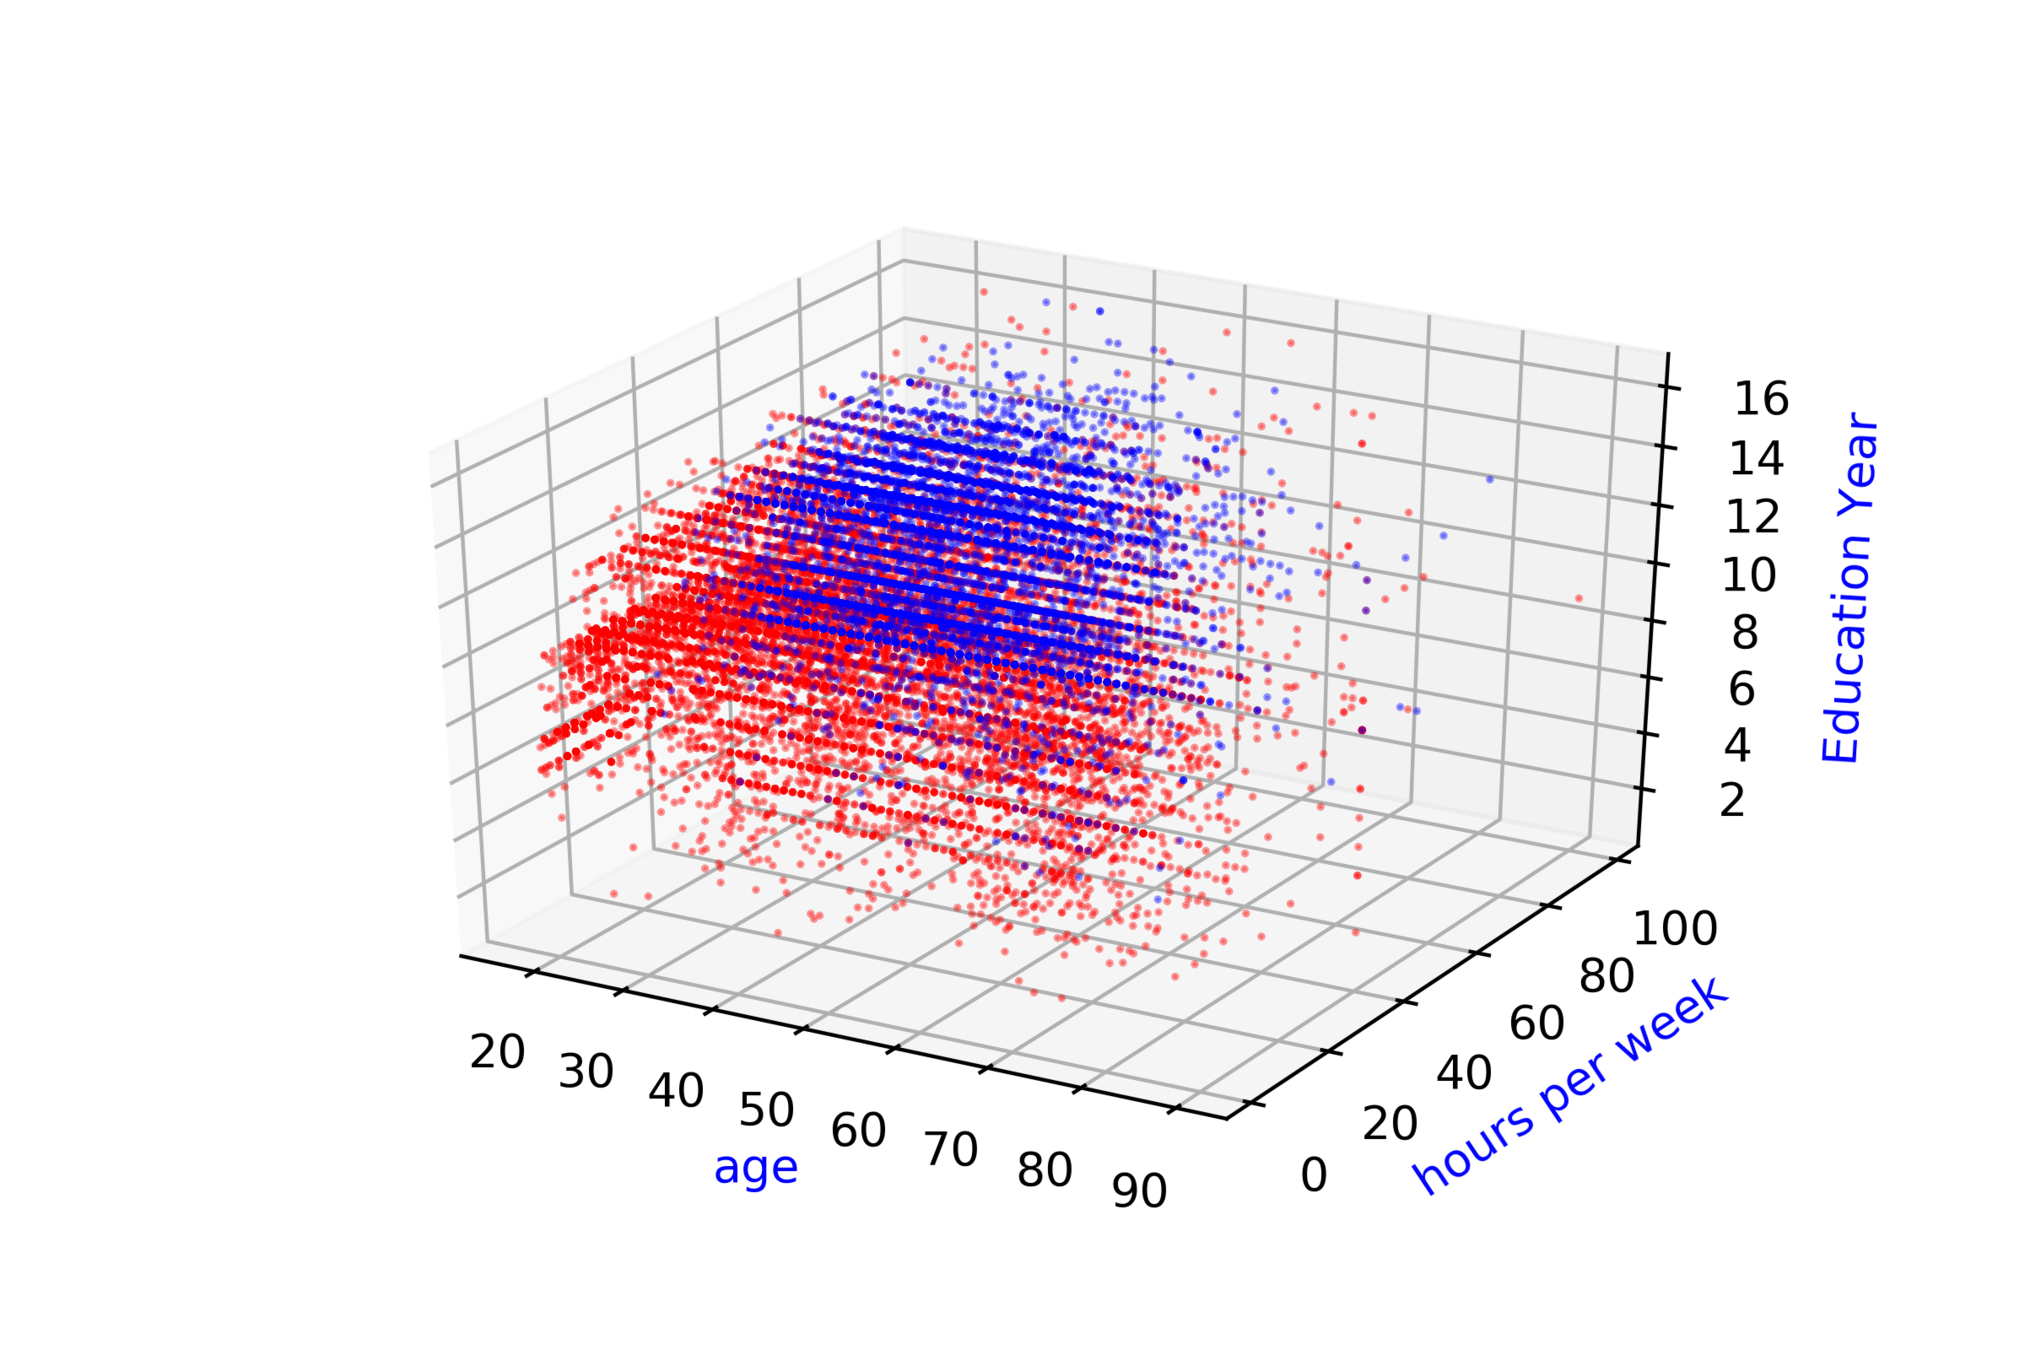
Adult Census Income\( ^{*} \)
Whether Annual Income of person \( \geq \) 50k or \( < \) 50k ?
| Age |
| 90 |
| 54 |
| 74 |
| 45 |
| hour/week |
| 40 |
| 40 |
| 20 |
| 35 |
| Education year |
| 9 |
| 4 |
| 16 |
| 16 |
| Income |
| 0 |
| 0 |
| 1 |
| 1 |
\( \hat{y} = \hat{f}(x_1, x_2, .... ,x_{14}) \)
\( \hat{income} = \hat{f}(age,hour, ...,education) \)
Modeling Complex Relations
Are such complex functions seen in most real world examples ?
(c) One Fourth Labs
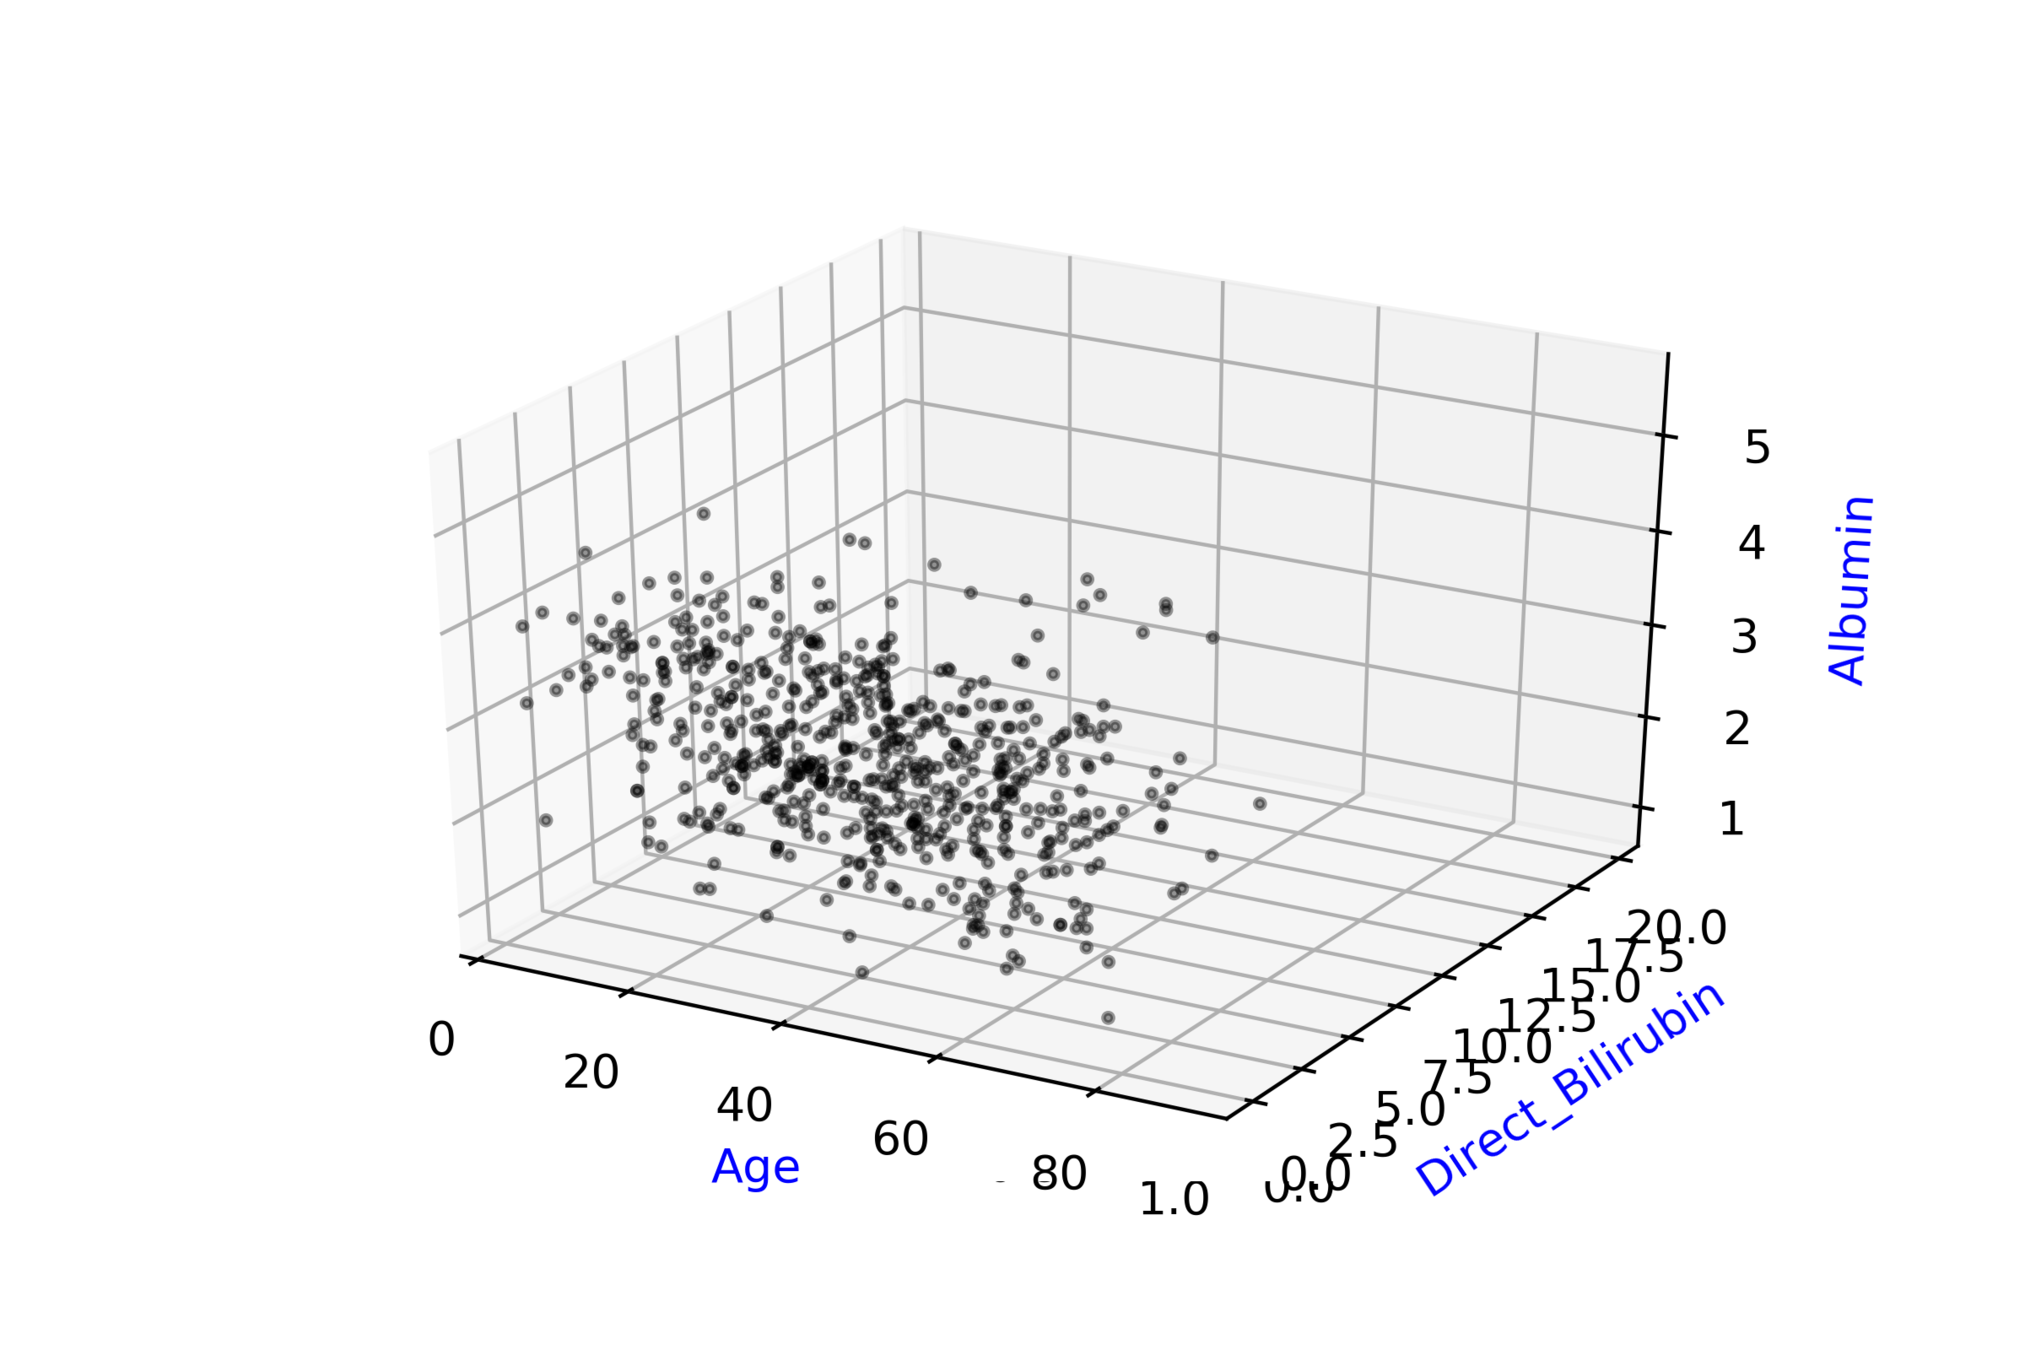
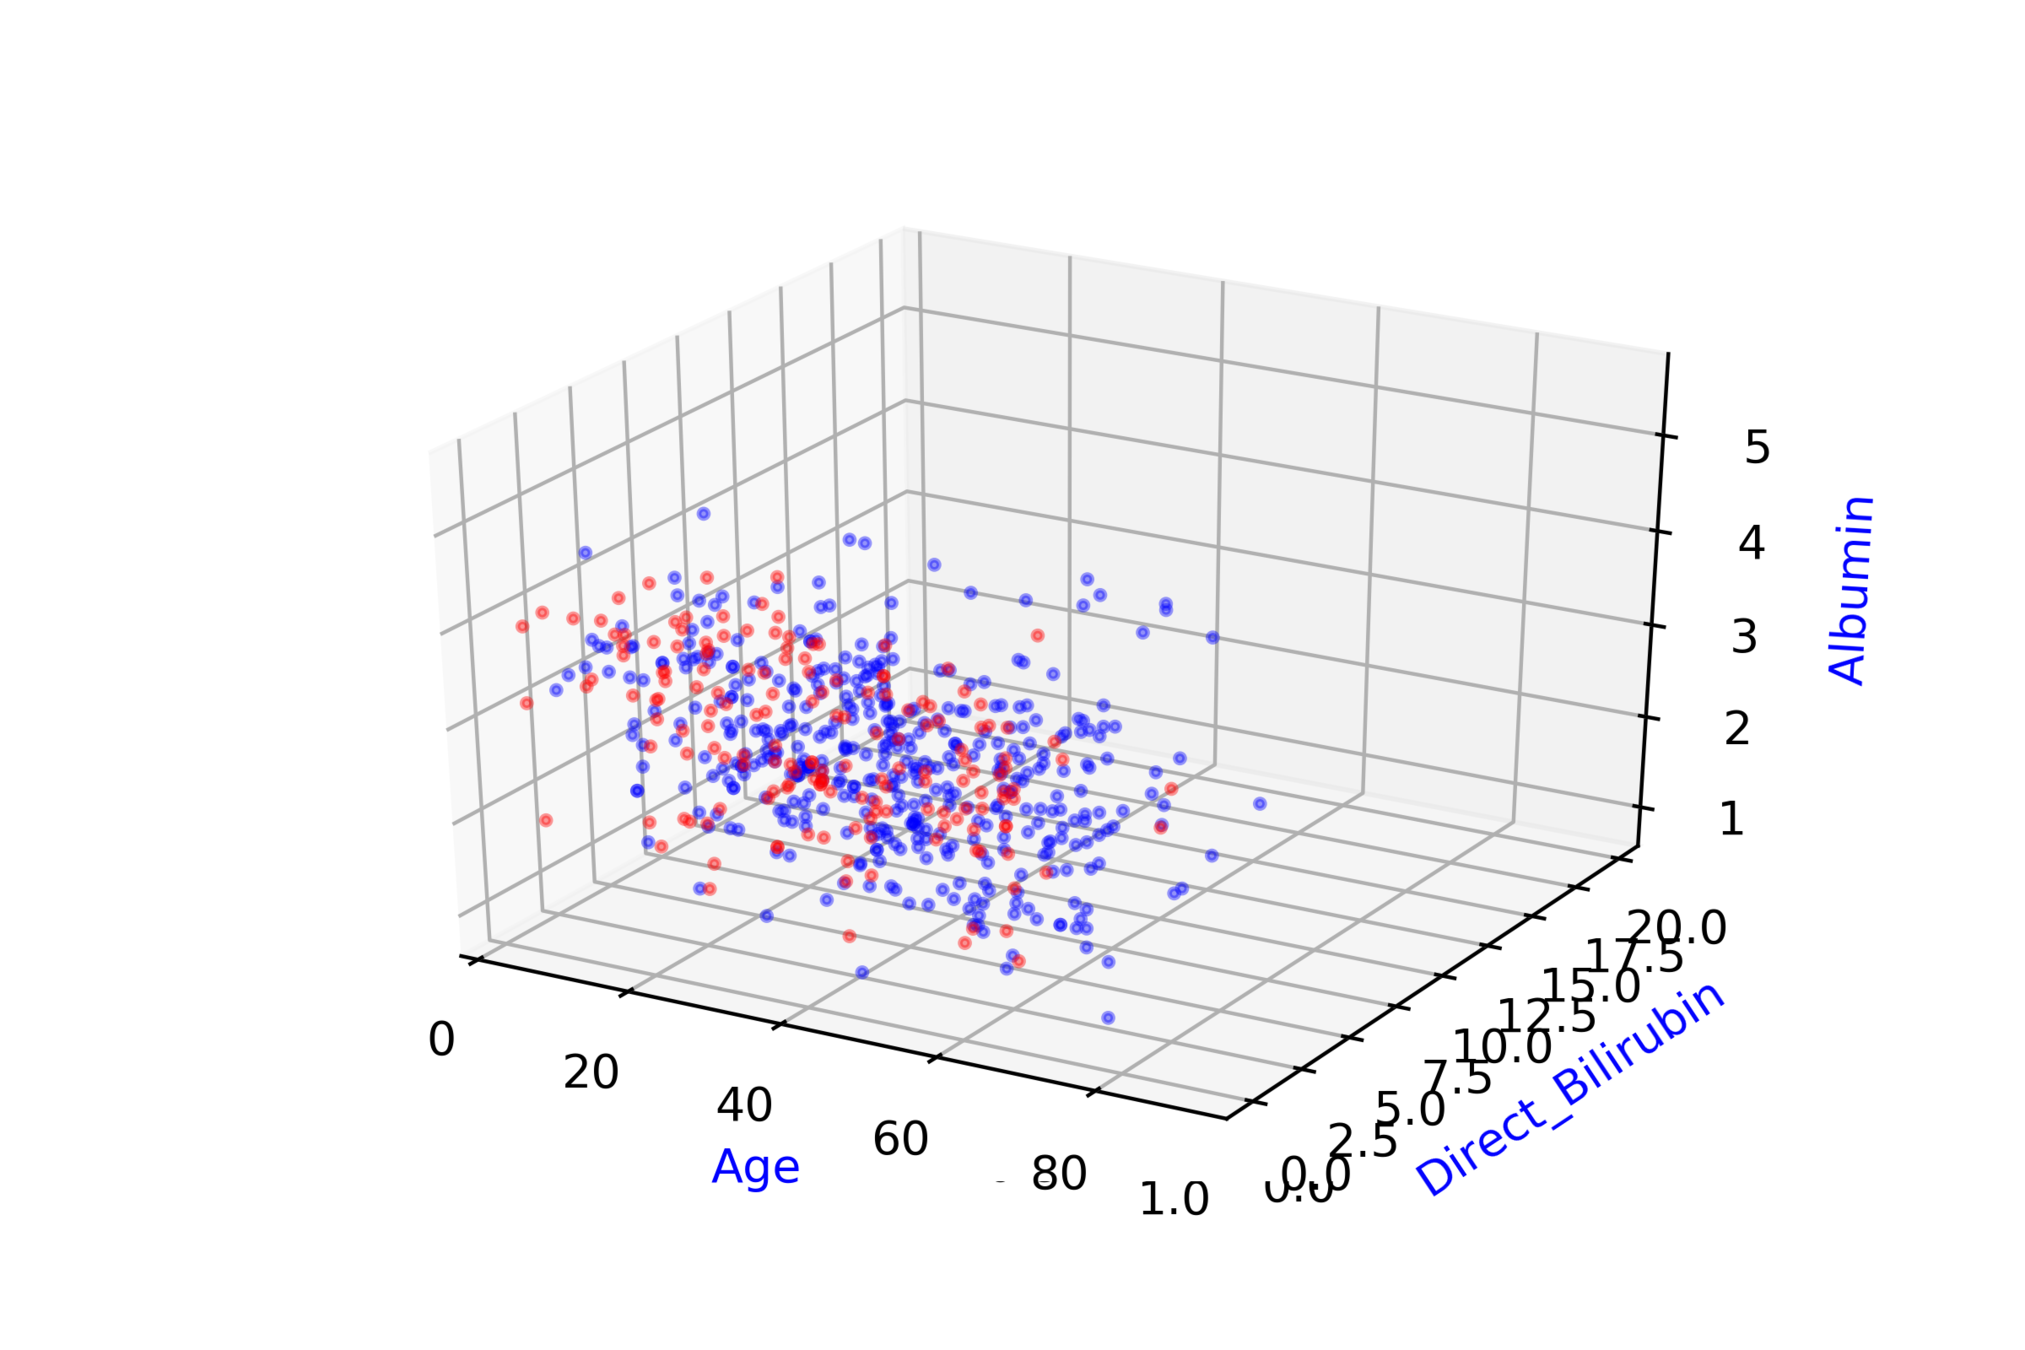
Indian Liver Patient Records\( ^{*} \)
whether person needs to be diagnosed or not ?
| Age |
| 65 |
| 62 |
| 20 |
| 84 |
| Albumin |
| 3.3 |
| 3.2 |
| 4 |
| 3.2 |
| T_Bilirubin |
| 0.7 |
| 10.9 |
| 1.1 |
| 0.7 |
| D |
| 0 |
| 0 |
| 1 |
| 1 |
\( \hat{y} = \hat{f}(x_1, x_2, .... ,x_{10}) \)
\( \hat{D} = \hat{f}(Age, Albumin, .... ,T\_Bilirubin) \)
Modeling Complex Relations
Are such complex functions seen in most real world examples ?
(c) One Fourth Labs
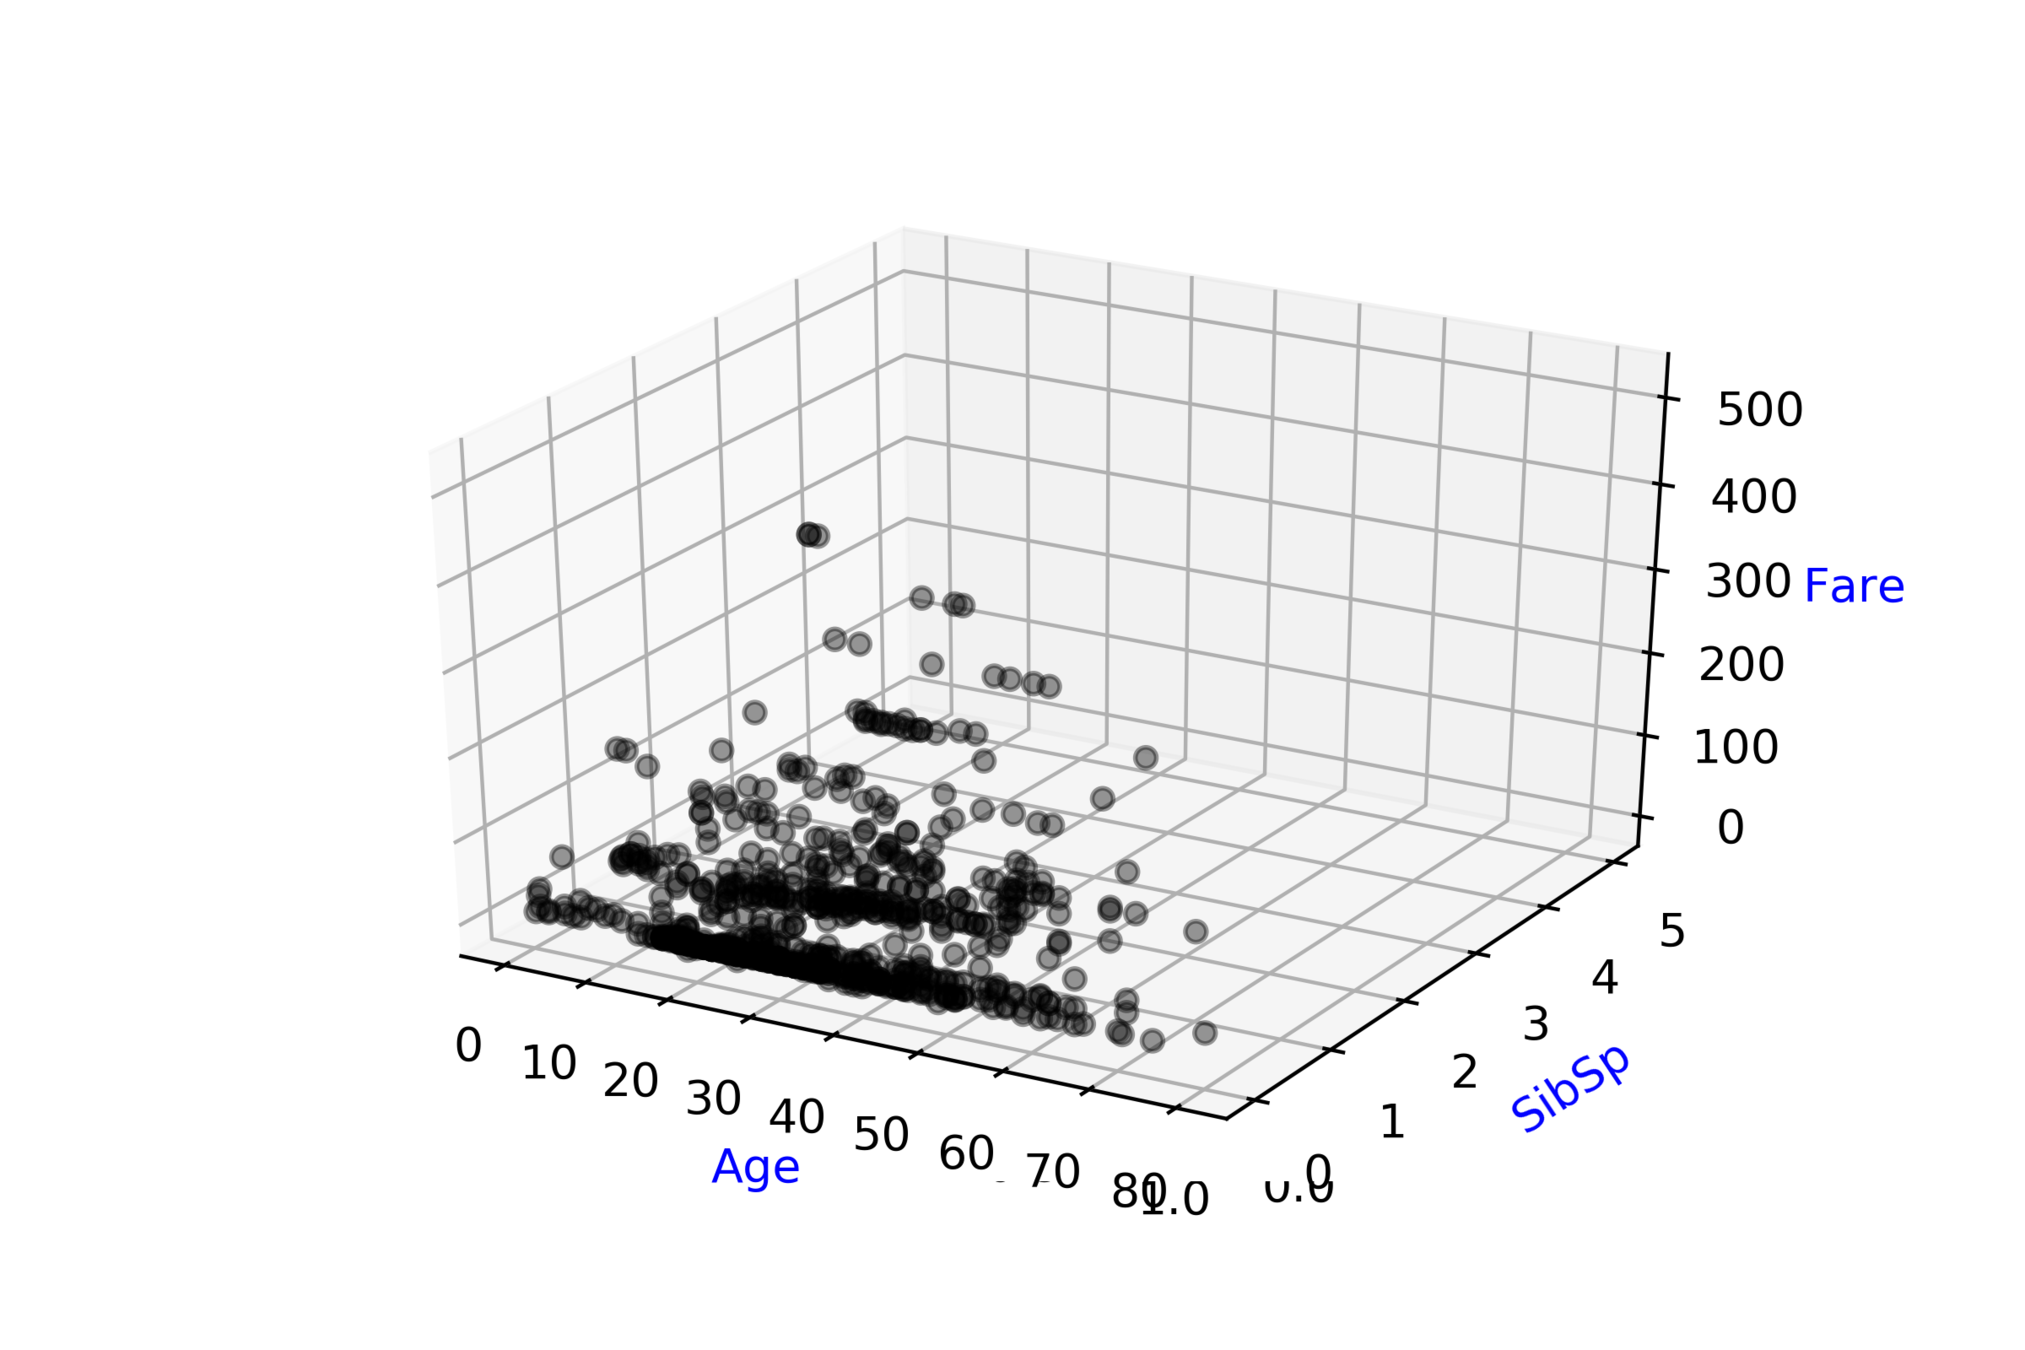
*https://www.kaggle.com/c/titanic/data
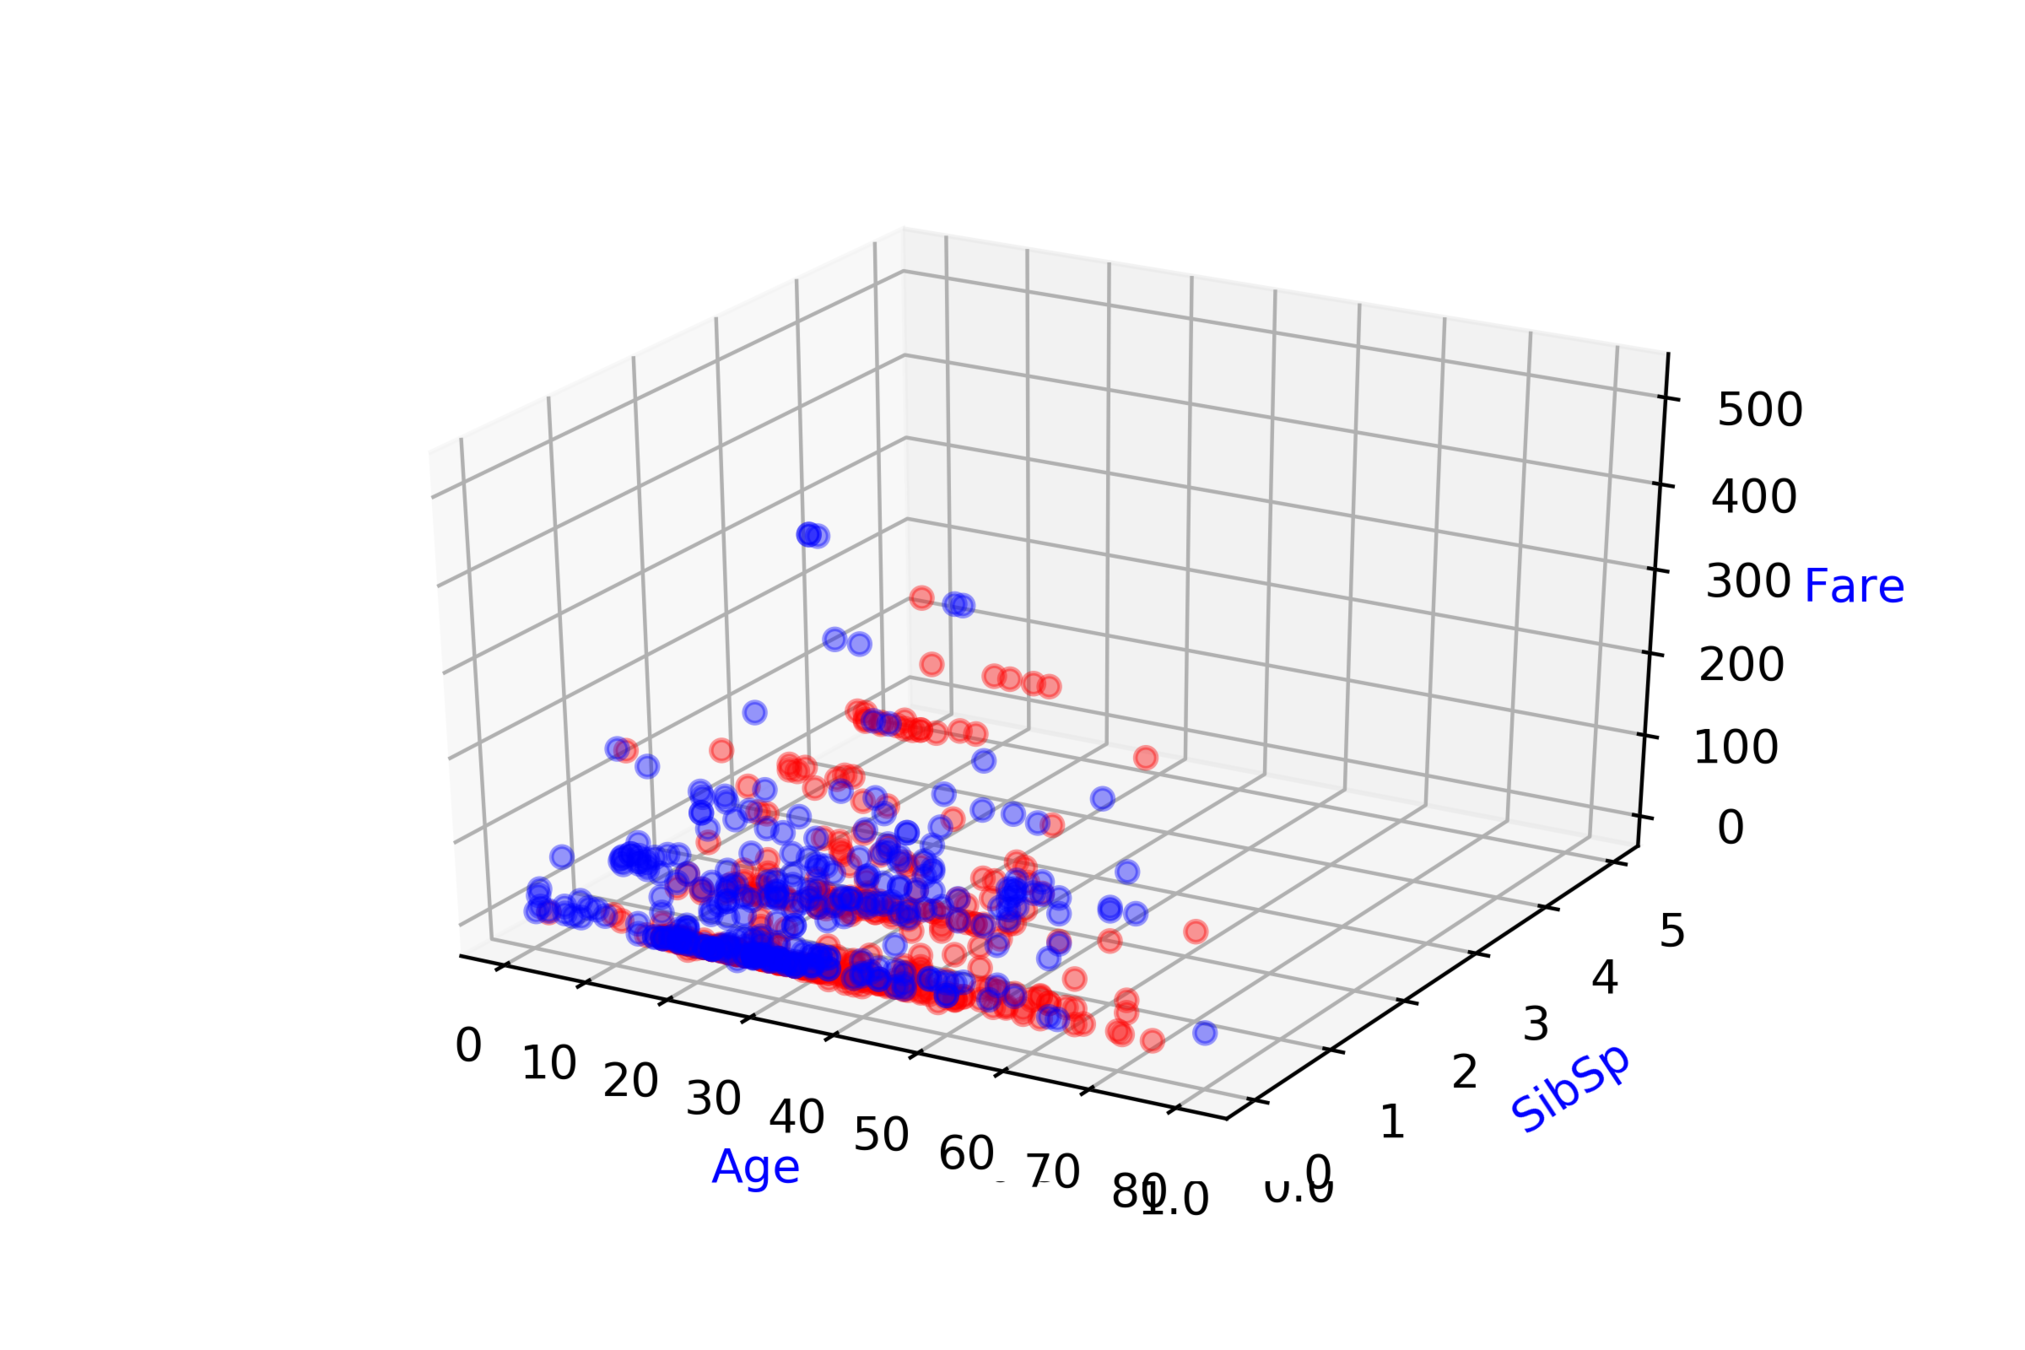
Titanic: Machine Learning from Disaster\( ^{*} \)
Predict survival on the Titanic
| Ticket class |
| 93.85 |
| -141.22 |
| -65.2 |
| 142.4 |
| # of siblings |
| 83.81 |
| -81.79 |
| -76.33 |
| 137.03 |
| Fare |
| 20.1 |
| -52.28 |
| -76.23 |
| 93.65 |
| Survived ? |
| 0 |
| 1 |
| 0 |
| 1 |
\( \hat{y} = \hat{f}(x_1, x_2, .... ,x_{9}) \)
\( \hat{D} = \hat{f}(ticket\_class, fare, .... ,age) \)
Modeling Complex Relations
How do we even come up with such complex functions ?
(c) One Fourth Labs
Class 1
Class 1
Class 1
Class 2
Class 2
Class 2
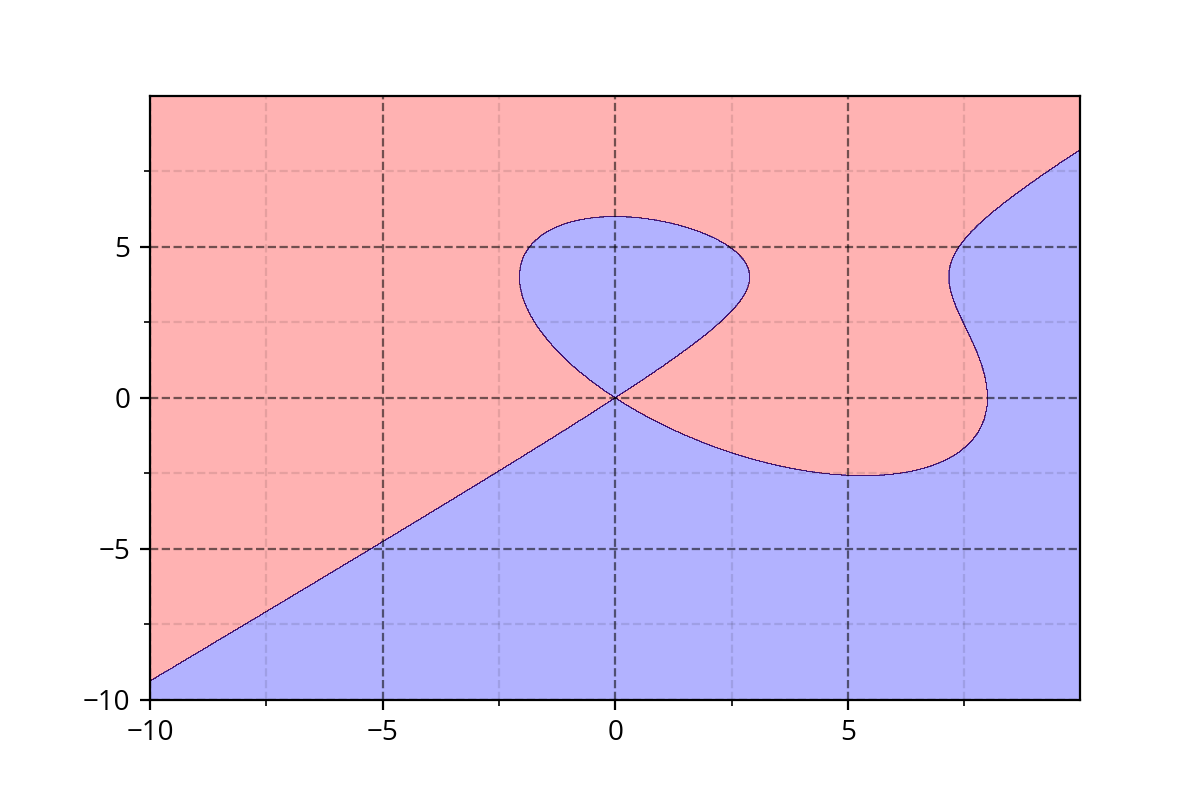
Class 1 : \( y^2 - x^2 + x^3/8 - y^3/6 > 0 \)
Class 2 : \( y^2 - x^2 + x^3/8 - y^3/6 \leq 0 \)
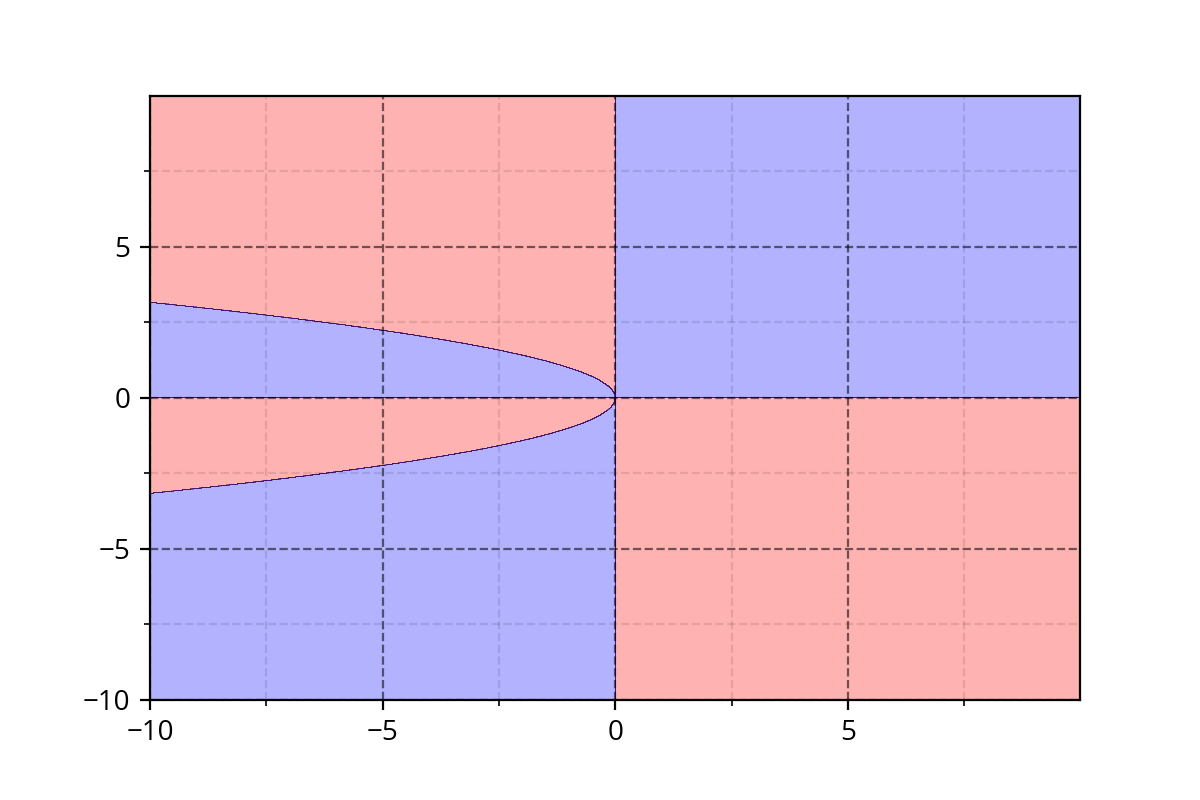
Class 1 : \( x^2*y + y^3*x > 0 \)
Class 2 : \( x^2*y + y^3*x \leq 0\)
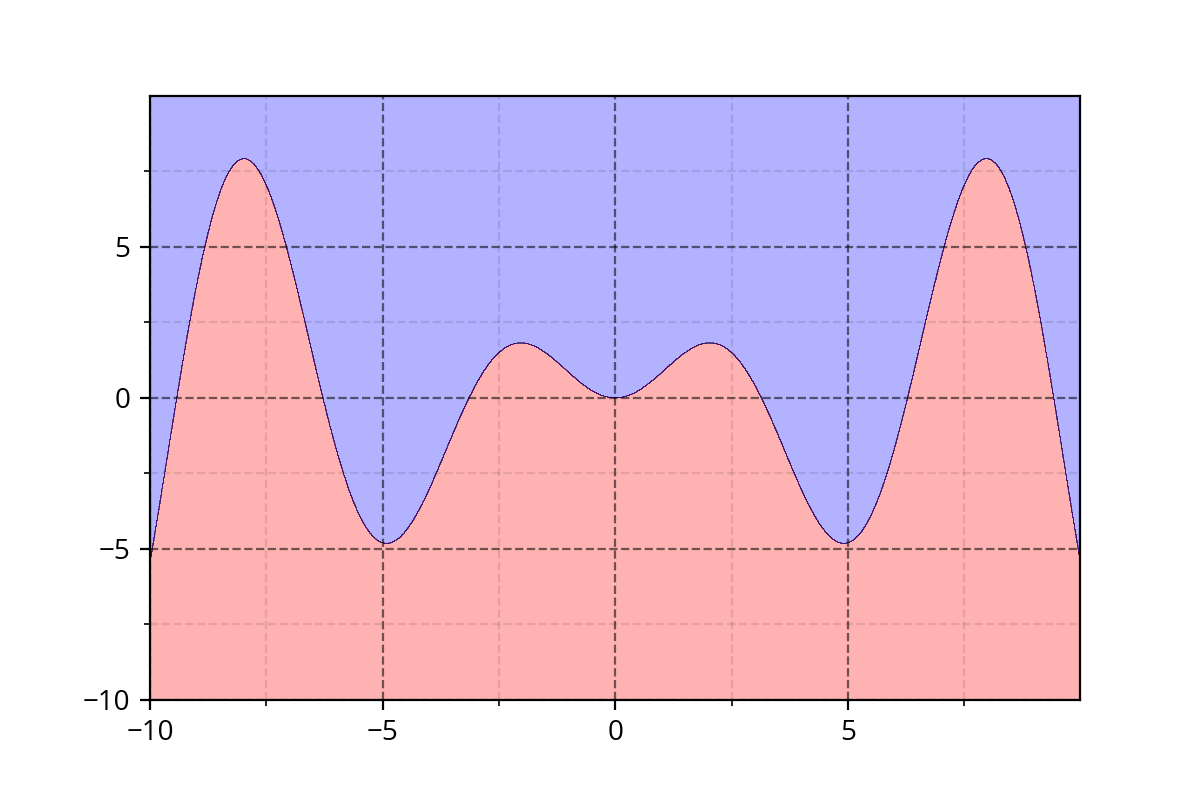
Class 1: \( y - x*sin(x) > 0 \)
Class 2 : \( y - x*sin(x) \leq 0 \)
It's hard to come up with such functions. We need a simple approach!


Modeling Complex Relations
How do we even come up with such complex functions ?
(c) One Fourth Labs
Class 1
Class 1
Class 1
Class 2
Class 2
Class 2


Modeling Complex Relations
How do we even come up with such complex functions ?
Class 1
Class 2
\( f(x_1,..,x_n) = \frac{1}{1+e^{-(w_1*x_1 + ... + w_n*x_n + b)}} \)
\( f(\bold{x},\bold{w}) = \frac{1}{1+e^{-(w*x + b)}} \)
\(w_1\)
\(w_n\)
\(x_n\)
\(x_1\)
\( f(\bold{x},\bold{w}) \)
\(x_1\)
\(x_n\)
\(\bold{h}\)
Modeling Complex Relations
How do we even come up with such complex functions ?
Class 1
Class 1
Class 1
Class 2
Class 2
Class 2
\( f(x_1,..,x_n) = \frac{1}{1+e^{-(w_1*x_1 + ... + w_n*x_n + b)}} \equiv \)
\( f(\bold{x},\bold{w}) = \frac{1}{1+e^{-(w*x + b)}} \equiv \)
(c) One Fourth Labs
Modeling Complex Relations
The construction analogy
(c) One Fourth Labs
1. Show the same plots as in the previous slide
2. Now replace the plots by buildings, a small house, a bungalow, a mansion
3. now at the bottom show a brick, some concrete slabs and then show how you combine bricks and/or slabs to construct buildings
Next slide:
1. Now replace the buildings by the plots again and instead of brick show the function f(x1, x2, ...xn) = sigmoid and show the figure
2. Now show the compact form of the function f(\bold_x; \boldw) = sigmoid
3. Now show multiple copies of this function with different w's (w1, w2, wk) placed side by side (ground floor) (below each of these functions show a brick)
4. now show the output of each of these would be h1, h2, ... hk... replace these by \bold h
5. now again show multiple copies of the function f (h, w) and continue (first floor)
Representation Power
Can we prove the "construction analogy" more concretely ?
(c) One Fourth Labs
Now we will have slides 44 to 59 from my course but
1) No text on the slides
2) you can make all the animations as gifs so that we have much fewer slides (the gifs should start/stop on mouse click)
3) use better colors, orientations and aesthetics
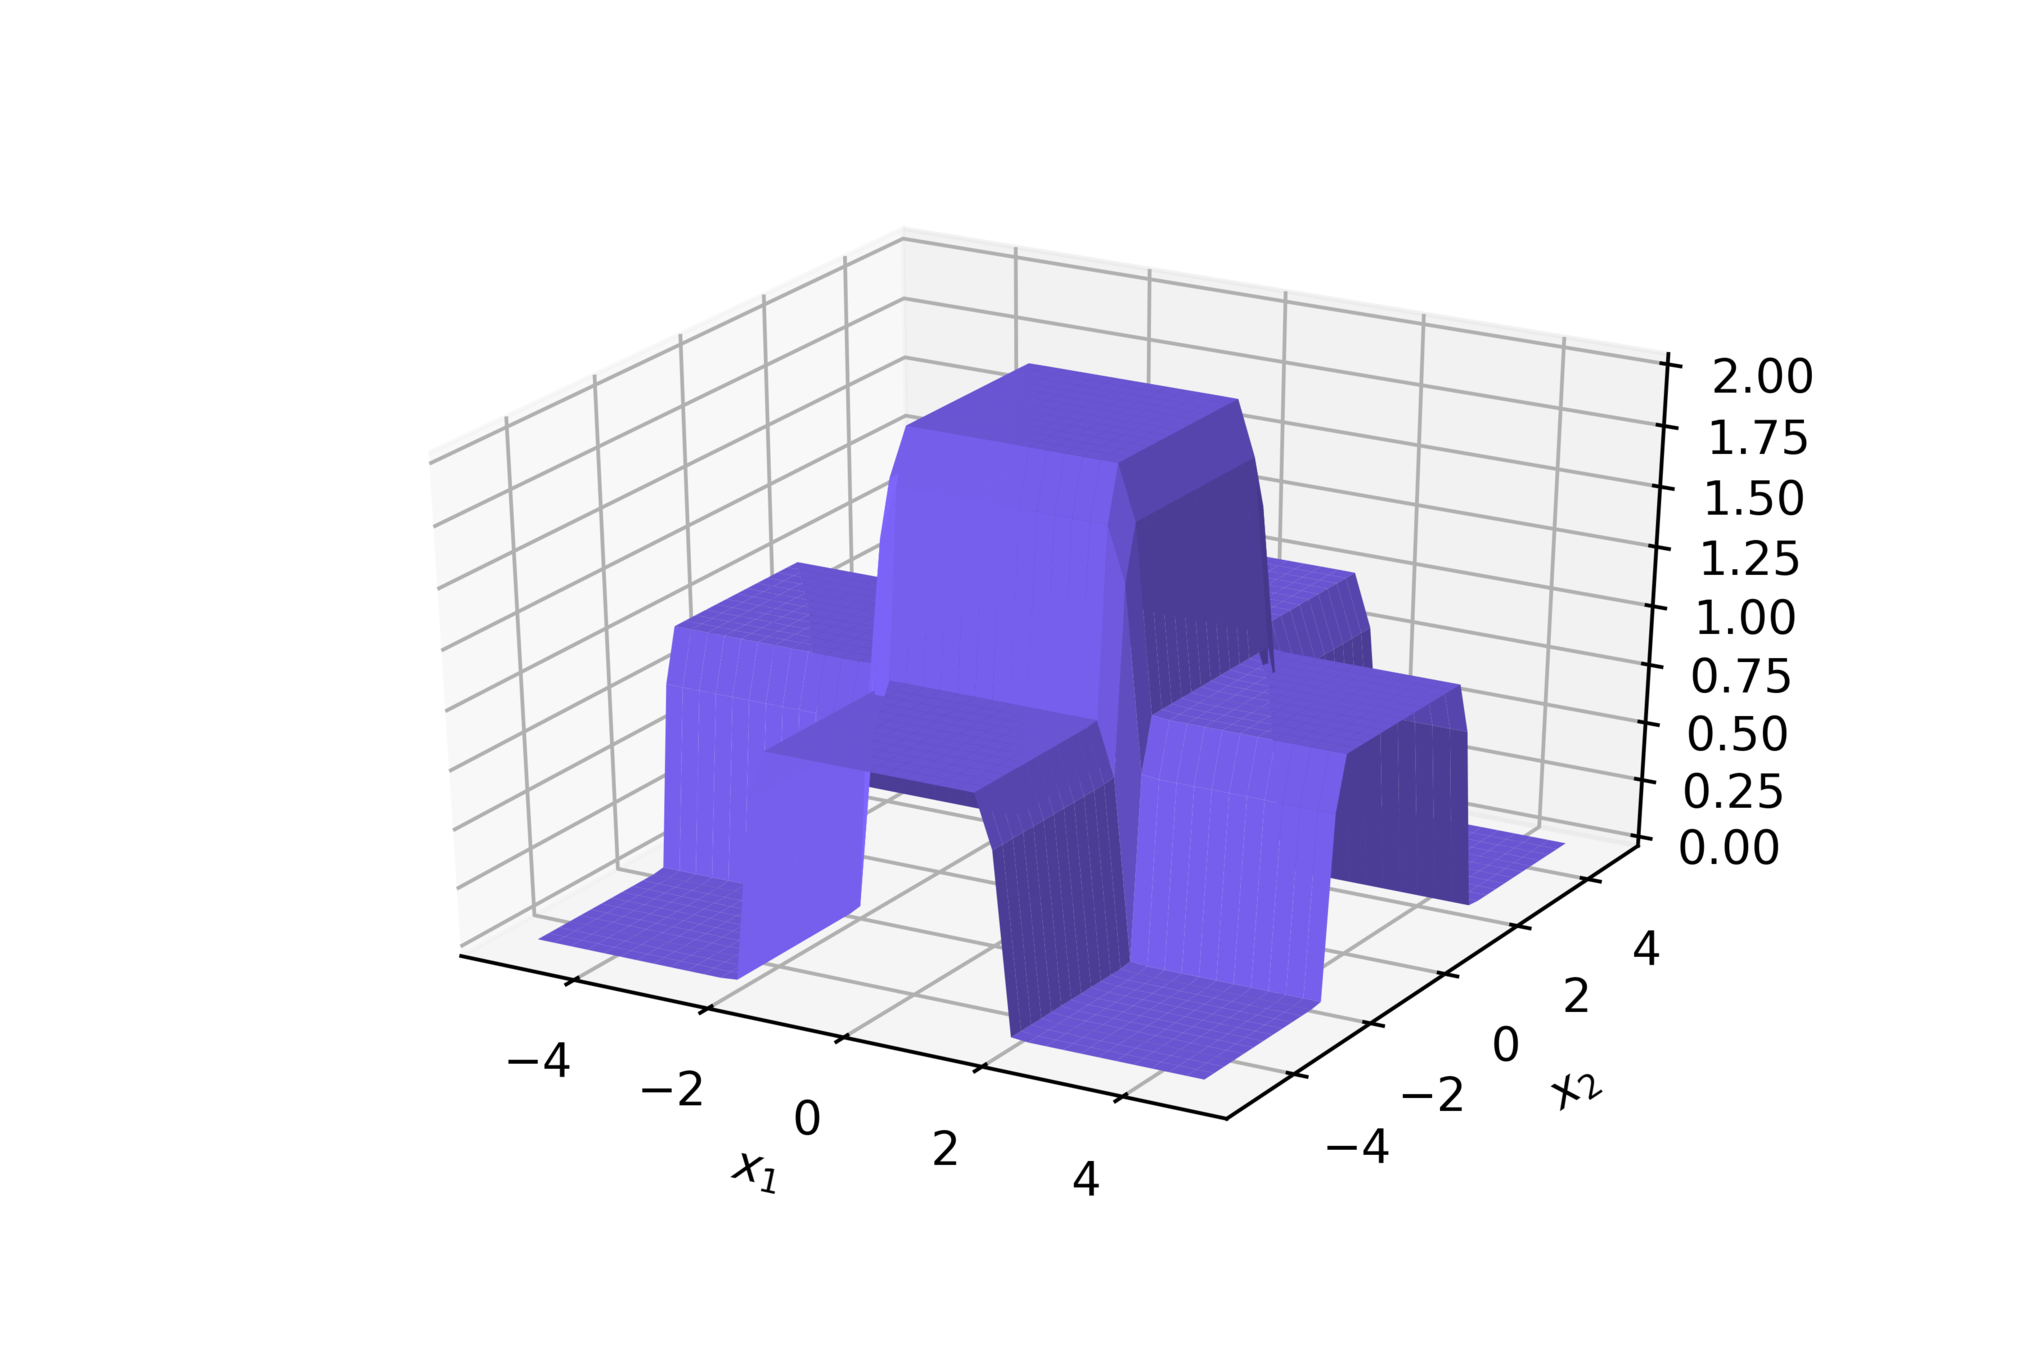
4) After slides 44 to 59 repeat the slide 3.4 and show tower functions under each of these plots
(c) One Fourth Labs

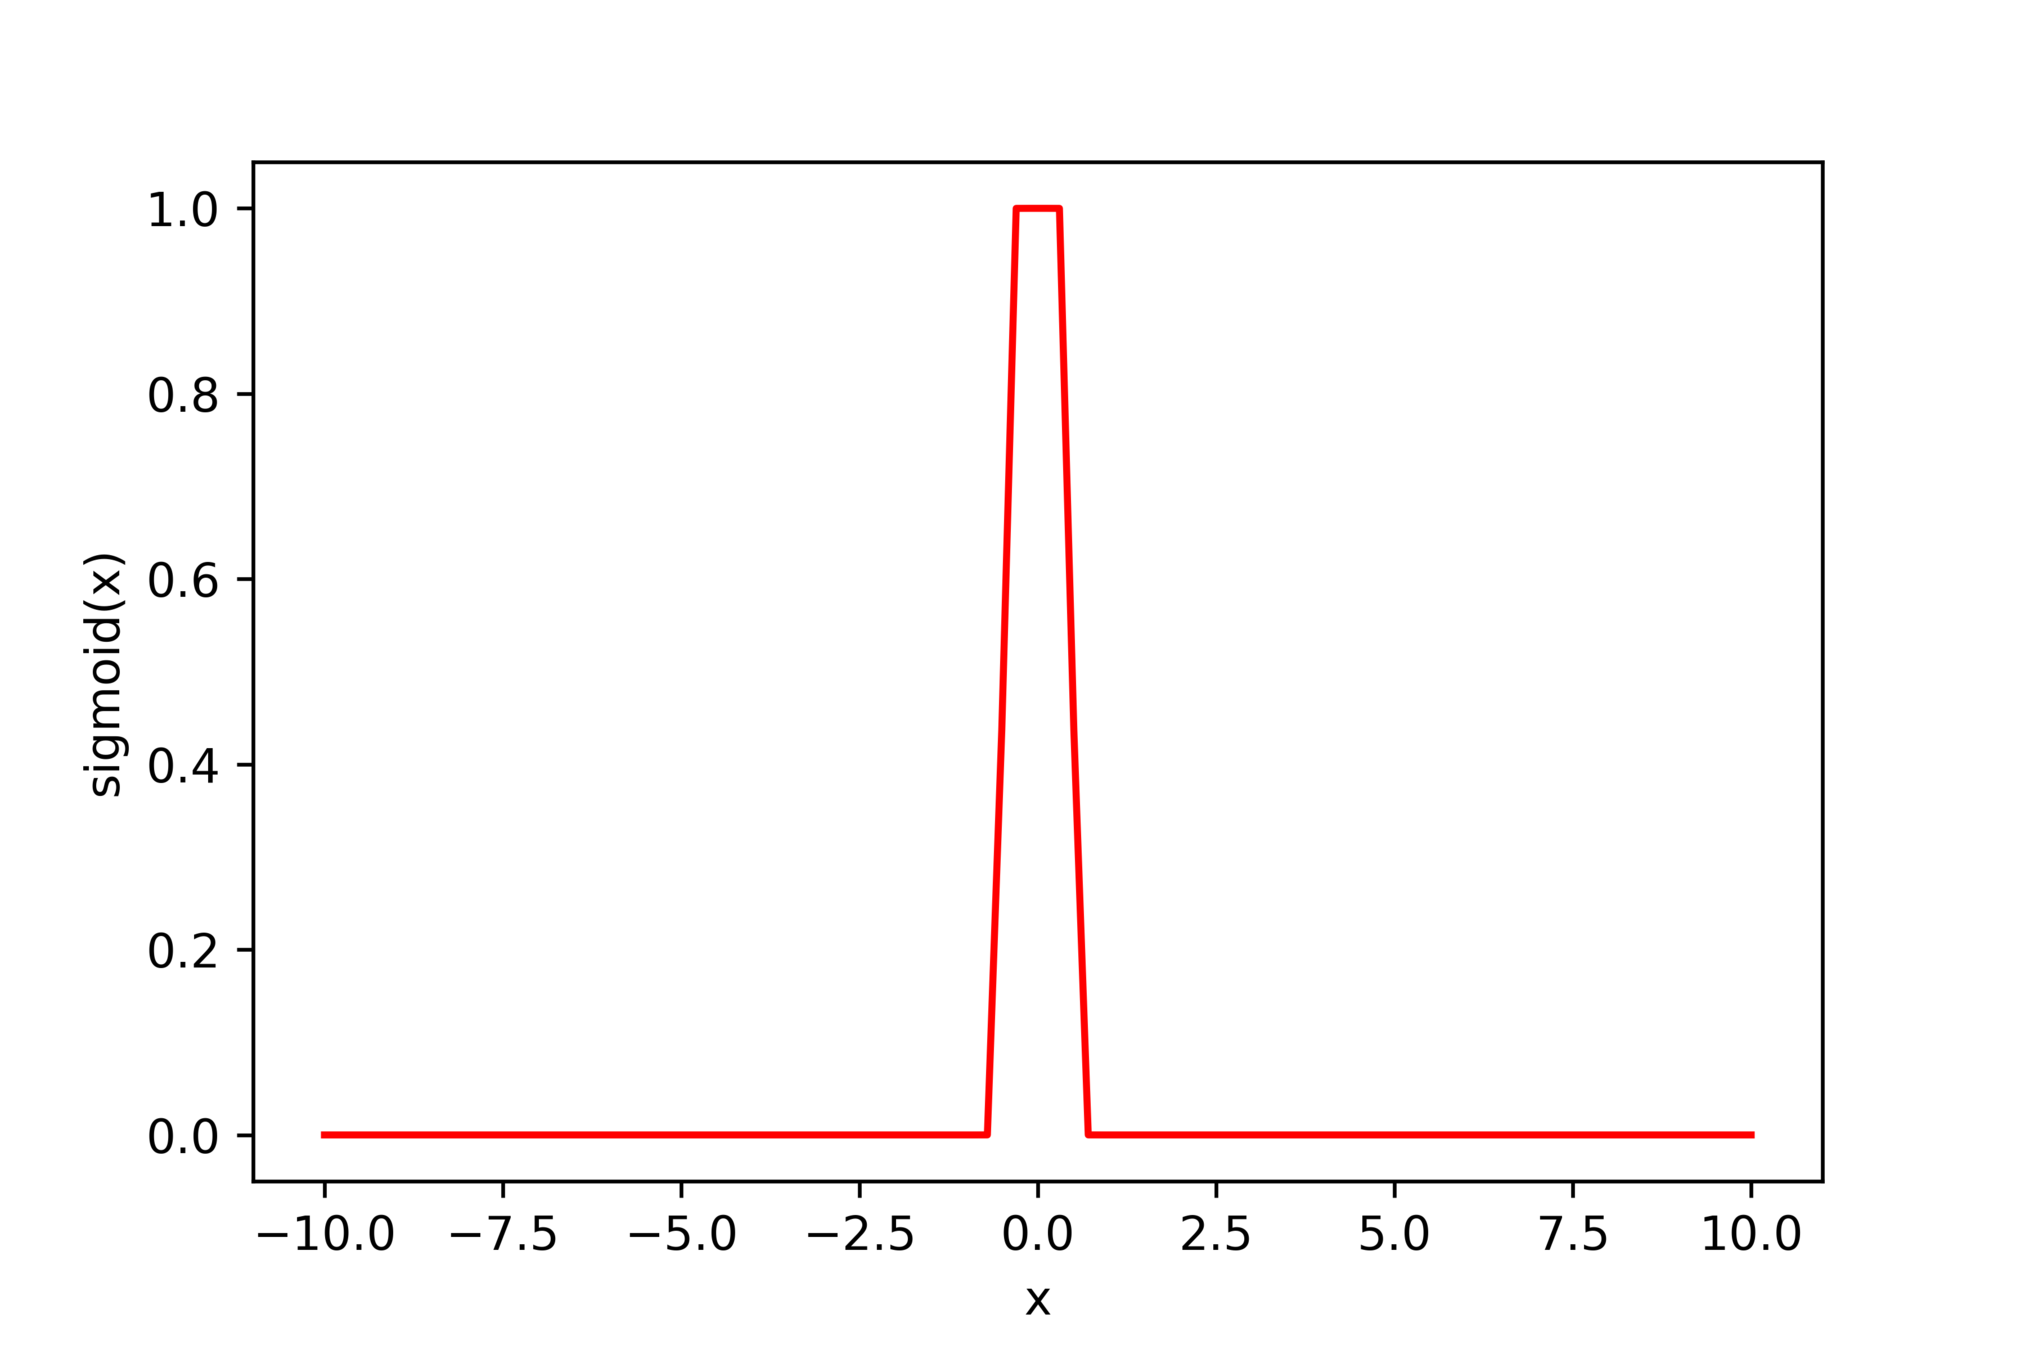
\(-\)
\(=\)

(c) One Fourth Labs
\(x\)
\(h_{12}\)
\(h_{11}\)
\(h_{21}\)
\(w_1, b_1 \)
\(+1\)
\(-1\)
\(w_2, b_2\)


(c) One Fourth Labs


(c) One Fourth Labs


(c) One Fourth Labs
(c) One Fourth Labs
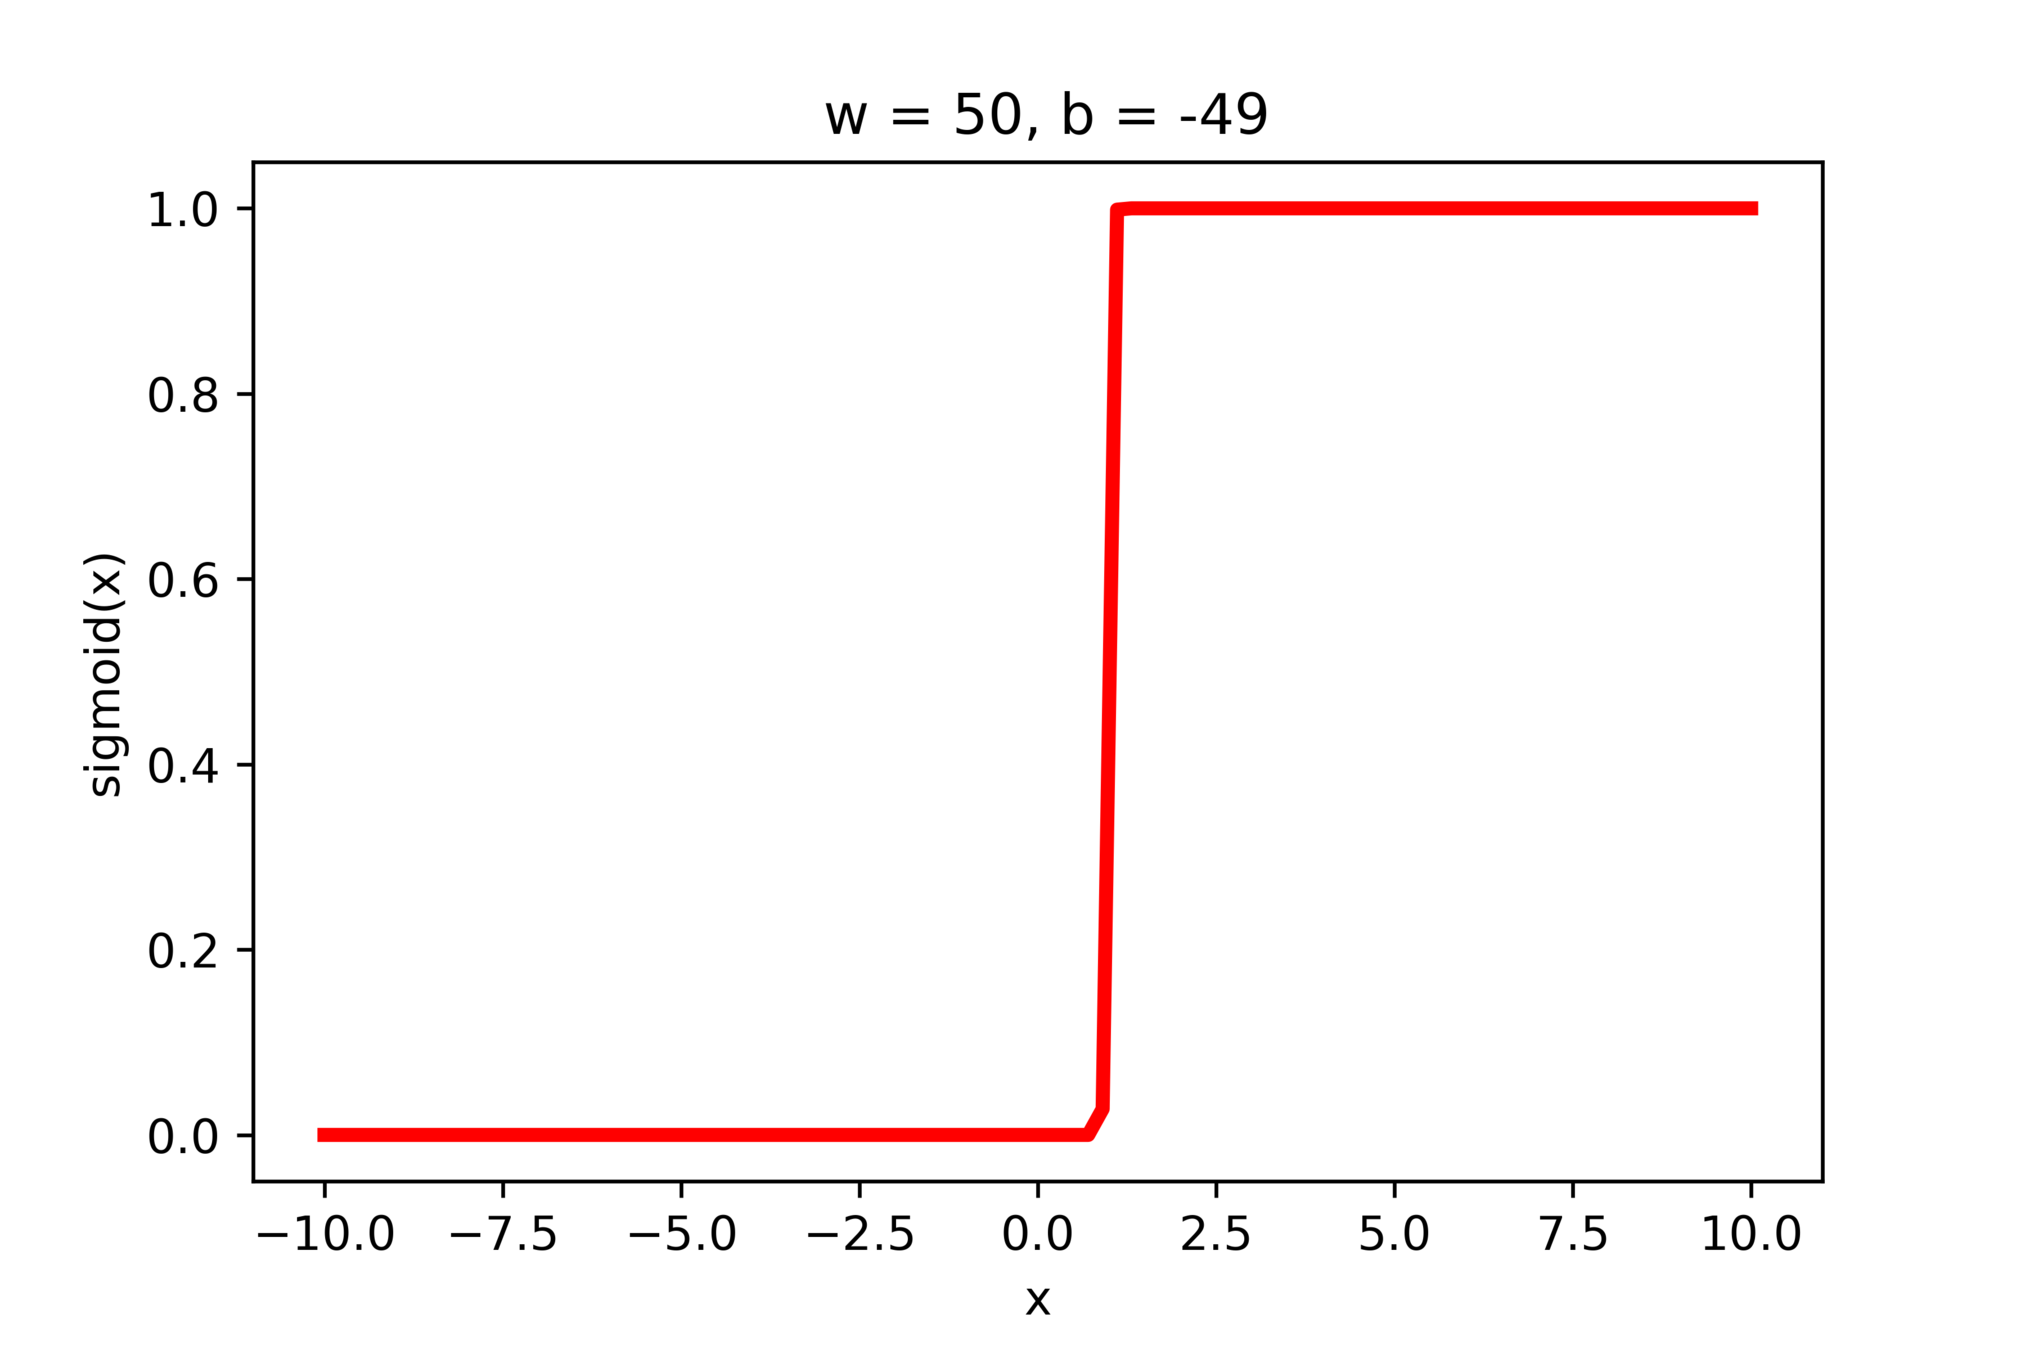
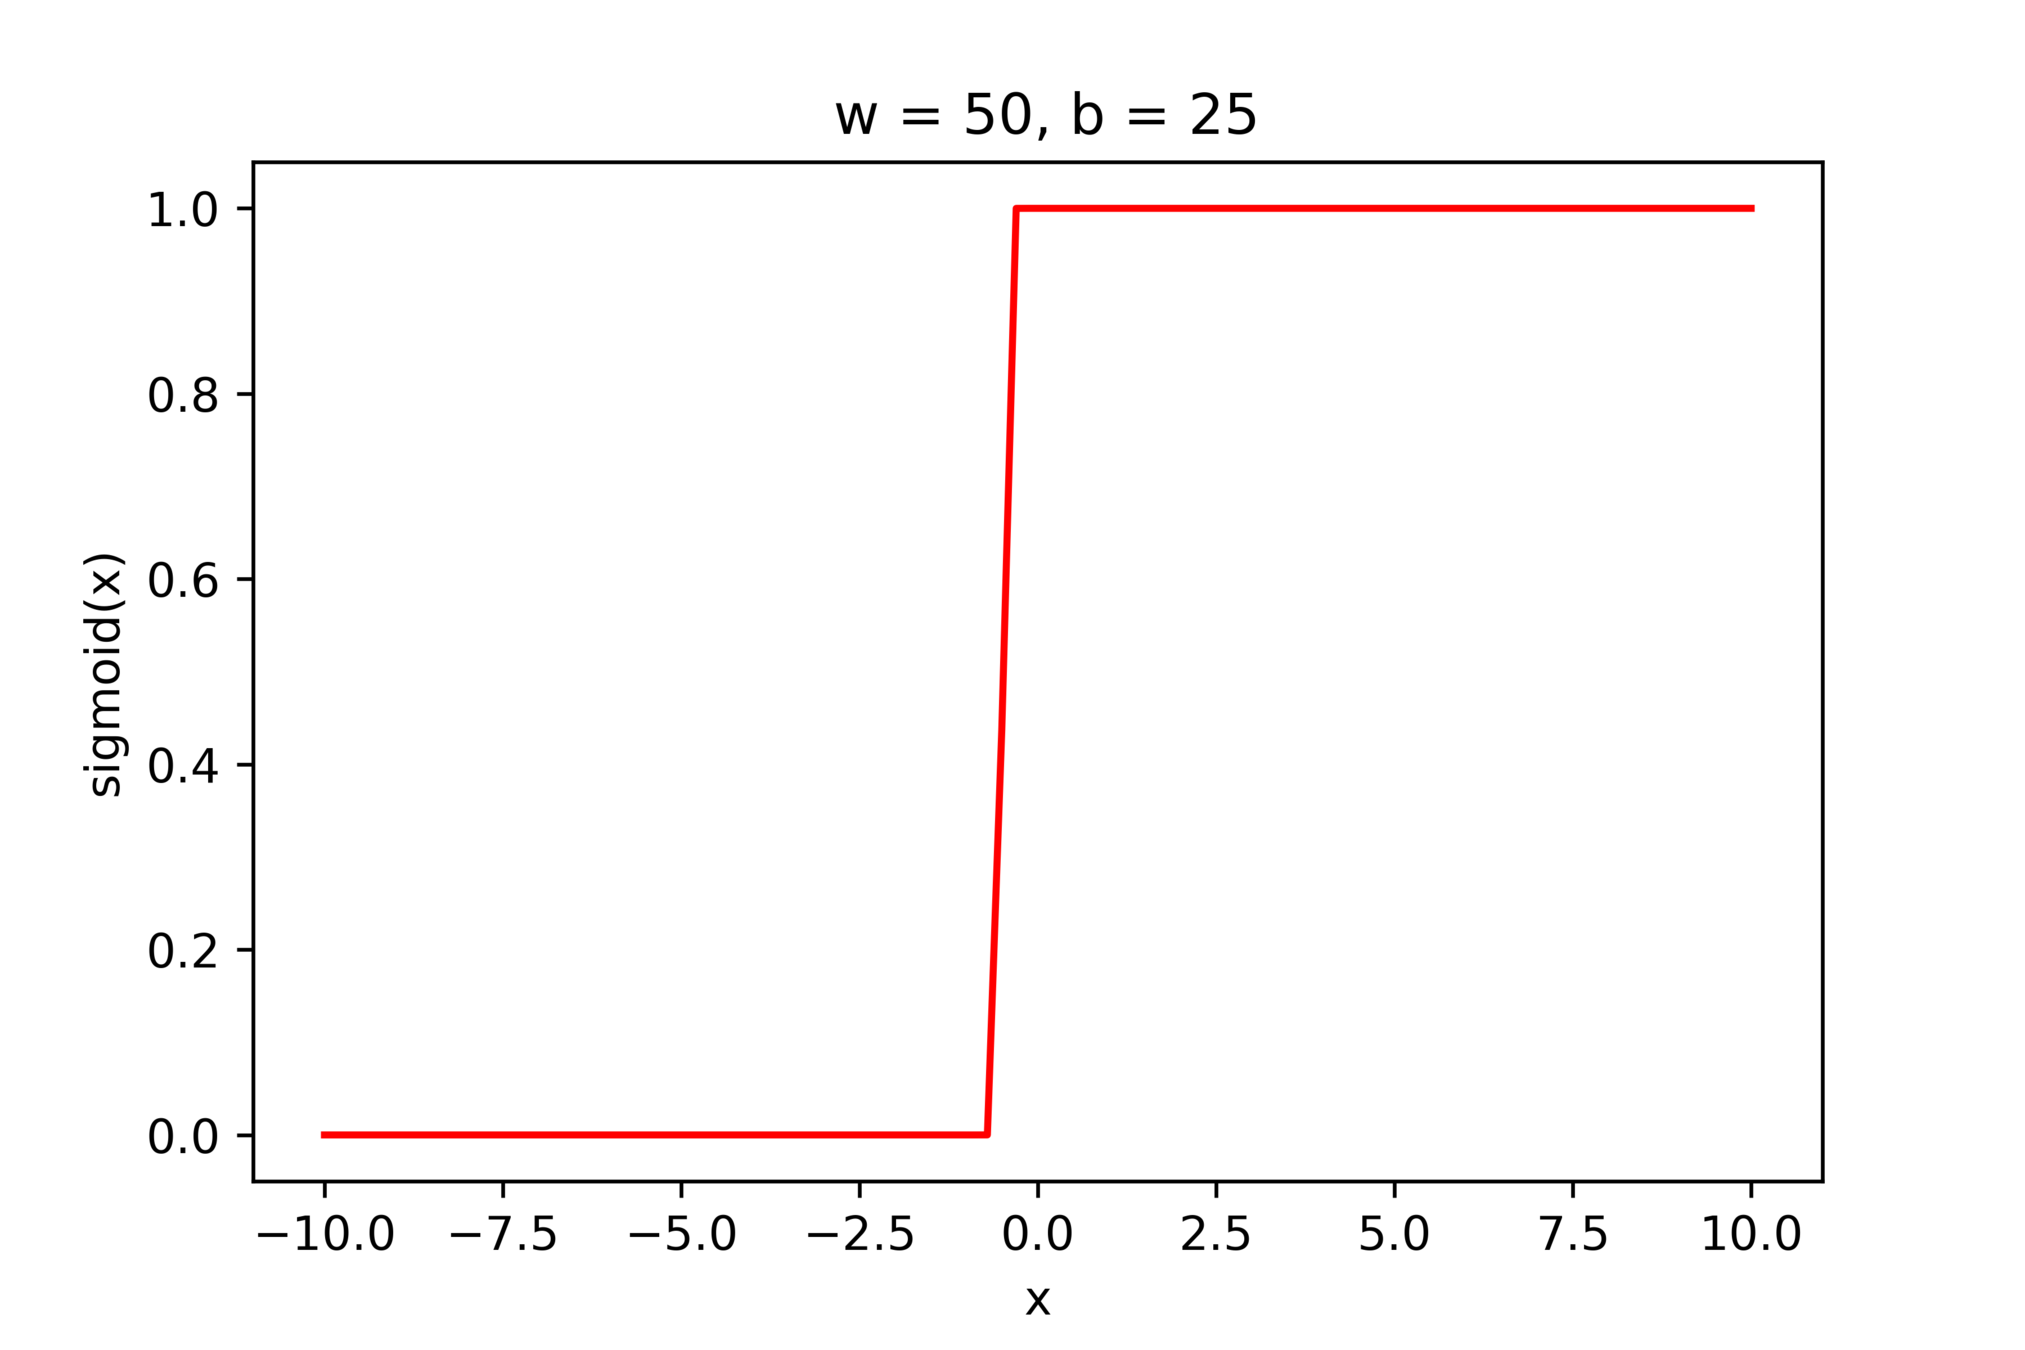
\(w = 50, b=-100\)
(c) One Fourth Labs
\(x_1\)
\(x_2\)
\(1\)
\(-\)
\(-\)
\(+\)
\(+1\)
\(+1\)
\(-1\)
\(+1\)
\(-1\)
\(+1\)
\(w_1 = 100, w_2=1, b=200\)
\(w_1 = 100, w_2=1, b=-200\)
\(w_1 = 1, w_2=100, b=-200\)
\(w_1 = 1, w_2=100, b=200\)
\(w = 50, b=-100\)
\(+\)


(c) One Fourth Labs
\(x_1\)
\(x_2\)
\(1\)
\(-\)
\(-\)
\(+\)
\(+1\)
\(+1\)
\(-1\)
\(+1\)
\(-1\)
\(+1\)
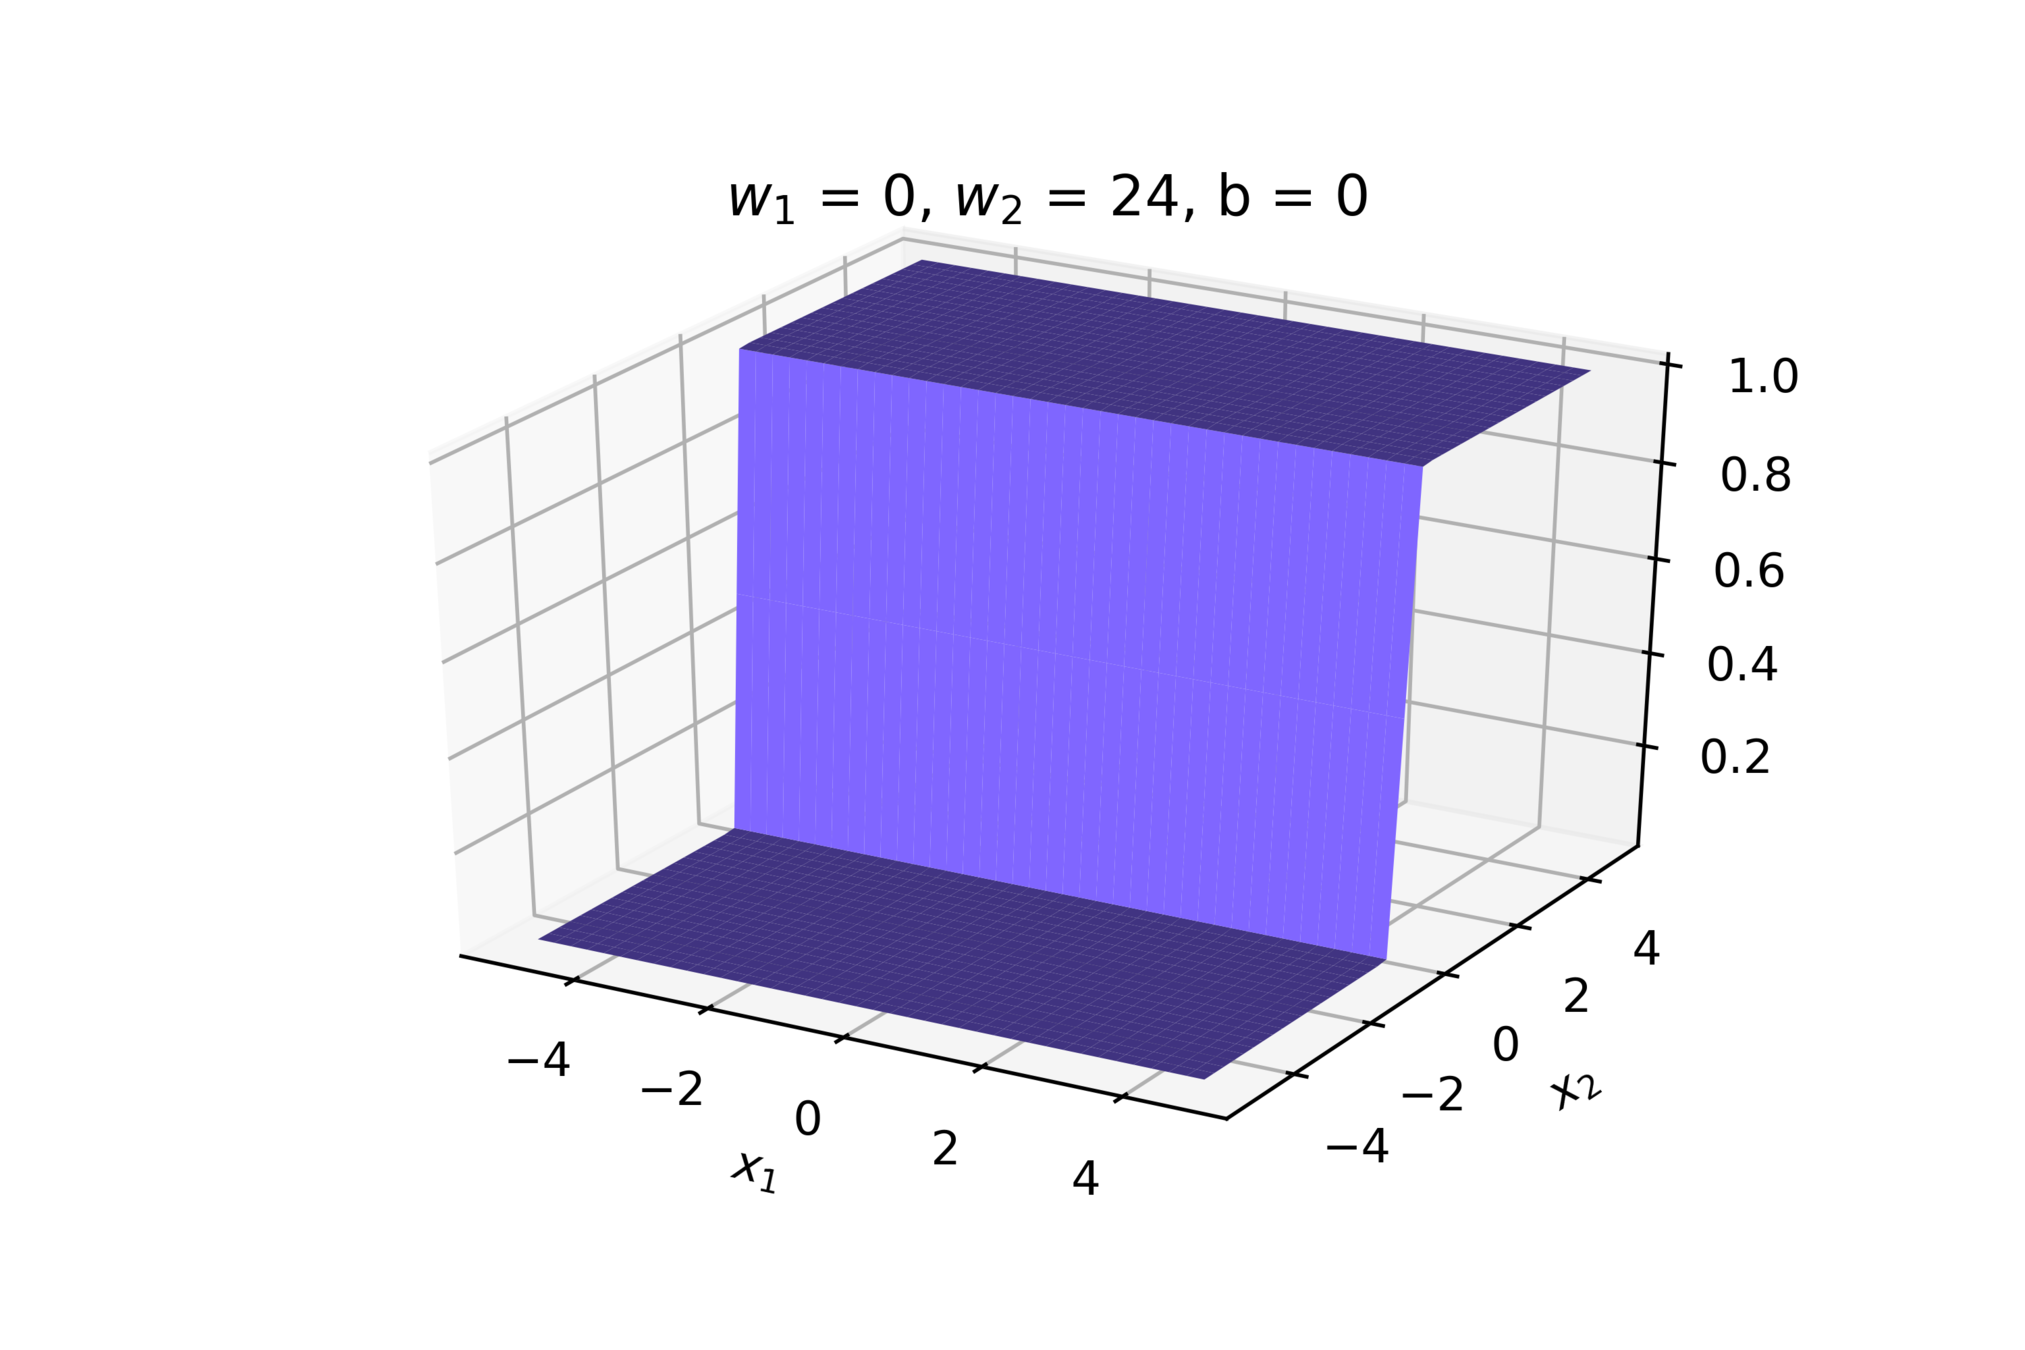
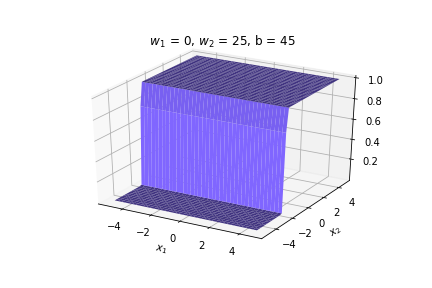
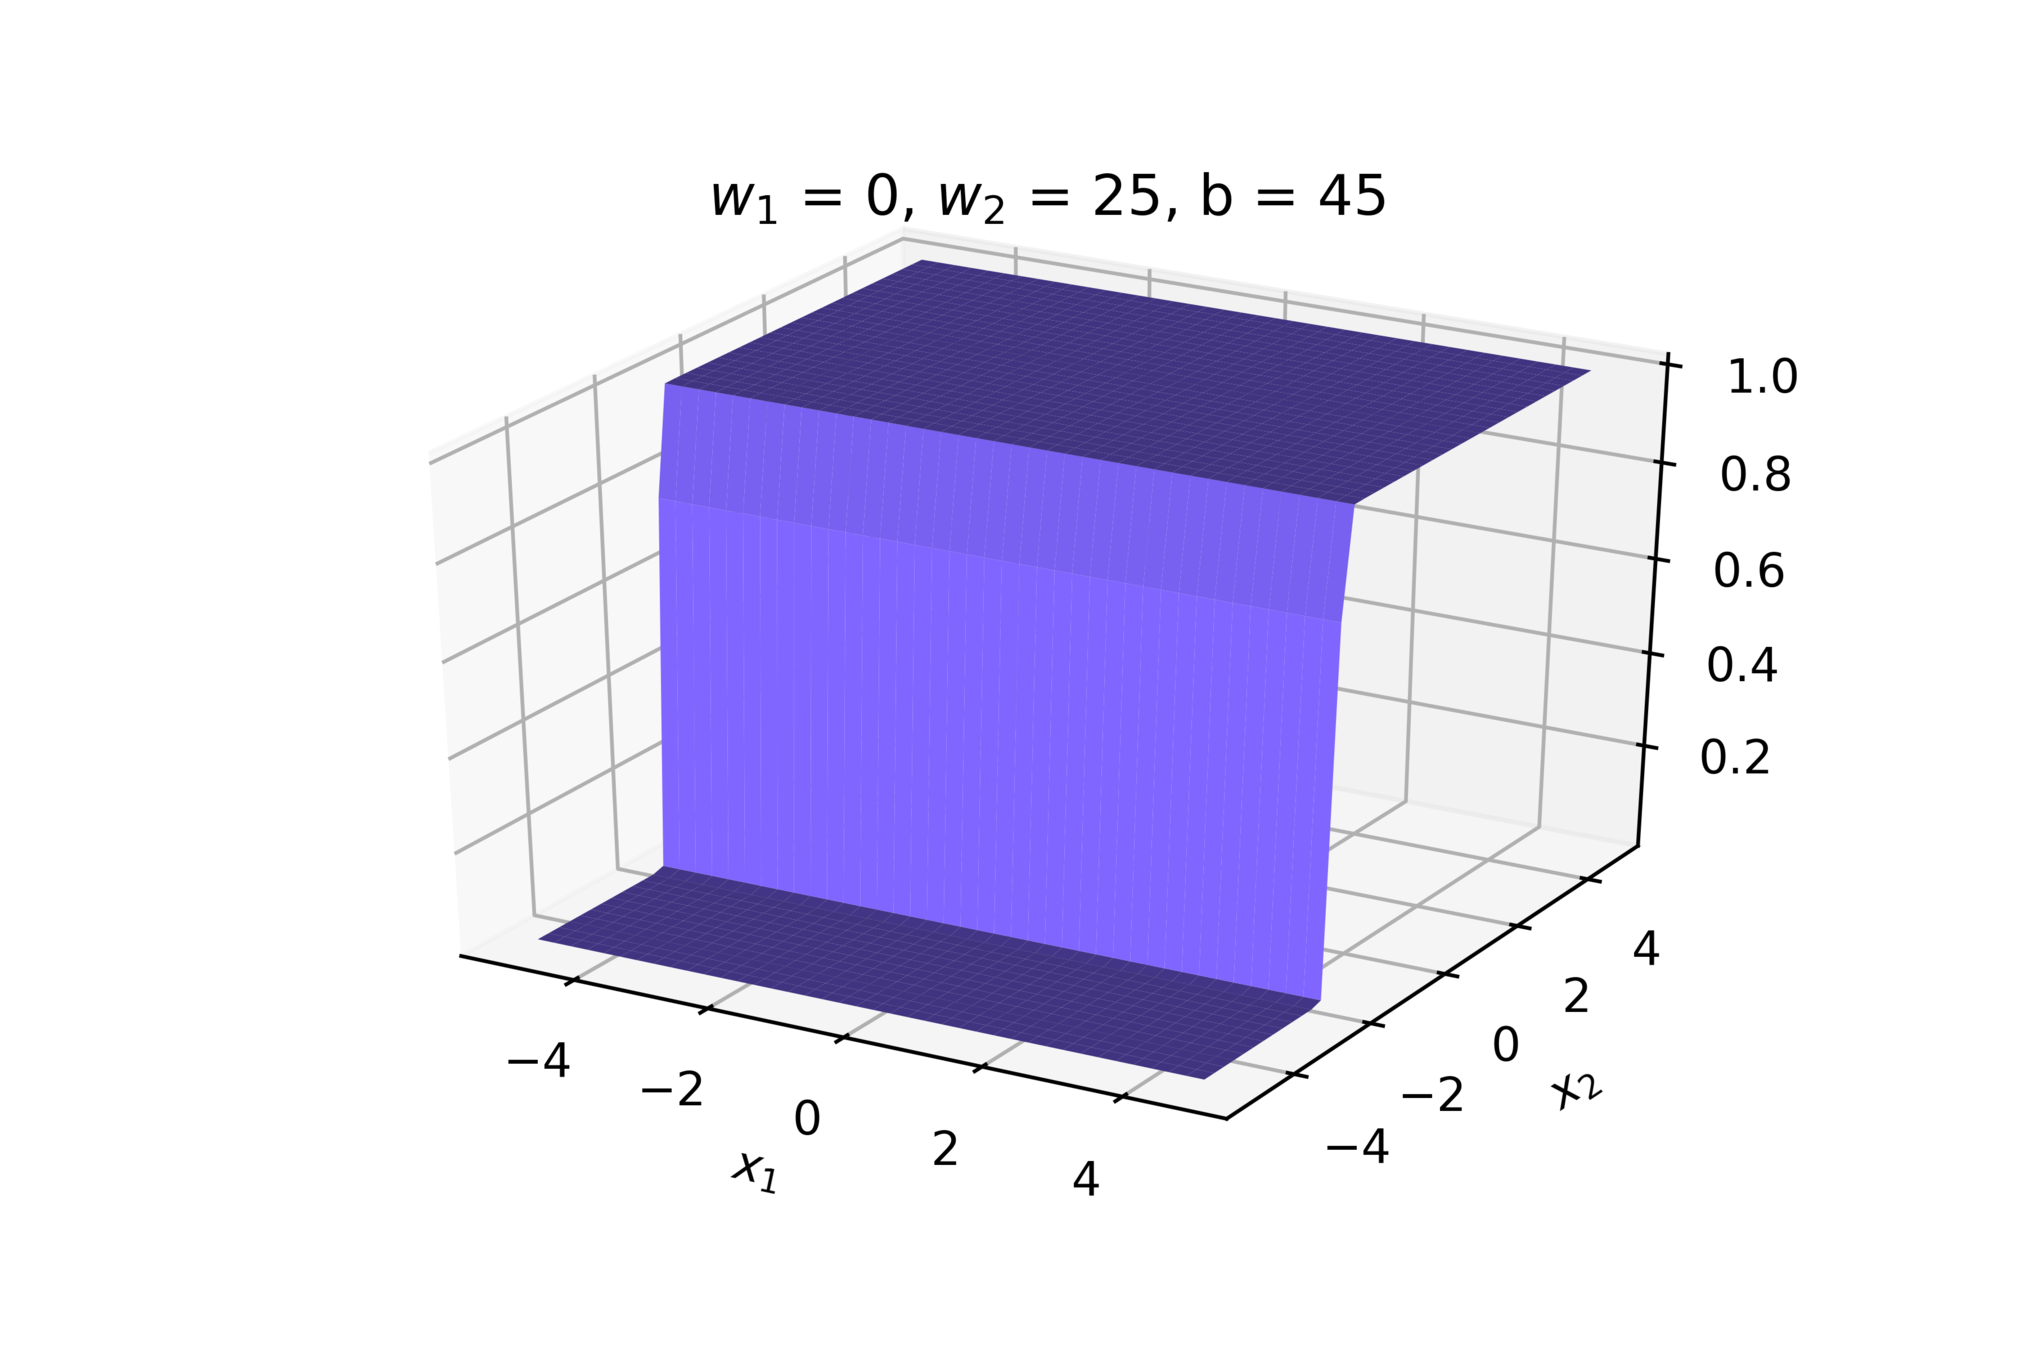
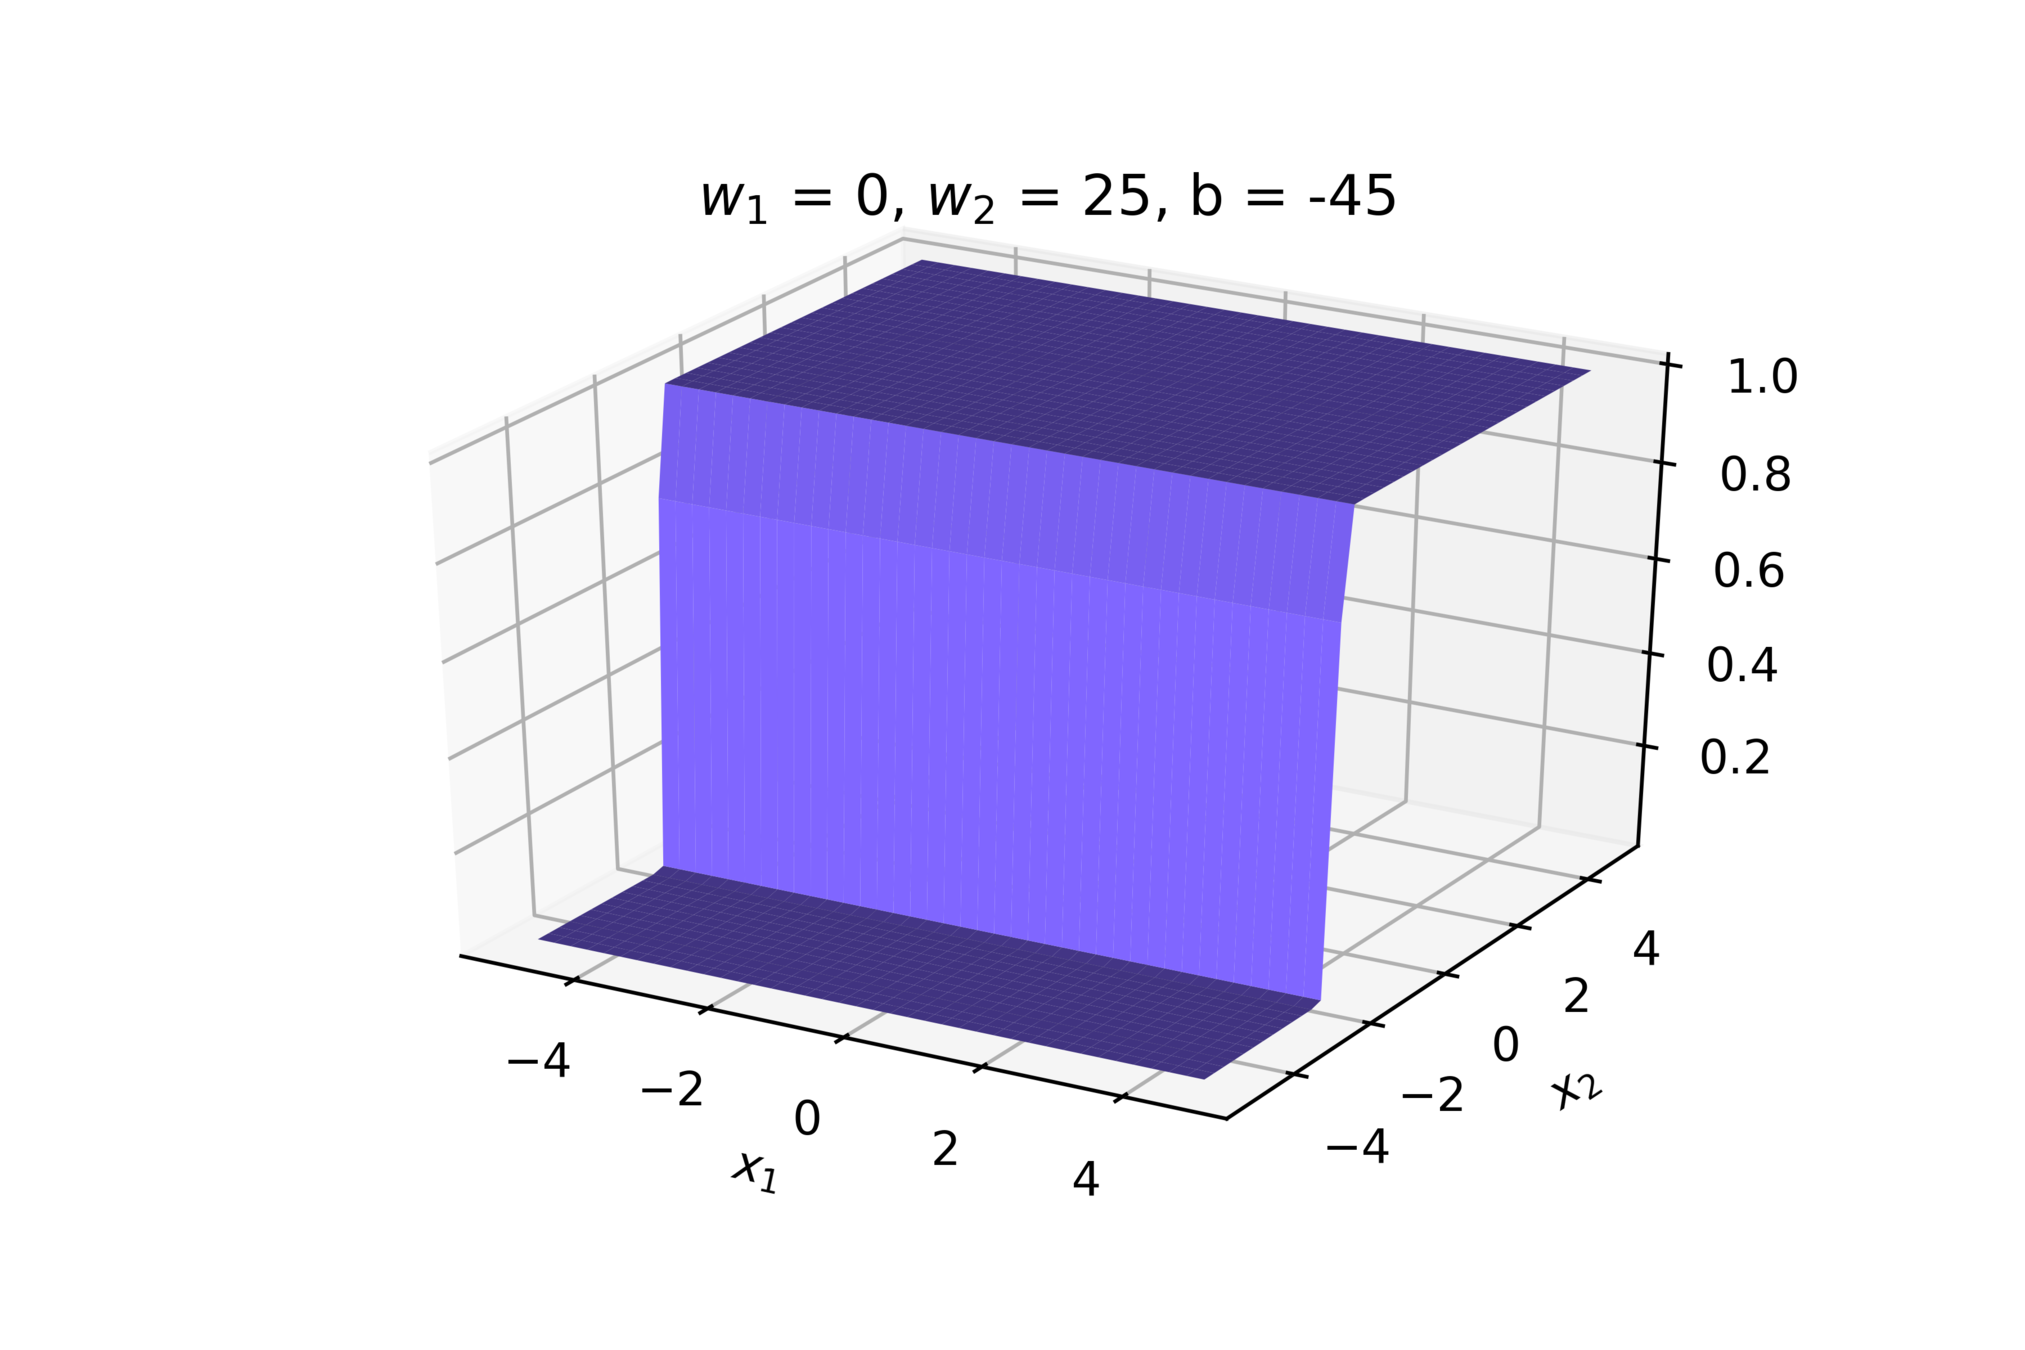
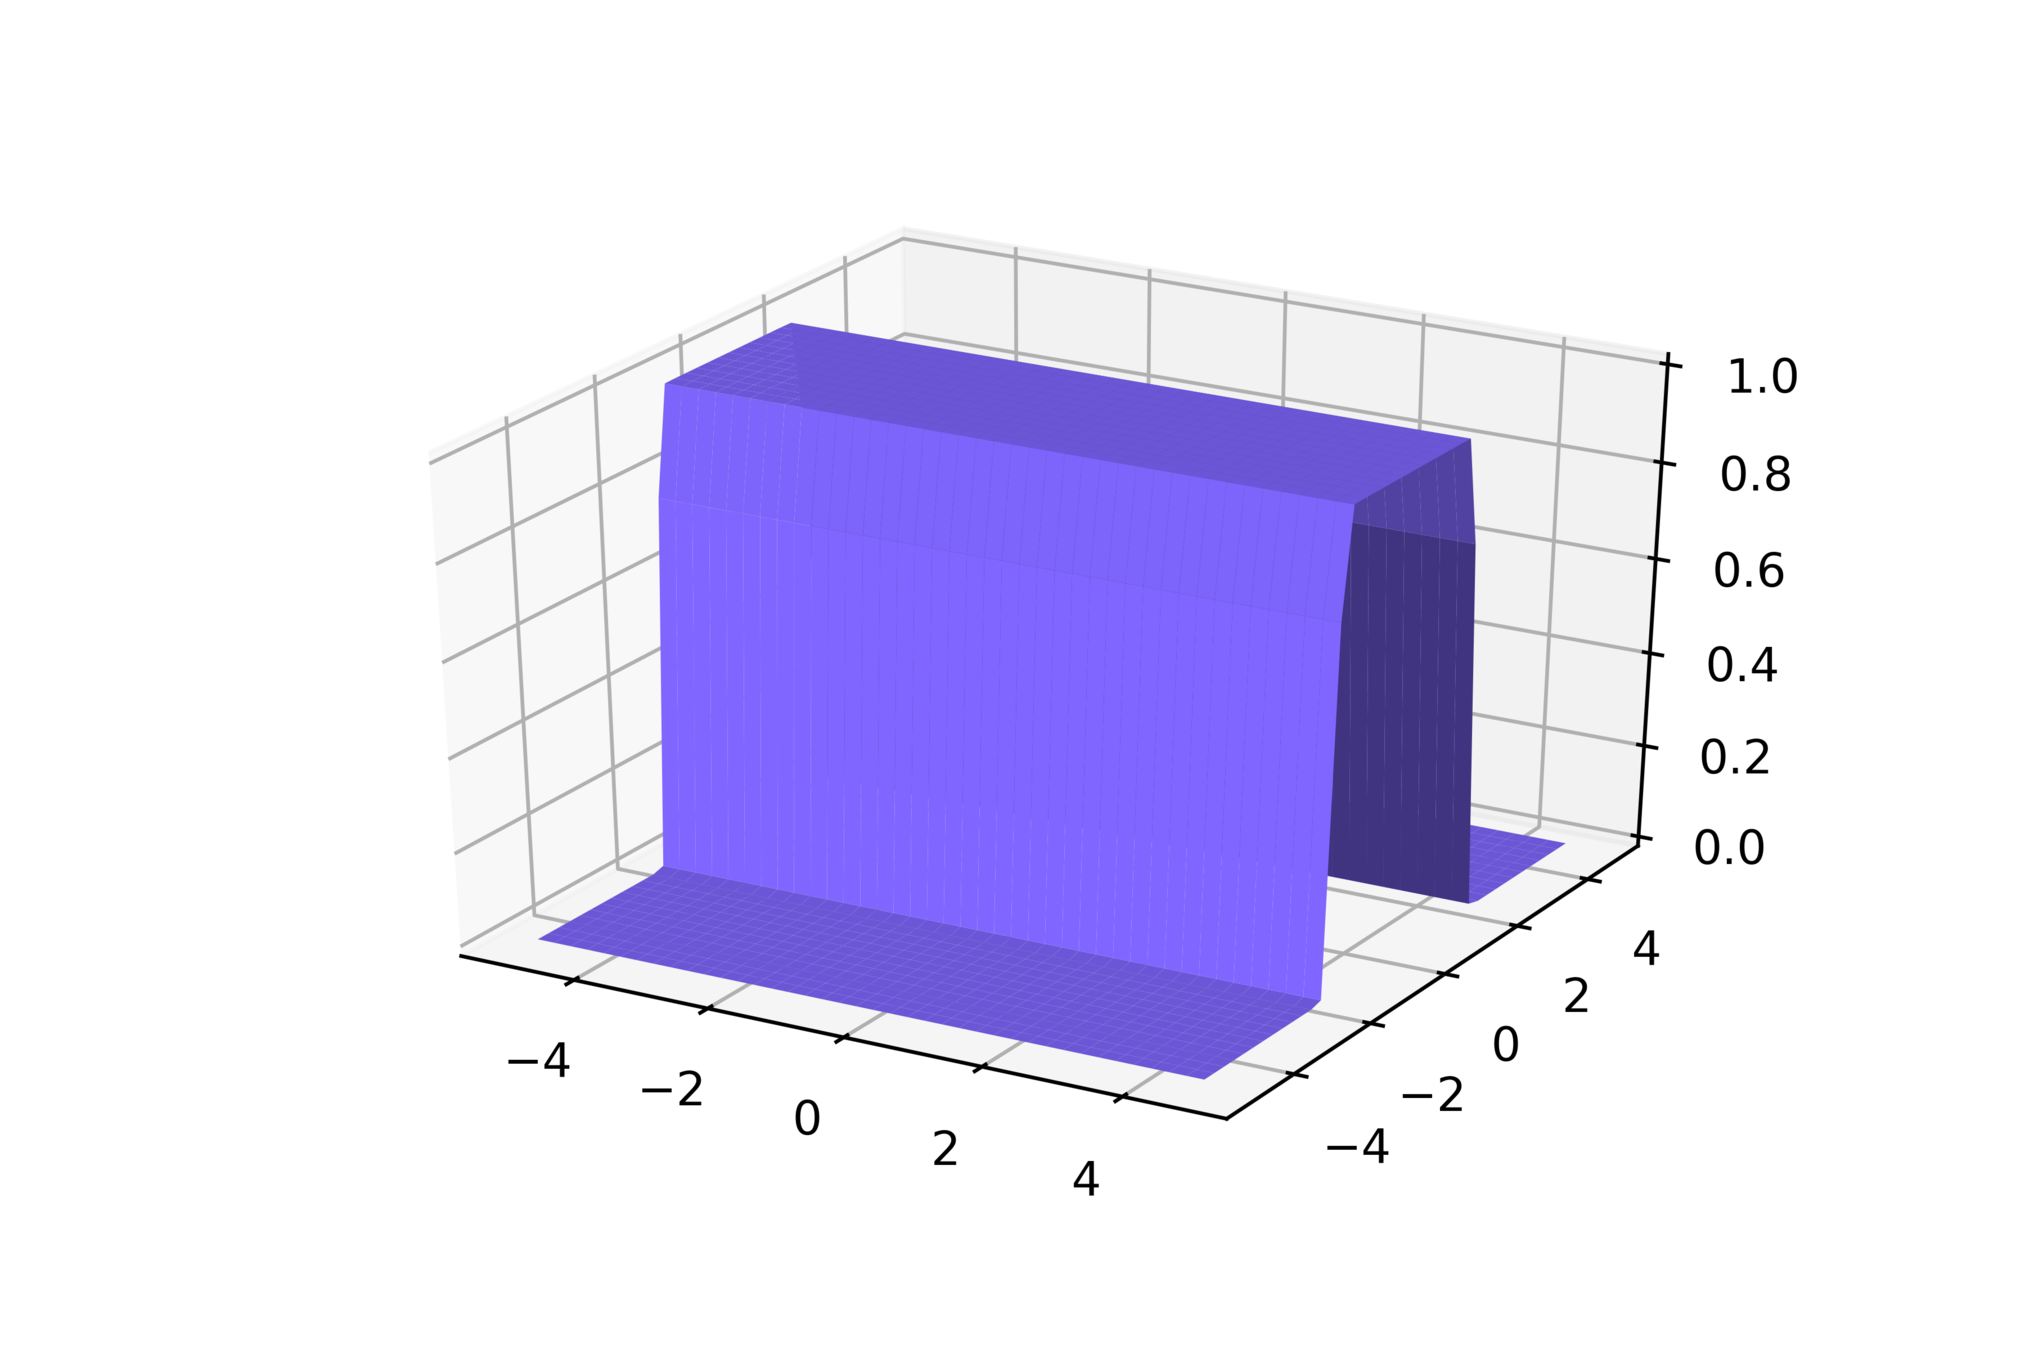
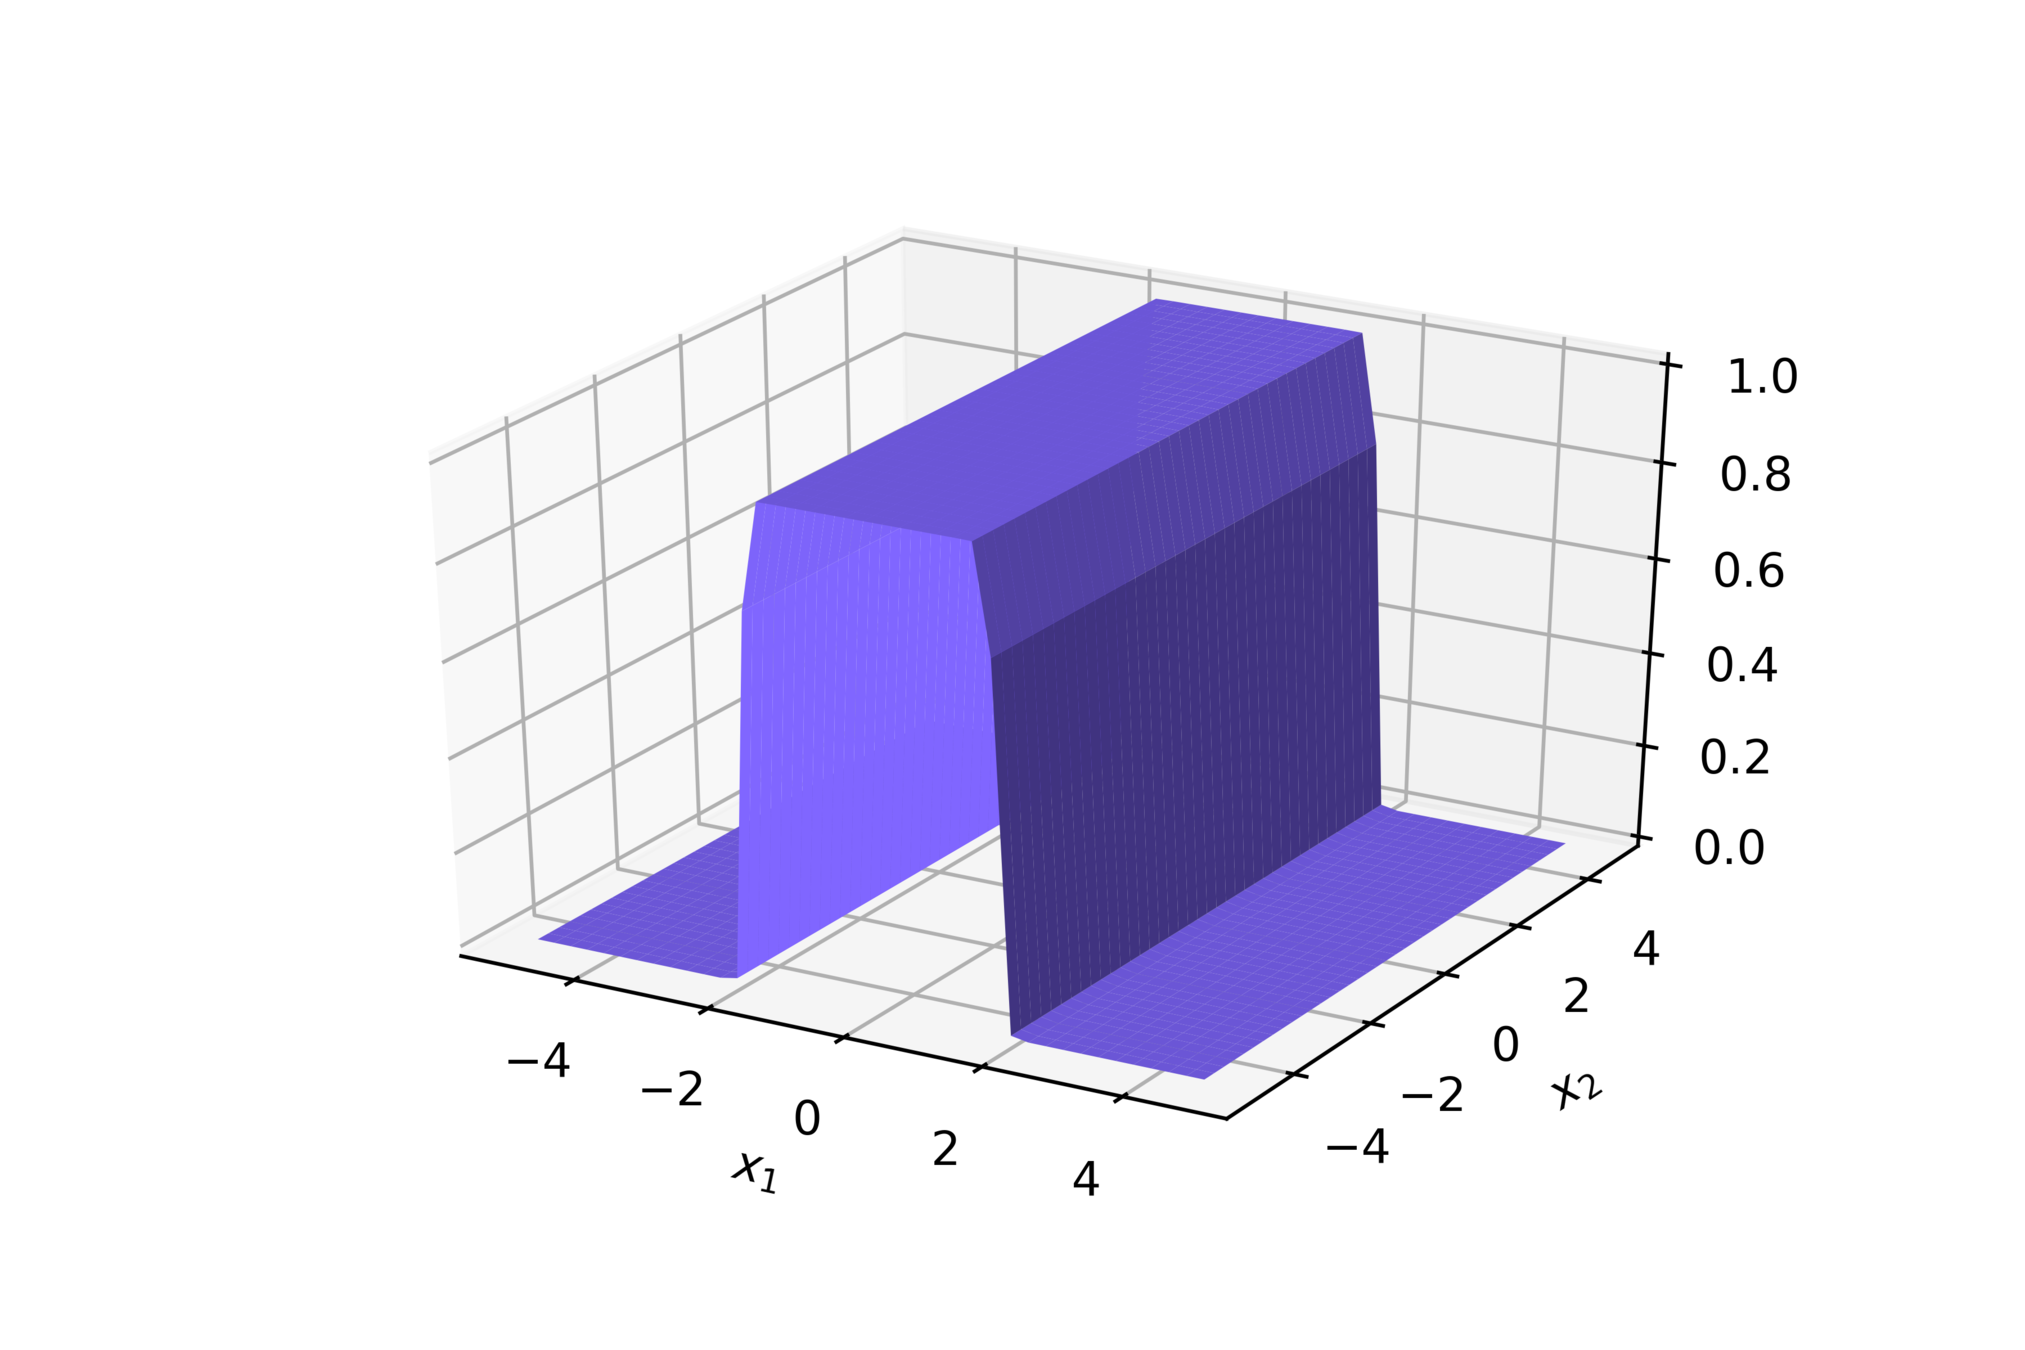
\(w_1 = 2.5, w_2=0, b=5\)
\(w_1 = 2.5, w_2=0, b=-5\)
\(w_1 = 0, w_2=2.5, b=-5\)
\(w_1 = 0, w_2=2.5, b=5\)
\(w = 3, b=6\)
\(+\)
Take-aways
How does all this connect to the six jars that we saw earlier ?
(c) One Fourth Labs
Show the 6 jars
1) Below data show a plot for non-linearly separable data
2) Below task show that you want to separate the blue points from red points
3) Below model show that you will be using a complex but smoooth function to do this
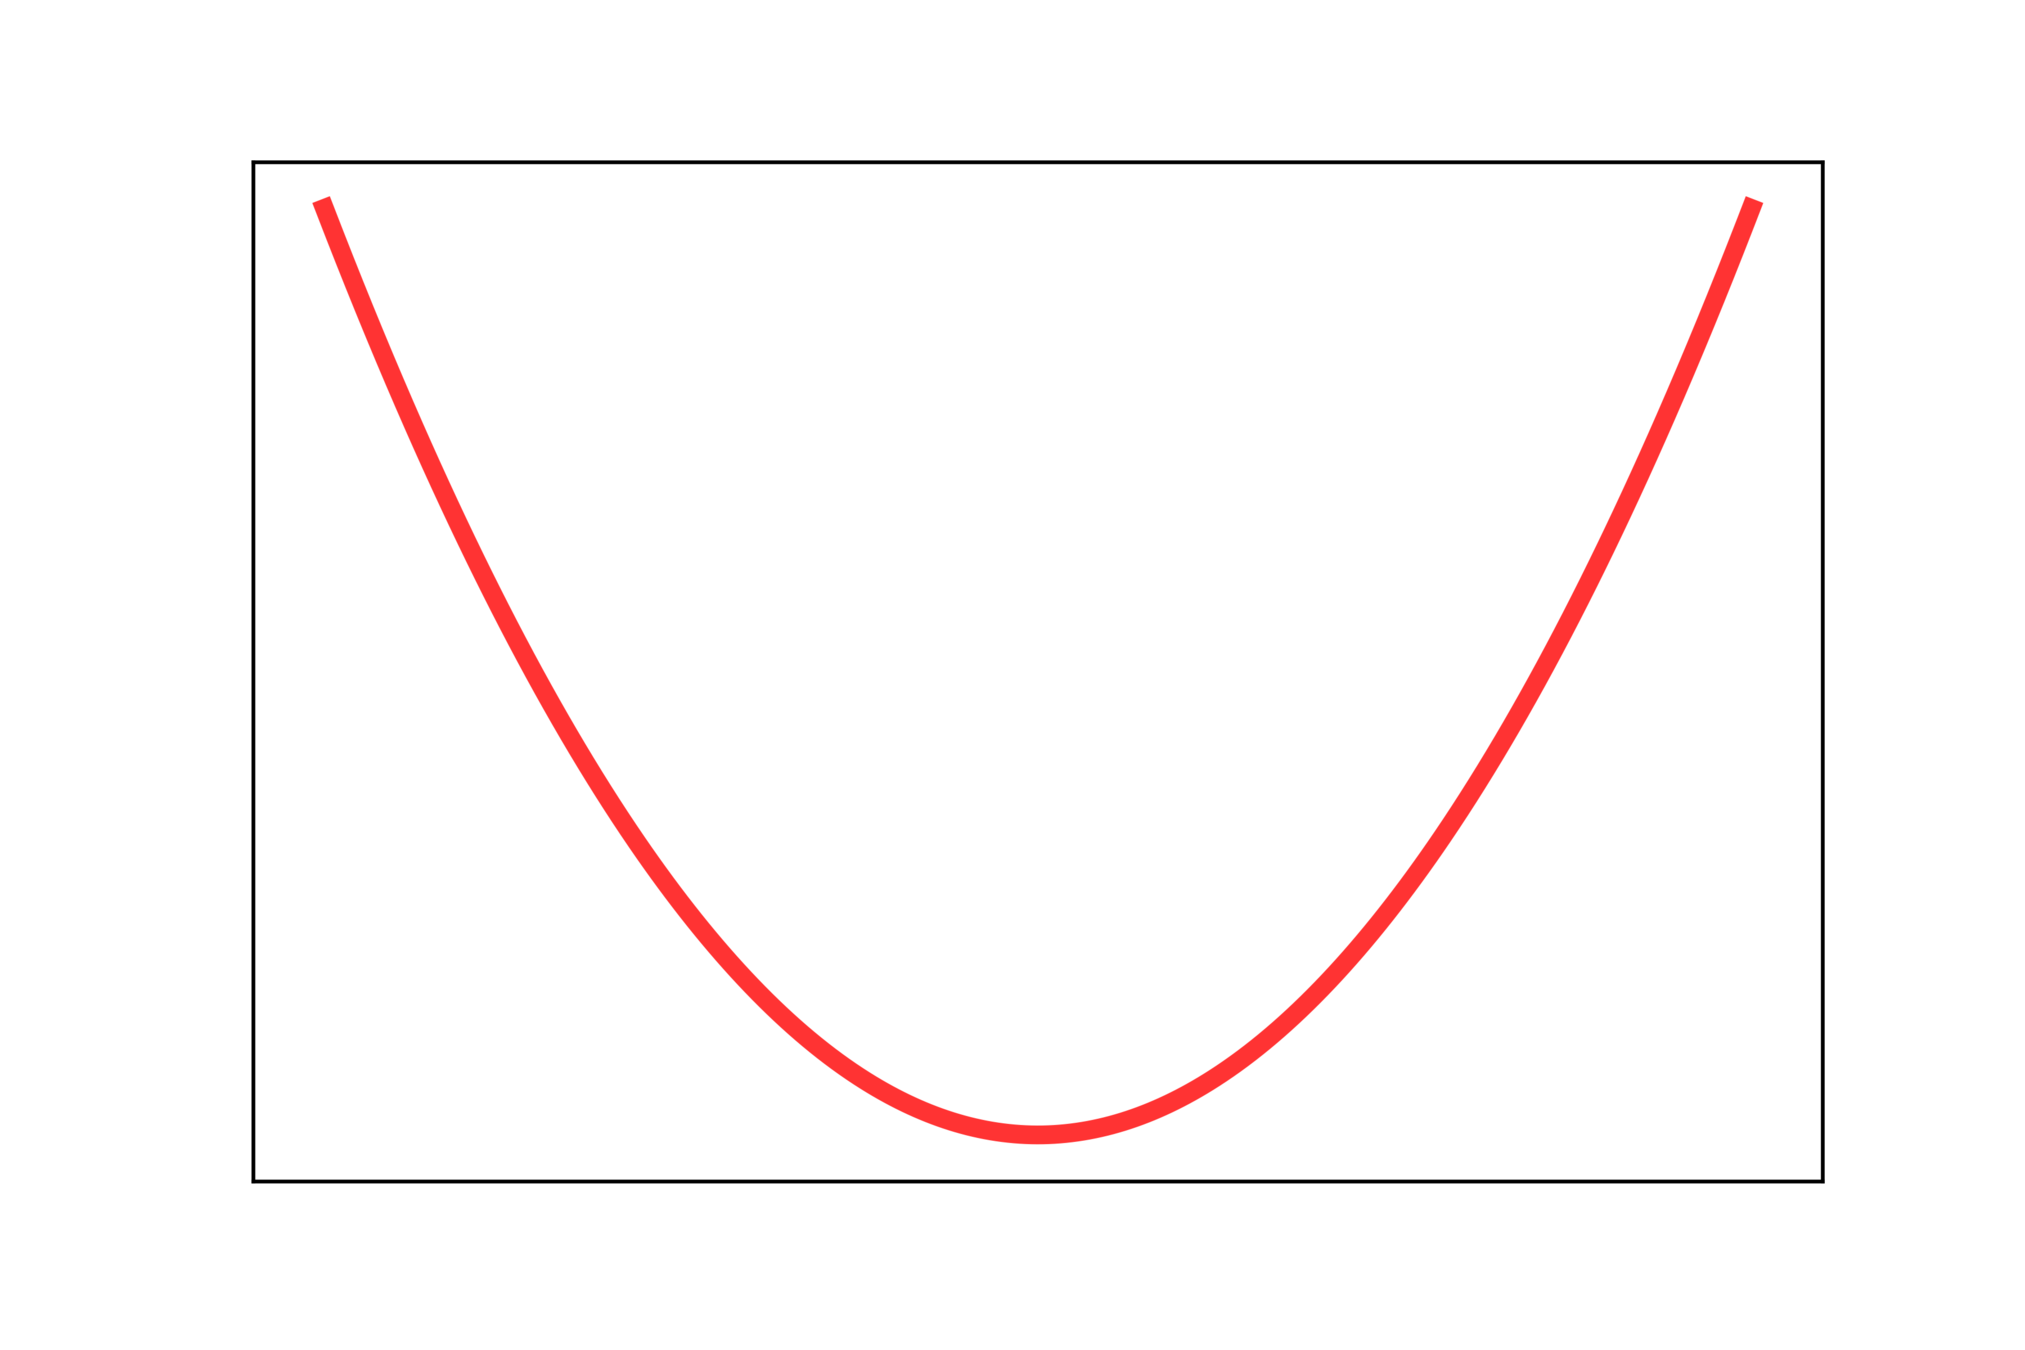
4) Below loss function show the curve for x^2 which is continuous
5) below learning algorithm show the update rule with derivatives
I will then give some commentary to connect all this
1. we care abt cntns functions
2. this slide (what is this function and what you are doing is essentially adjusting its parameters)
3. once again show that sigmoid cant do this
4. show how to project 3d data to 2d data
5. now take multiple datasets from kaggle and show their projections (in each case there would be a diff function fitting the data)
6.now show all the different functions that we had for different datasets. There is no way we can come up with these functions. what we know are basic functions but if we combine them we will get increasingly complex functions. lead upto UAT
7. also show how you can always model simple relation using complex functions (need a demo for this)
8. show summary slide connecting data task model and learning algo (we are going to see a family of complex functions)
Take-aways
How to distribute your work through the six jars?
(c) One Fourth Labs
Accuracy


Data
Model
Loss
Learning
Task
Evaluation


\( w = w + \eta \frac{\partial L}{\partial w} \)
\( b = b + \eta \frac{\partial L}{\partial b} \)
Take-aways
What was all this leading up to ?
(c) One Fourth Labs
Show the 6 jars
1) On LHS Show one sigmoid neuron
2) Now add one more neuron, then one more and so on to make the ground floor (basically slowly build the fully connected neural network)