Towards an Operational Data Assimilation System: A Detailed Web-Based Framework for Weather Forecast
Supervisor:
Elias D. NIÑO-RUIZ, Ph.D.
Author:
Juan S. Rodriguez Donado
A thesis submitted in fulfillment of the requirements for the degree of Master of Science
Department of Systems Engineering
Universidad del Norte
May 5, 2022
Chapters
- Introduction
- Methods and Objectives
- Model Setup
- syseng-hpc scripts
- Domain Wizard
- Fetch Input data
- Interpolation
- Running WPS
- SLURM Job
- Output visualization
- Publish
- Web page
- Conclusions
Introduction
- The "Exposure to Pollutants Regional Research Ex- PoR2" project
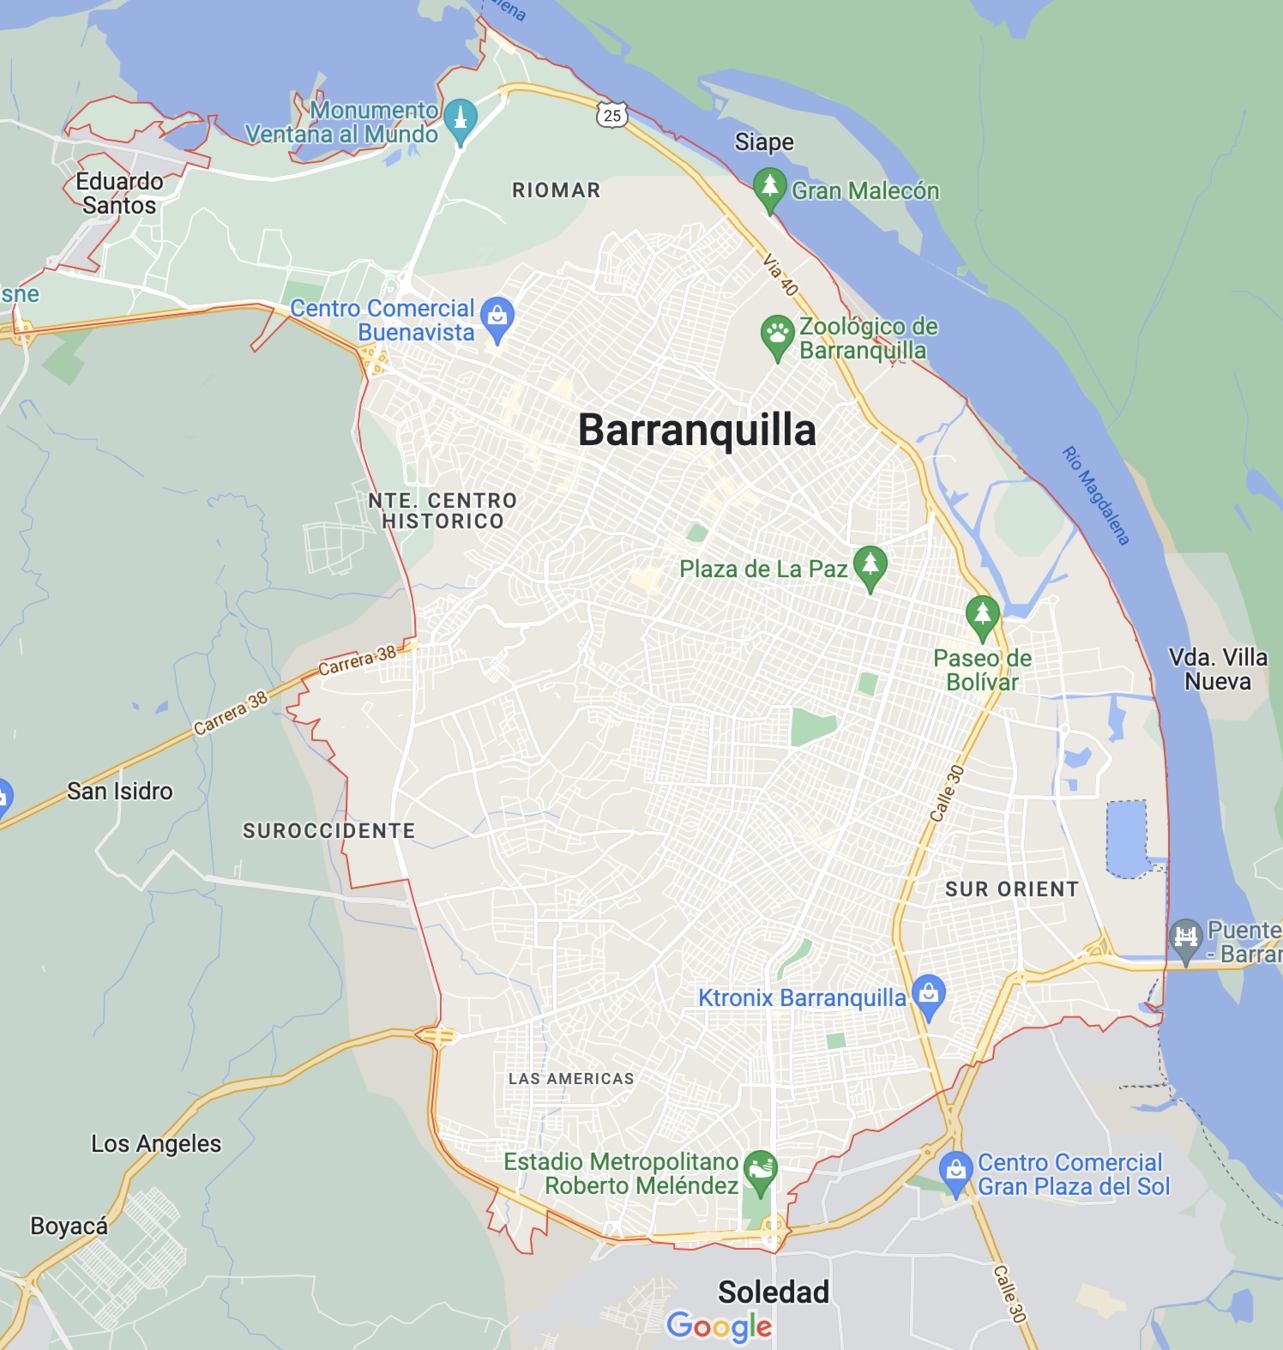
- Forecast of meteorological variables in Barranquilla, Colombia
- WRF model runs on the Granado HPC cluster
- GFS NOAA -> GRIB2
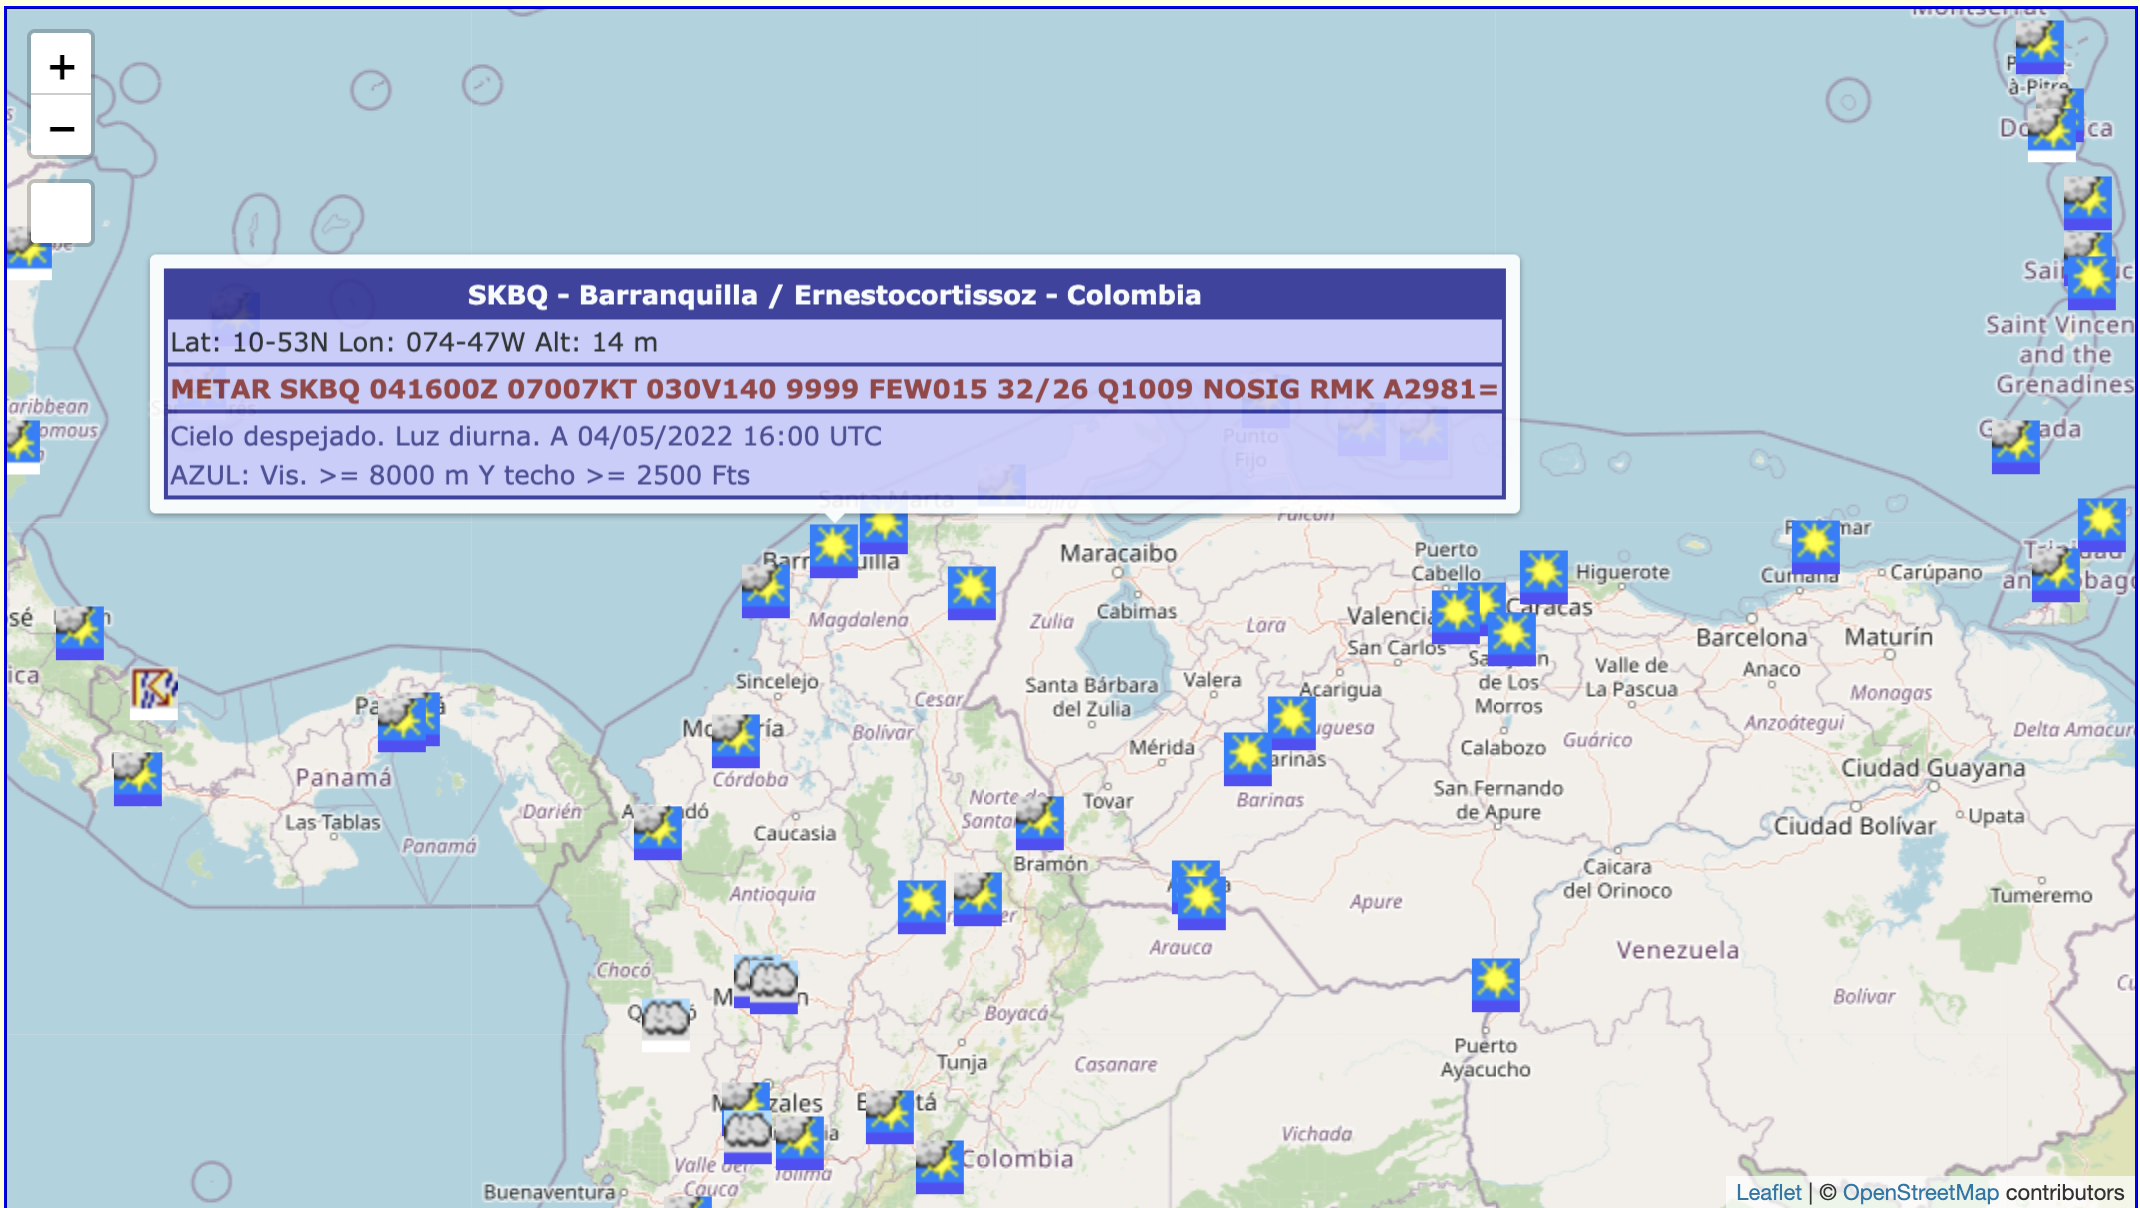
- OGIMET -> METAR
- GIF and HTML maps
- Github -> REST API + Pages
Introduction
Taken from here
Taken from here
Taken from here
Taken from here
Introduction
WRF simulations of hurricane Iota. https://aml-cs.github.io/
Methods and Objectives
Currently there is no system capable of running WRF simulations on the Granado HPC cluster, nor a web page to display the results. Such a system will be the basis for upcoming projects related to "ExPoR2 Regional Contaminant Exposure Research".
1. Problem Statement
Methods and Objectives
To design an implement an Operational Data Assimilation System, highly extensible and reliable.
2. Main Objective
3. Specific Objectives
- To design and implement a modular system capable of running the WRF model on the Granado HPC.
- To design and implement dynamic map generation with WRF model output.
- To design and implement a web site capable of displaying the latest simulation results.
- To fetch, parse and store data from external services such as: AWS S3 and OGIMET.
4. System requeriments
| Functional requirements | Non-functional requirements |
|---|---|
| Execution of the system by a Cronjob every 3 hours. | Keep logs for each execution of the system. |
| Obtain GRIB2 files from NOAA GFS for the defined simulation time. | The system web page should be easy to use, responsive and user friendly. |
| Obtain METAR reports from SKBQ published in OGIMET. | The web page should dynamically load the visualizations. |
| Store METAR reports in HDF5 files for the defined simulation time. | The system should run in an isolated environment in the cluster. |
| Interpolation of surface level variables | Scripts documentation. |
| Run WPS with the GRIB2 files. | |
| Run the WRF model (SLURM job). | |
| Generate visualizations. | |
| Publish output on Github. | |
| Results should be available on https://aml-cs.github.io/. |
Methods and Objectives
- All system components are Open Source.
- Syseng-scripts installed in the Granado HPC cluster.
- The https://aml-cs.github.io/ web site.
5. Expected Main Contributions
Methods and Objectives
- Components aim to have a single responsibility.
- Don't Repeat Yourself (DRY) design principle.
- Python: modules + built-in libraries.
- AWS S3 vs Github Repository.
- Github services: REST API, Pages, Actions.
6. Architectural decisions (aka Methodology)
Methods and Objectives

Model Setup
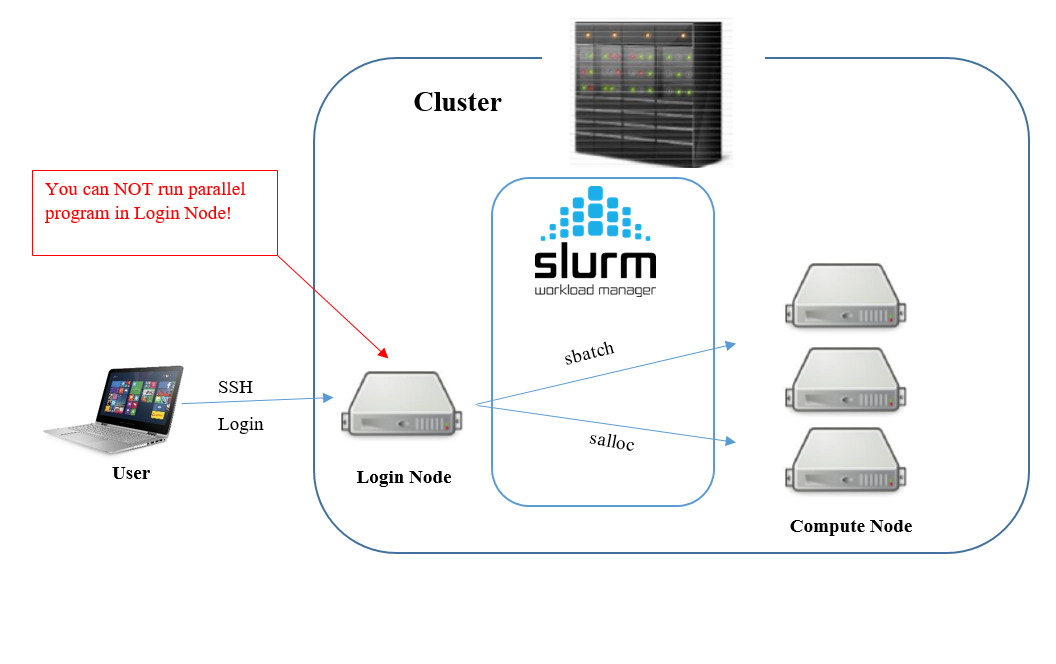
- The Modules package + Conda
- SLURM
- Crontab
Taken from here
Load env
Model Setup
#!/usr/bin/env sh

wait_file() {
  local file="$1"; shift
  local wait_seconds="${1:-1800}"; shift # 30 minutes as default timeout
  until test $((wait_seconds--)) -eq 0 -o -e "$file" ; do sleep 1; done
  ((++wait_seconds))
}

export WORK_DIR='/work/syseng/users/sjdonado/workspace/wrf-baq-0.5km'
cd $WORK_DIR

module load wrf/4.3-baq-0.5km miniconda

eval "$(conda shell.bash hook)"
conda activate wrf-baq-0.5km

rm -f ./output/*

echo "Setting up env variables..."
eval "$(./set_env_variables.py)"

echo "*** Debugging parameters ***"
echo "Created at: $CREATED_AT"
echo "Start date: $START_DATE"
echo "End date: $END_DATE"
echo "WRF interval hours: $WRF_INTERVAL_HOURS"
echo "WRF output: $WRF_OUTPUT"
echo "NOAA AWS Bucket: $NOAA_AWS_BUCKET"
echo "GFS Start date: $GFS_START_DATE"
echo "GFS Time offset: $GFS_TIME_OFFSET"
echo "GFS interval hours: $GFS_INTERVAL_HOURS"
echo "Ogimet Start Date: $OGIMET_START_DATE"
echo "Ogimet End Date: $OGIMET_END_DATE"
echo "NC variables: $NC_VARIABLES"
echo "BAQ station coordinates: $BAQ_STATION_COORDINATES"
echo "******"

./download_gfs_data.py
./fetch_ogimet_data.py
./ogimet_grib_interpolation.py

run-wps "$START_DATE" "$END_DATE" -i 3 --data-dir ./gfs-data

rm -f ./wrf_output
sbatch ./sbatch-run.sh

wait_file "./wrf_output" && {
  cat slurm.out.log

  echo "Generating gifs..."
  ./build_maps.py

  echo "Uploading to Github..."

  git pull
  git add output
  git commit -m "auto [$CREATED_AT]: BAQ 0.5km WRF output"
  git push
}

echo "Done!"Load environments in the Main script
Model Setup
#!/usr/bin/env python3

import os
from datetime import datetime, timedelta

import reporter

if __name__ == '__main__':
    NOAA_AWS_BUCKET = 'noaa-gfs-bdp-pds'
    NC_VARIABLES = "pwater,temp,wind,uwind,vwind,press"
    # 10° 53' N, 074° 47' W
    BAQ_STATION_COORDINATES = "10.883333,-74.783333"

    WRF_INTERVAL_HOURS = 3
    gfs_interval_hours = 6

    utcnow = datetime.utcnow()

    start_date = utcnow - timedelta(hours=WRF_INTERVAL_HOURS)

    gfs_time_offset = start_date.hour % gfs_interval_hours
    gfs_start_date = start_date - timedelta(hours=gfs_time_offset)

    start_date_offset = start_date.hour % WRF_INTERVAL_HOURS
    start_date -= timedelta(hours=start_date_offset)

    end_date = start_date + timedelta(hours=gfs_interval_hours)

    OGIMET_START_DATE = start_date.strftime('%Y-%m-%d %H')
    OGIMET_END_DATE = end_date.strftime('%Y-%m-%d %H')

    next_window_offset = utcnow.hour % WRF_INTERVAL_HOURS
    if next_window_offset == 2:
        end_date += timedelta(hours=WRF_INTERVAL_HOURS)
        gfs_interval_hours += WRF_INTERVAL_HOURS

    key = 's3://{1}/gfs.{0:%Y}{0:%m}{0:%d}/{0:%H}/atmos/gfs.t{0:%H}z.pgrb2.0p25.f000'.format(
        gfs_start_date, NOAA_AWS_BUCKET)
    exit_code = os.system(f"aws s3 ls --no-sign-request {key} >/dev/null 2>&1")
    if exit_code != 0:
        gfs_start_date -= timedelta(hours=gfs_interval_hours)
        gfs_time_offset += gfs_interval_hours
        gfs_interval_hours += gfs_interval_hours

    GFS_START_DATE = gfs_start_date.strftime('%Y-%m-%d %H')
    GFS_TIME_OFFSET = gfs_time_offset - gfs_time_offset % 3
    GFS_INTERVAL_HOURS = gfs_interval_hours

    START_DATE = start_date.strftime('%Y-%m-%d %H')
    END_DATE = end_date.strftime('%Y-%m-%d %H')

    CREATED_AT = utcnow.strftime('%Y-%m-%d %H:%M')

    WRF_OUTPUT = os.path.abspath('./wrf_output')

    reporter.add({
        'createdAt': CREATED_AT,
        'startDate': START_DATE,
        'endDate': END_DATE,
        'ncVariables': NC_VARIABLES.split(','),
        'ogimetStationCoordinates': BAQ_STATION_COORDINATES.split(',')
    }, logger=False)

    print(f"""
		export CREATED_AT='{CREATED_AT}';
		export START_DATE='{START_DATE}';
		export END_DATE='{END_DATE}';
		export WRF_INTERVAL_HOURS='{WRF_INTERVAL_HOURS}';
		export WRF_OUTPUT='{WRF_OUTPUT}';
		export NOAA_AWS_BUCKET='{NOAA_AWS_BUCKET}';
		export GFS_START_DATE='{GFS_START_DATE}';
		export GFS_TIME_OFFSET='{GFS_TIME_OFFSET}';
		export GFS_INTERVAL_HOURS='{GFS_INTERVAL_HOURS}';
		export OGIMET_START_DATE='{OGIMET_START_DATE}';
		export OGIMET_END_DATE='{OGIMET_END_DATE}';
		export NC_VARIABLES='{NC_VARIABLES}';
		export BAQ_STATION_COORDINATES='{BAQ_STATION_COORDINATES}';
""")The first step of the system execution corresponds to define the environment variables.
Model Setup
#!/bin/bash
#
# Setup and build WRF 4.3 as module
# Tested in Centos 7, Uninorte HPC
# Author: sjdonado@uninorte.edu.co
#

# Load dependencies
module purge
module load autotools prun/1.3 gnu8/8.3.0 openmpi3/3.1.4 ohpc cmake/3.15.4 ksh

# Dir structure
export ROOT_DIR="/work/syseng/pub/WRFV4.3"
mkdir -p $ROOT_DIR/downloads
mkdir -p $ROOT_DIR/model
mkdir -p $ROOT_DIR/data

# Download dependencies
cd $ROOT_DIR/downloads
wget -c http://cola.gmu.edu/grads/2.2/grads-2.2.0-bin-centos7.3-x86_64.tar.gz
wget -c https://www.zlib.net/zlib-1.2.11.tar.gz
wget -c https://support.hdfgroup.org/ftp/HDF5/releases/hdf5-1.12/hdf5-1.12.1/src/hdf5-1.12.1.tar.gz
wget -c https://github.com/Unidata/netcdf-c/archive/refs/tags/v4.8.1.tar.gz -O netcdf-c-4.8.1.tar.gz
wget -c https://github.com/Unidata/netcdf-fortran/archive/refs/tags/v4.5.3.tar.gz -O netcdf-fortran-4.5.3.tar.gz
wget -c https://download.sourceforge.net/libpng/libpng-1.6.37.tar.gz
wget -c https://github.com/jasper-software/jasper/archive/refs/tags/version-2.0.33.tar.gz -O jasper-version-2.0.33.tar.gz
wget -c https://github.com/wrf-model/WRF/archive/refs/tags/v4.3.tar.gz -O WRF-4.3.tar.gz
wget -c https://github.com/wrf-model/WPS/archive/refs/tags/v4.3.tar.gz -O WPS-4.3.tar.gz
wget -c http://www.mpich.org/static/downloads/3.3.1/mpich-3.3.1.tar.gz

# Compilers env flags
export DIR=$ROOT_DIR/library
export CC=gcc
export CXX=g++
export FC=gfortran
export F77=gfortran

# Setup zlib 1.2.11
tar -xvzf $ROOT_DIR/downloads/zlib-1.2.11.tar.gz -C $ROOT_DIR/downloads
cd $ROOT_DIR/downloads/zlib-1.2.11/
./configure --prefix=$DIR
make
make install

export ZLIB=$DIR

# Installing HDF5 1.12.1
tar -xvzf $ROOT_DIR/downloads/hdf5-1.12.1.tar.gz -C $ROOT_DIR/downloads
cd $ROOT_DIR/downloads/hdf5-1.12.1
./configure --prefix=$DIR --with-zlib=$DIR --enable-hl --enable-fortran
make
make install

export HDF5=$DIR

export LD_LIBRARY_PATH=$DIR/lib:$LD_LIBRARY_PATH
export LDFLAGS=-L$DIR/lib
export CPPFLAGS=-I$DIR/include

# Installing netcdf-c-4.8.1
tar -xvzf $ROOT_DIR/downloads/netcdf-c-4.8.1.tar.gz -C $ROOT_DIR/downloads
cd $ROOT_DIR/downloads/netcdf-c-4.8.1
./configure --prefix=$DIR
make check
make install

export LIBS="-lnetcdf -lhdf5_hl -lhdf5 -lz"

# Installing netcdf-fortran-4.5.3
tar -xvzf $ROOT_DIR/downloads/netcdf-fortran-4.5.3.tar.gz -C $ROOT_DIR/downloads
cd $ROOT_DIR/downloads/netcdf-fortran-4.5.3
./configure --prefix=$DIR
make check
make install

export NETCDF=$DIR

# Installing mpich-3.3.1
tar -xvzf $ROOT_DIR/downloads/mpich-3.3.1.tar.gz -C $ROOT_DIR/downloads
cd $ROOT_DIR/downloads/mpich-3.3.1/
./configure --prefix=$DIR
make
make install

export PATH=$DIR/bin:$PATH

############################ WRF 4.3 ###################################

# Setup WRF-4.3
tar -xvzf $ROOT_DIR/downloads/WRF-4.3.tar.gz -C $ROOT_DIR/model
cd $ROOT_DIR/model/WRF-4.3
./clean -a
./configure # 34, 1 for gfortran and distributed memory
./compile em_real >& compile.out

echo "If compilation was successful, you should see wrf.exe"
ls -l main/*.exe
if [ ! -f main/wrf.exe ]; then
    echo "wrf.exe not found"
    exit 1
fi

export WRF_DIR=$ROOT_DIR/model/WRF-4.3

############################ WPS 4.3 ###################################

# Setup libpng-1.6.37
tar -xvzf $ROOT_DIR/downloads/libpng-1.6.37.tar.gz -C $ROOT_DIR/downloads
cd $ROOT_DIR/downloads/libpng-1.6.37
./configure --prefix=$DIR
make
make install

# Setup jasper-version-2.0.33
tar -xvzf $ROOT_DIR/downloads/jasper-version-2.0.33.tar.gz -C $ROOT_DIR/downloads
cd $ROOT_DIR/downloads/jasper-version-2.0.33
export JASPER_BUILD_DIR=$ROOT_DIR/downloads/jasper-version-2.0.33-build
mkdir -p $JASPER_BUILD_DIR
cmake -G "Unix Makefiles" -H$(pwd) -B$JASPER_BUILD_DIR -DCMAKE_INSTALL_PREFIX=$DIR
cd $JASPER_BUILD_DIR
make clean all
make test
make install
mv $DIR/lib64/* $DIR/lib
rmdir $DIR/lib64

export JASPERLIB=$DIR/lib
export JASPERINC=$DIR/include

# Setup WPSV4.3
tar -xvzf $ROOT_DIR/downloads/WPS-4.3.tar.gz -C $ROOT_DIR/model
cd $ROOT_DIR/model/WPS-4.3
./clean
./configure # 3
./compile >& compile.out

echo "If compilation was successful, you should see geogrid.exe, metgrid.exe and ungrib.exe"
ls -l *.exe
if [ ! -f geogrid.exe ] || [ ! -f metgrid.exe ] || [ ! -f ungrib.exe ]; then
    echo "geogrid.exe, metgrid.exe or ungrib.exe not found"
    exit 1
fi

######################## Post-Processing Tools ####################

# Setup Grads 2.2.0
tar -xvzf $ROOT_DIR/downloads/grads-2.2.0-bin-centos7.3-x86_64.tar.gz -C $ROOT_DIR/downloads
mv $ROOT_DIR/downloads/grads-2.2.0/bin/* $DIR/bin
mv $ROOT_DIR/downloads/grads-2.2.0/lib/* $DIR/lib

# Setup ARWpost
cd $ROOT_DIR/downloads
wget -c http://www2.mmm.ucar.edu/wrf/src/ARWpost_V3.tar.gz
tar -xvzf $ROOT_DIR/downloads/ARWpost_V3.tar.gz -C $ROOT_DIR/model
cd $ROOT_DIR/model/ARWpost
./clean
sed -i -e 's/-lnetcdf/-lnetcdff -lnetcdf/g' $ROOT_DIR/model/ARWpost/src/Makefile
./configure # 3
sed -i -e 's/-C -P/-P/g' $ROOT_DIR/model/ARWpost/configure.arwp
./compile

######################## Model Setup Tools ########################

# Setup DomainWizard
cd $ROOT_DIR/downloads
wget -c http://esrl.noaa.gov/gsd/wrfportal/domainwizard/WRFDomainWizard.zip
mkdir $ROOT_DIR/model/WRFDomainWizard
unzip $ROOT_DIR/downloads/WRFDomainWizard.zip -d $ROOT_DIR/model/WRFDomainWizard
chmod +x $ROOT_DIR/model/WRFDomainWizard/run_DomainWizard

echo "Adding scripts to PATH..."
export PATH=/work/syseng/pub/syseng-hpc/scripts:$PATH

# echo "Writting modulefile..."

mkdir -p /opt/ohpc/pub/modulefiles/wrf/
cat > /opt/ohpc/pub/modulefiles/wrf/4.3  <<EOL
#%Module1.0#####################################################################
proc ModulesHelp { } {
    puts stderr " "
    puts stderr "This module loads WRF-4.3 and dependencies"
    puts stderr "\nVersion 4.3\n"
}
module-whatis "Name: wrf/4.3"
module-whatis "Version: 4.3"
module-whatis "Category: utility, developer support"
module-whatis "Keywords: System, Utility"
module-whatis "The Weather Research and Forecasting (WRF) model"
module-whatis "URL https://github.com/wrf-model/WRF"
set             version                 4.3
prepend-path    PATH                    $PATH
prepend-path    LD_LIBRARY_PATH         $LD_LIBRARY_PATH
setenv          CC                      gcc
setenv          CXX                     g++
setenv          FC                      gfortran
setenv          F77                     gfortran
setenv          HDF5                    $ROOT_DIR/library
setenv          CPPFLAGS                -I$ROOT_DIR/library/include
setenv          LDFLAGS                 -L$ROOT_DIR/library/lib
setenv          NETCDF                  $ROOT_DIR/library
setenv          LIBS                    -lnetcdf -lhdf5_hl -lhdf5 -lz
setenv          JASPERLIB               $JASPERLIB
setenv          JASPERINC               $JASPERINC
setenv          NAMELISTS_DIR           /work/syseng/pub/syseng-hpc/namelists
setenv          BIN_DIR	                /work/syseng/pub/syseng-hpc/scripts
setenv          WRF_ROOT_DIR            $ROOT_DIR
setenv          WRF_DIR                 $ROOT_DIR/model/WRF-4.3
setenv          WPS_DIR                 $ROOT_DIR/model/WPS-4.3
setenv          GEOG_DATA_PATH          $ROOT_DIR/data/WPS_GEOG
setenv          REAL_DATA_PATH          $ROOT_DIR/data/WPS_REAL
set-alias       download-grib	        "/work/syseng/pub/syseng-hpc/scripts/download-grib.py"
set-alias       run-wps	                "/work/syseng/pub/syseng-hpc/scripts/run_wps.py"
set-alias       run-wrf	                "/work/syseng/pub/syseng-hpc/scripts/run_wrf.py"
EOL

echo "Setting permissions..."

chgrp -R syseng $ROOT_DIR
chmod -R 777 $ROOT_DIR

echo "WRF-4.3 installed successfully!"
echo "IMPORTANT: Download WRF Preprocessing System (WPS) Geographical Input Data Mandatory Fields using ./download-geog-data"All the steps to compile the model were encapsulated in a single bash script
syseng-hpc scripts
To run WRF and WPS you must update the values for the simulation variables in plain text files called namelists.

syseng-hpc scripts
Download and unzip the file geog_high_res_mandatory.tar.gz in the installation di- rectory.
1. download-geog-data
Retrieves 120 "ds083.2" observations available online at rda.ucar.edu (total size 3.09G), requires credentials of a previously registered user. (downloaded by chunks)
2. download-grib
syseng-hpc scripts
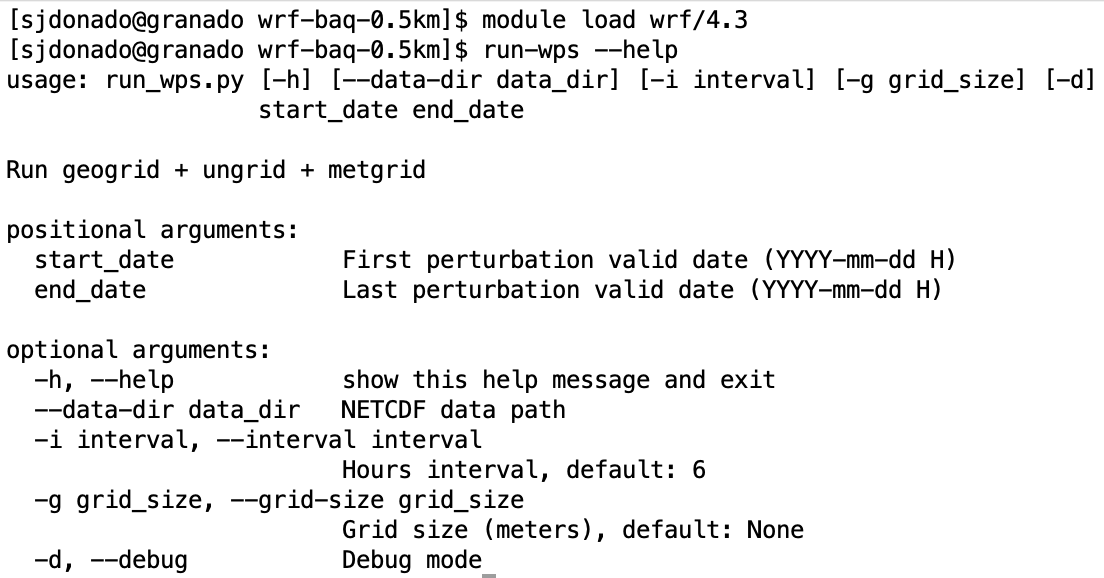
Runs geogrid + ungrid + metgrid
3. run-wps
syseng-hpc scripts
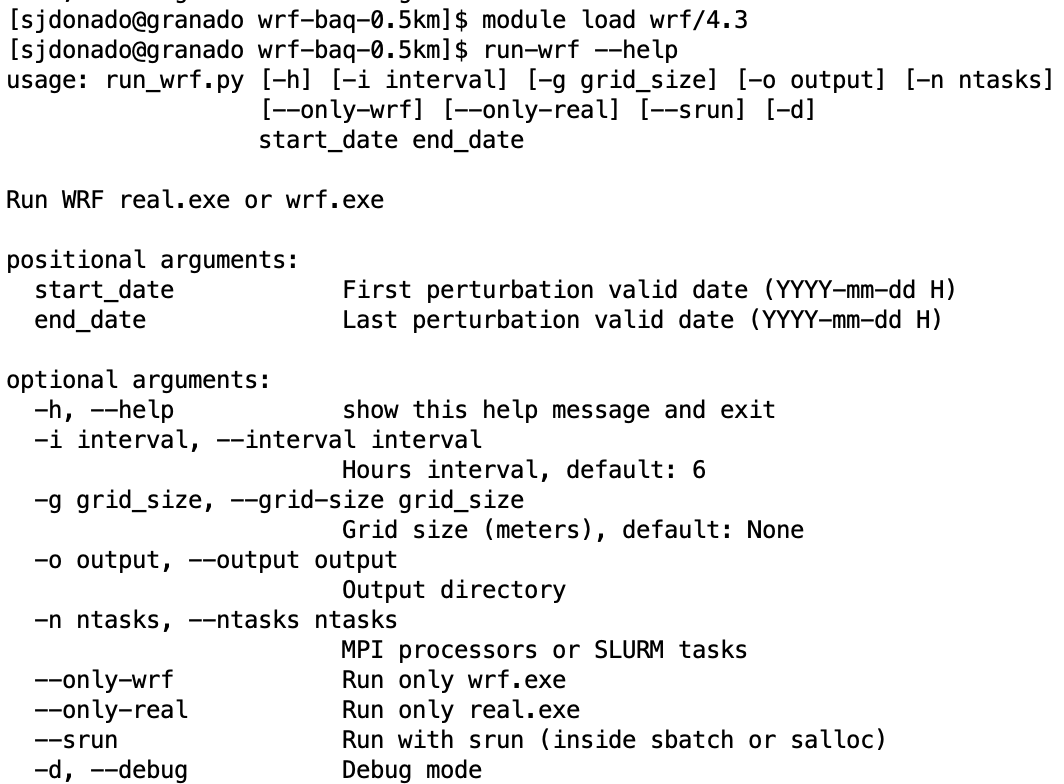
Runs WRF real.exe or wrf.exe
4. run-wrf
syseng-hpc scripts
def update_namelist(namelist_path, options):
	namelist_file = open(namelist_path)
	content = namelist_file.read()
	namelist_file.close()

	namelist_file = open(namelist_path, 'w')
	for (key, value) in options.items():
		content = re.sub(r'(' + key + r'\s*\=).*,', r'\g<1> ' + str(value) + ',', content)
	namelist_file.write(content)
namelist_file.close()def update_wps_namelist(options, debug_mode):
os.system(f"ln -sf {NAMELIST_FILE} {WPS_DIR}/namelist.wps")
update_namelist(NAMELIST_FILE, options)
if debug_mode:
for (key, value) in options.items():
print_msg(f"{key}: {value}", 'header')
if __name__ == '__main__':
args = init_cli()
debug_mode = args.debug
start_date = datetime.datetime.strptime(args.start_date, '%Y-%m-%d %H')
end_date = datetime.datetime.strptime(args.end_date, '%Y-%m-%d %H')
interval = args.interval
grid_size = args.grid_size
data_dir = os.path.abspath(args.data_dir)
if WPS_DIR is None:
raise Exception('Module wrf not loaded')
namelist_input = {
'start_date': f"'{start_date.strftime('%Y-%m-%d_%H:%M:%S')}'",
'end_date': f"'{end_date.strftime('%Y-%m-%d_%H:%M:%S')}'",
'interval_seconds': interval * 3600,
}
if grid_size:
namelist_input['dx'] = grid_size
namelist_input['dy'] = grid_size
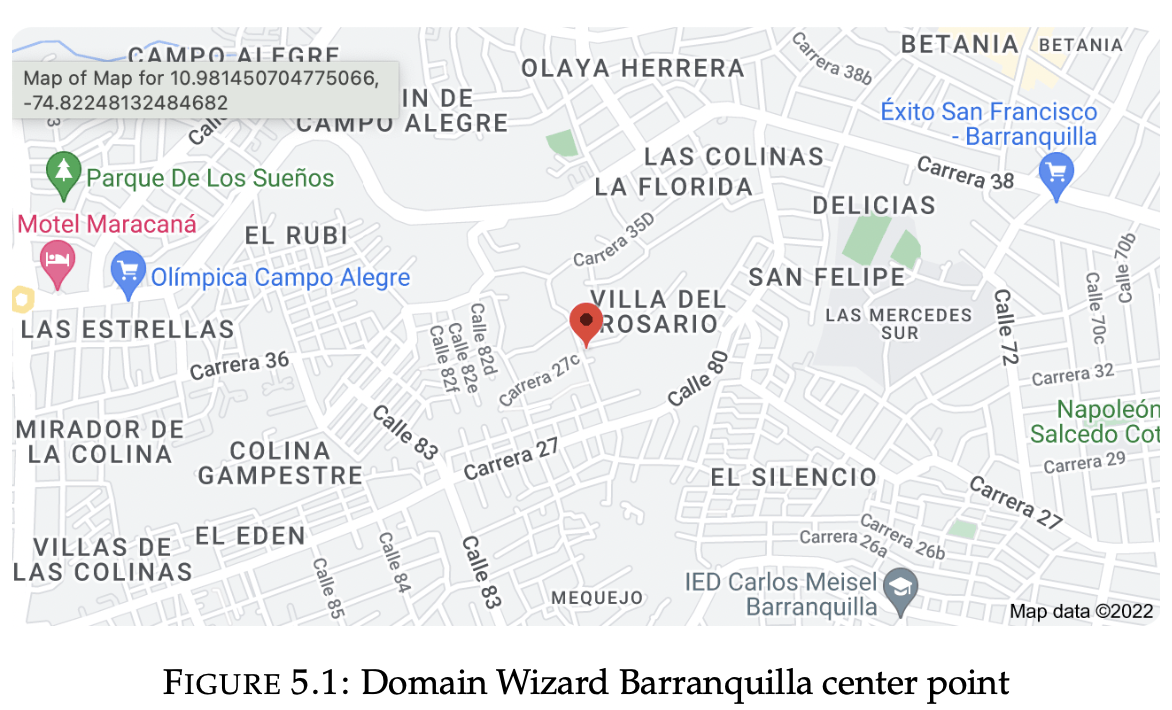
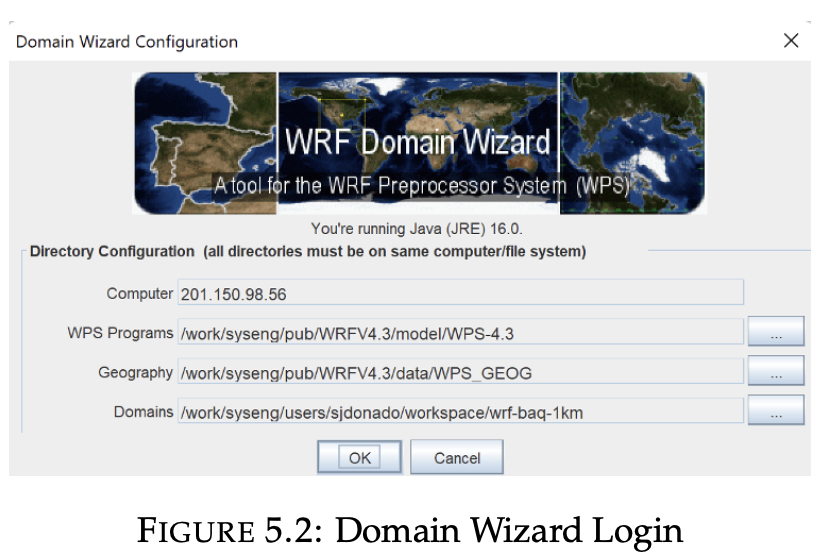
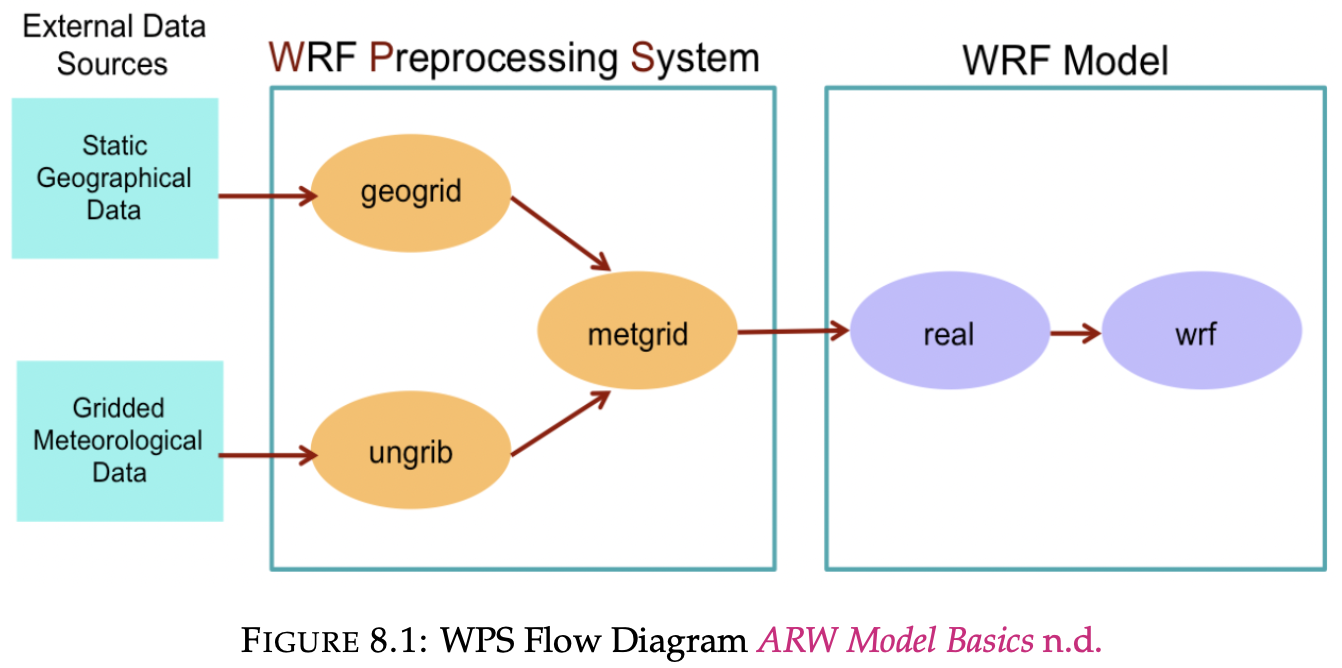
update_wps_namelist(namelist_input, debug_mode)Domain Wizard
Domain Wizard enables users to easily define and localize domains (cases) by se- lecting a region of the Earth and choosing a map projection (WRF Portal n.d.).
Domain Wizard
1. SSH connection
Domain Wizard
2. Domain config

Domain Wizard
3. Results
    &domains
     time_step                      = 2,
     time_step_fract_num            = 0,
     time_step_fract_den            = 1,
     max_dom                        = 1,
     e_we                           = 91,
     e_sn                           = 82,
     e_vert                         = 35,
     p_top_requested                = 5000,
     num_metgrid_levels             = 40
     num_metgrid_soil_levels        = 4,
     dx                             = 356.324,
     dy                             = 356.324,
     grid_id                        = 1,
     parent_id                      = 1,
     i_parent_start                 = 1,
     j_parent_start                 = 1,
     parent_grid_ratio              = 1,
     parent_time_step_ratio         = 1,
     feedback                       = 1,
     smooth_option                  = 0
    /
namelist.input
    &geogrid
     parent_id             = 1,
     parent_grid_ratio     = 1,
     i_parent_start        = 1,
     j_parent_start        = 1,
     e_we                  = 91,
     e_sn                  = 82,
     geog_data_res         = '10m',
     dx                    = 0.003205,
     dy                    = 0.003205,
     map_proj              = 'lat-lon',
     ref_lat               = 10.981,
     ref_lon               = -74.822,
     truelat1              = 10.981,
     truelat2              = 10.981,
     stand_lon             = -74.822,
     ref_x                 = 45.5,
     ref_y                 = 41.0,
    /
namelist.wps
The variable num_metgrid_levels must be updated manually, the value corresponding to the GFS data is 34.
The variable geog_data_res must be manually updated to the "default" value.
Fetch Input data

GRIB2
TXT
Fetch Input data
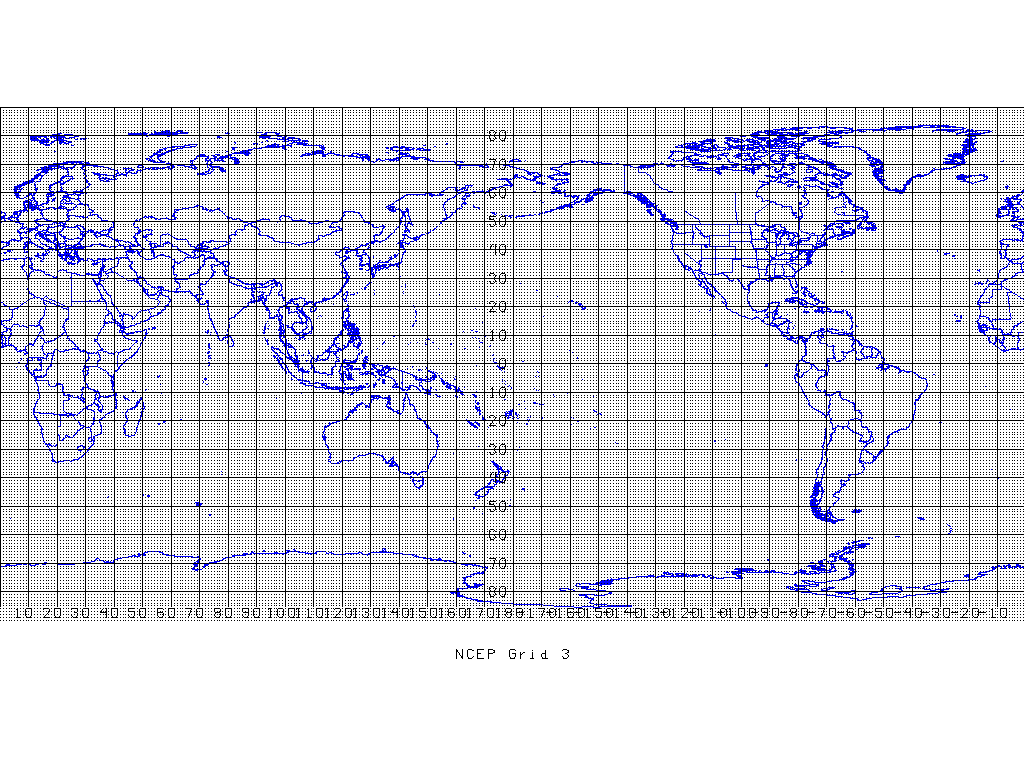
1. Downloading GFS data
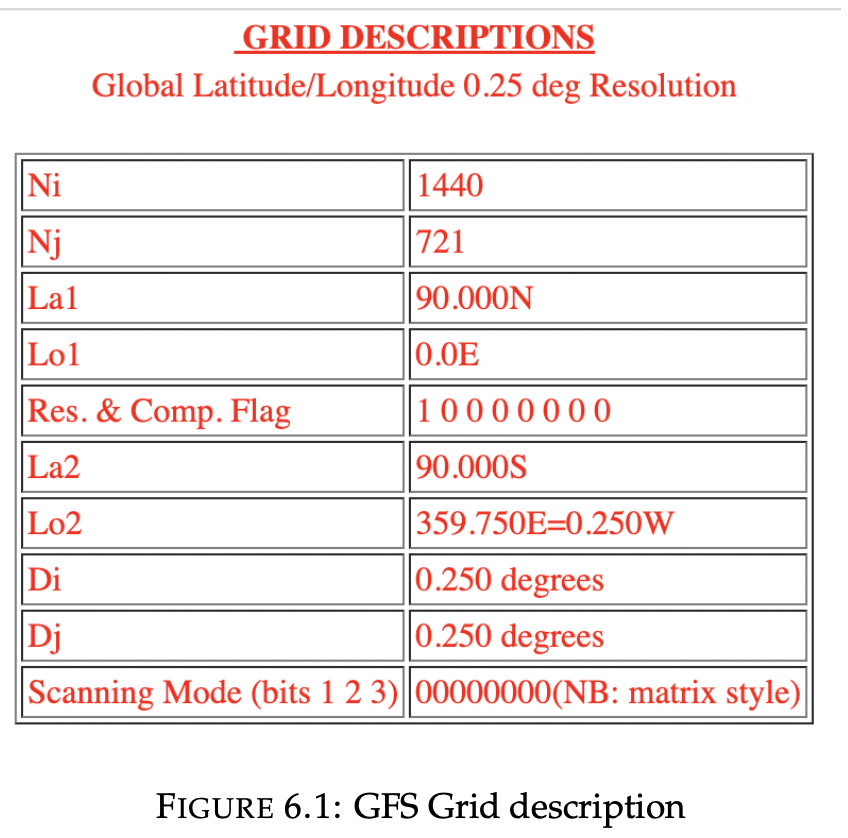
The chosen grid is "1038240-point (1440x721)Global longitude-latitude with (1,1) at (0E,90N), matrix layout. N.B.: prime meridian not duplicated".
Format gfs.tCCz.pgrb2.0p25.fFFF
- CC is the model cycle runtime (i.e. 00, 06, 12, 18).
- FFF is the forecast hour of product from 000 - 128 (i.e. 000, 003, 006, 009).
Fetch Input data
1. Downloading GFS data
Created at: 2022-04-20 08:00
Start date: 2022-04-20 03
End date: 2022-04-20 12
WRF interval hours: 3
gfs.20220420/00/atmos/gfs.t00z.pgrb2.0p25.f003
gfs.20220420/00/atmos/gfs.t00z.pgrb2.0p25.f006
gfs.20220420/00/atmos/gfs.t00z.pgrb2.0p25.f009
gfs.20220420/00/atmos/gfs.t00z.pgrb2.0p25.f012- GFS data are for the 24 hours following the last date of publication (within the 6-hour cycle).
- In cases where START_DATE does not have a time value whose mod 3 is equal to 0, one more time window is added. Having as final result the real interval of [−3h, 0, +2 − 4h].
Fetch Input data
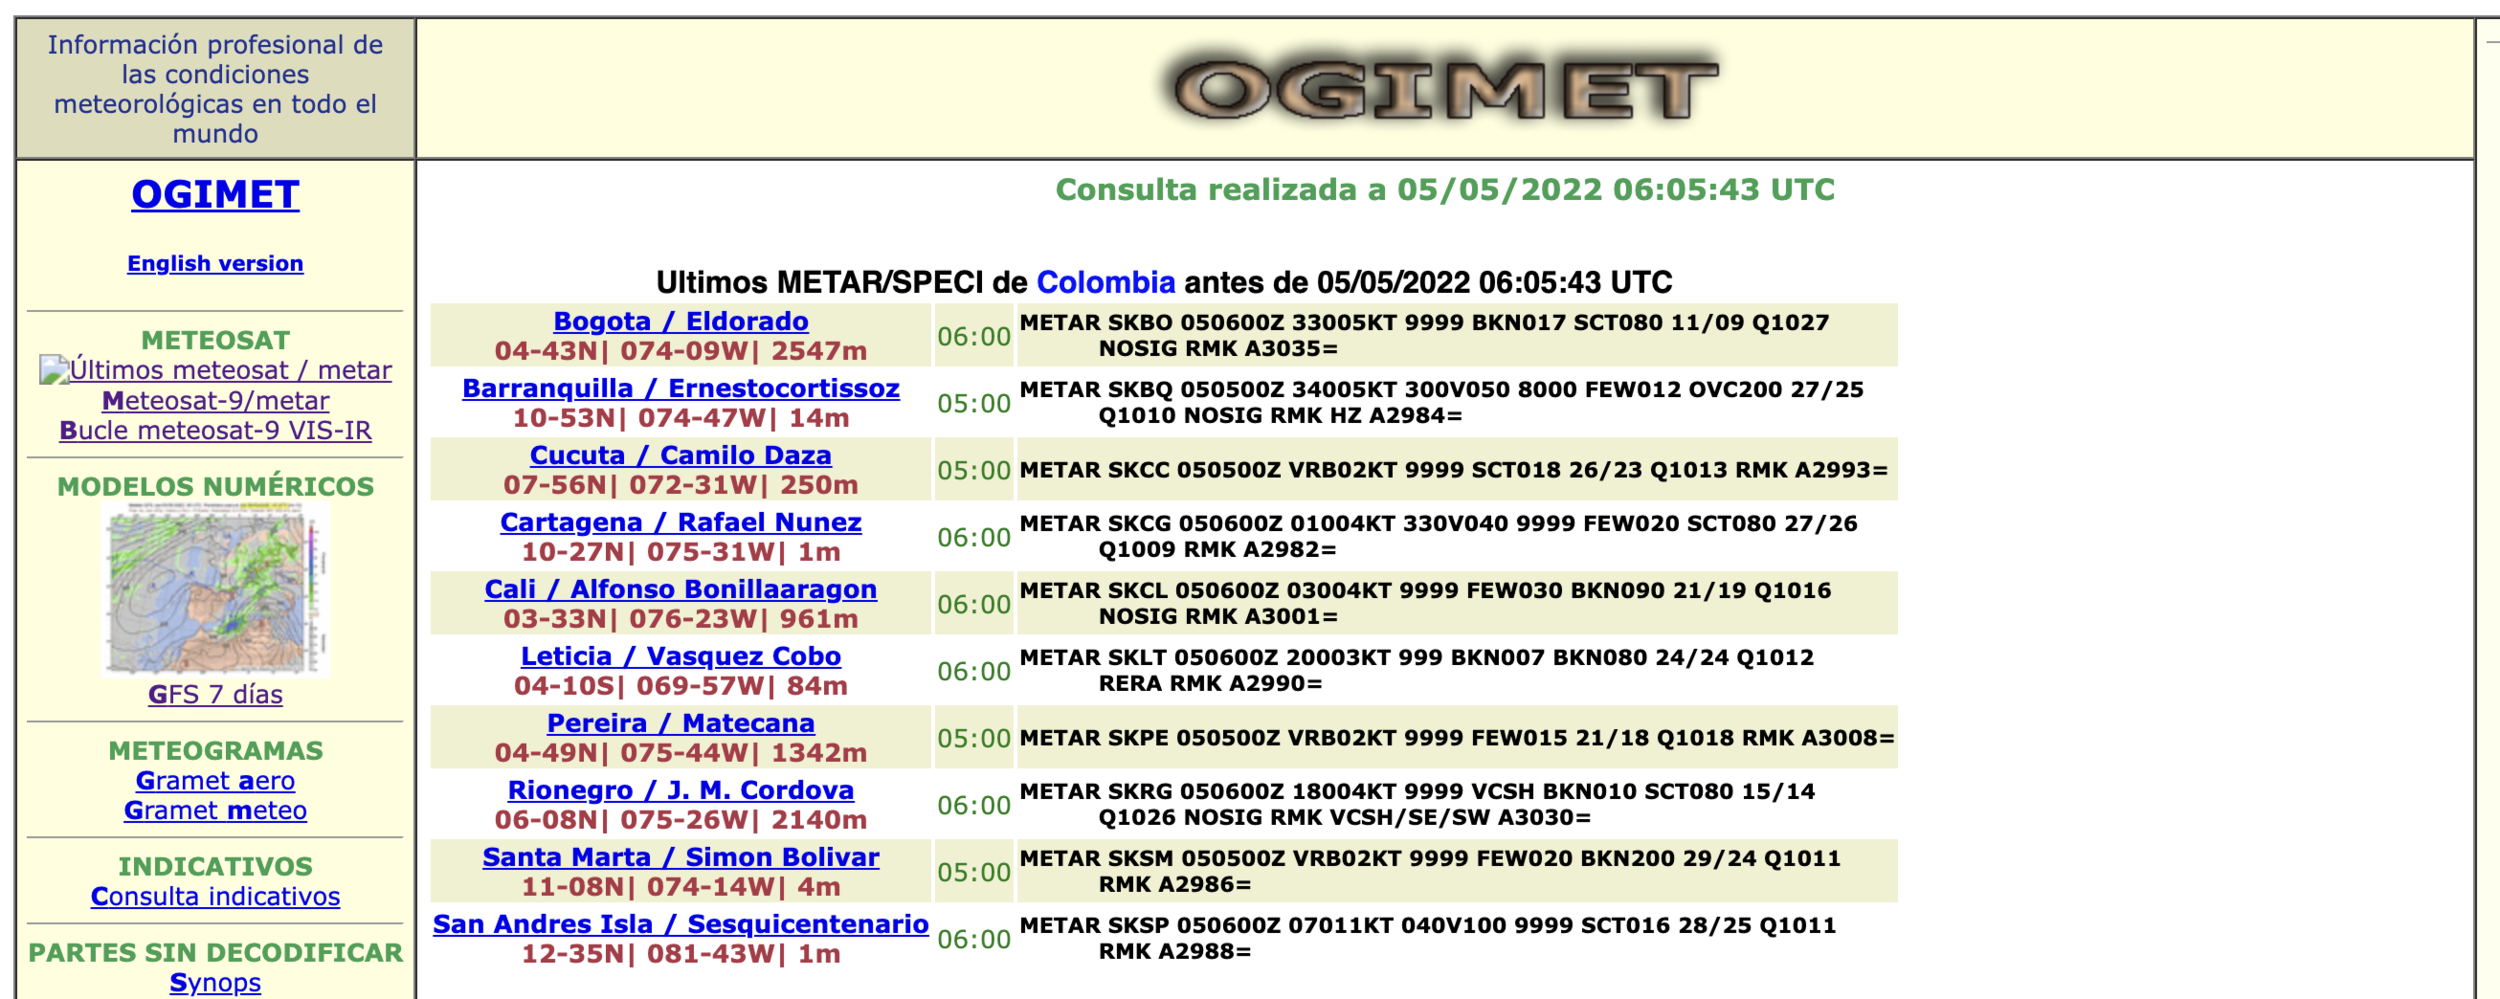
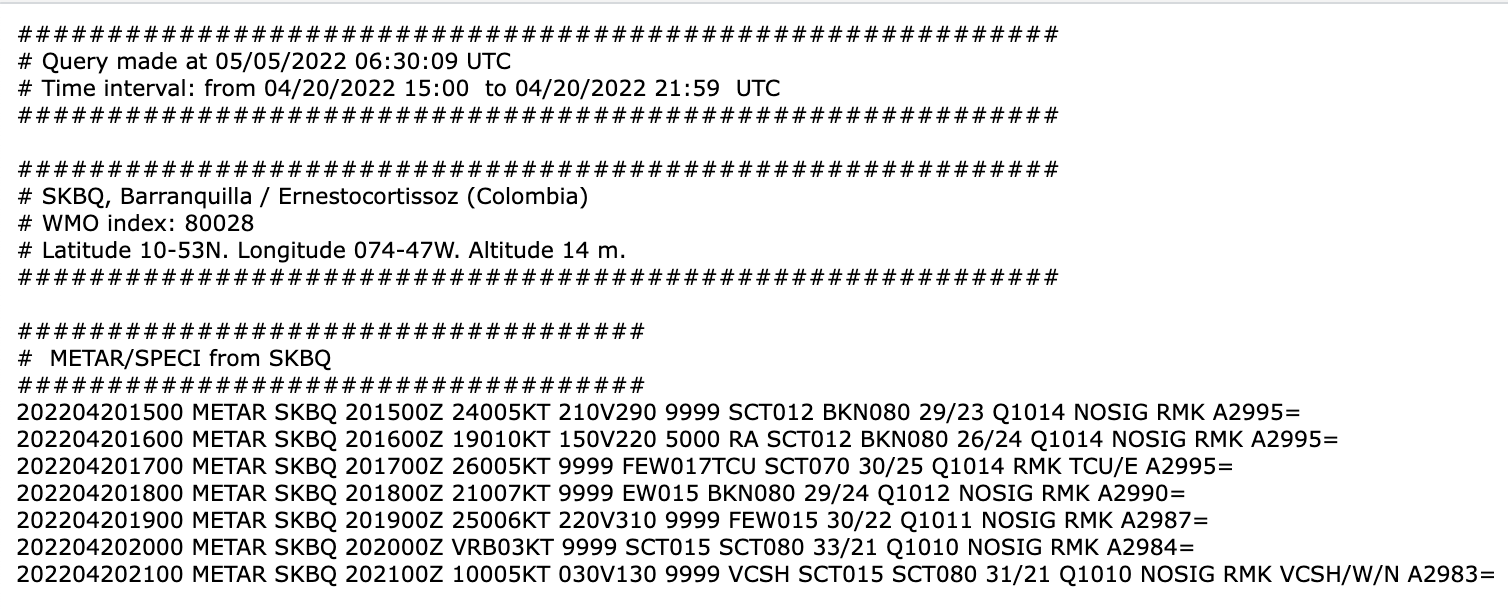
2. Downloading METAR reports
Fetch Input data
2. Downloading METAR reports
def fetch(url):
try:
html = urlopen(url).read()
soup = BeautifulSoup(html, features='html.parser')
for script in soup(["script", "style"]):
script.extract()
return soup
except Exception as e:
print(e)
return None
def fetch_metar_by_icao_and_date(icao, start_date, end_date):
url = f"https://www.ogimet.com/display_metars2.php?lang=en&lugar={icao}&tipo=SA&ord=DIR&nil=NO&fmt=txt"
url += '&ano={0:%Y}&mes={0:%m}&day={0:%d}&hora={0:%H}&min=00'.format(
start_date)
url += '&anof={0:%Y}&mesf={0:%m}&dayf={0:%d}&horaf={0:%H}&minf=59'.format(
end_date)
reporter.add({'ogimetUrl': url})
print(f"Fetching... {url}", flush=True)
soup = fetch(url)
data = []
if soup is None:
return data
text = soup.get_text()
if f"No hay METAR/SPECI de {icao} en el periodo solicitado" in text:
return data
text = re.sub('\s\s+', ' ', text)
matches = re.findall(r"\s(\d+)[\s]METAR\s(.*)=", text)
for match in matches:
if ',' not in match:
data.append({'datetime': datetime.strptime(
match[0], '%Y%m%d%H%M'), 'metar': match[1]})
return data
def parse_wind_components(obs):
u, v = wind_components(obs.wind_speed.value() *
units('knots'), obs.wind_dir.value() * units.degree)
return (u.to(units('m/s')).magnitude, v.to(units('m/s')).magnitude)
def get_variables(metar):
try:
obs = Metar.Metar(metar)
temp = obs.temp.value(units='K')
(uwind, vwind) = parse_wind_components(obs)
press = obs.press.value(units='HPA') * 100 # to Pa
return [temp, uwind, vwind, press]
except Exception as e:
return None
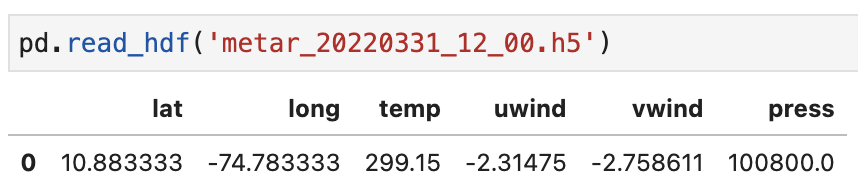
def save_hdf(date, station_coords, variables):
df = pd.DataFrame(data=[station_coords + variables.tolist()],
columns=['lat', 'long', 'temp', 'uwind', 'vwind', 'press'])
filename = 'metar_{0:%Y}{0:%m}{0:%d}_{0:%H}_00.h5'.format(date)
df.to_hdf(filename, key='df')
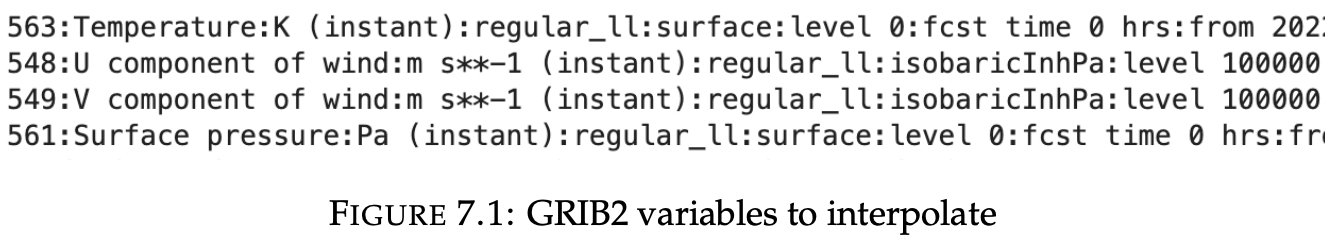
print(f"{filename} saved")Interpolation
- Modify the surface level data in GRIB2 file
- Run WPS (data fixed to nearest grid point)
- Single point for the MVP
New GRIB2 file
Taken from here
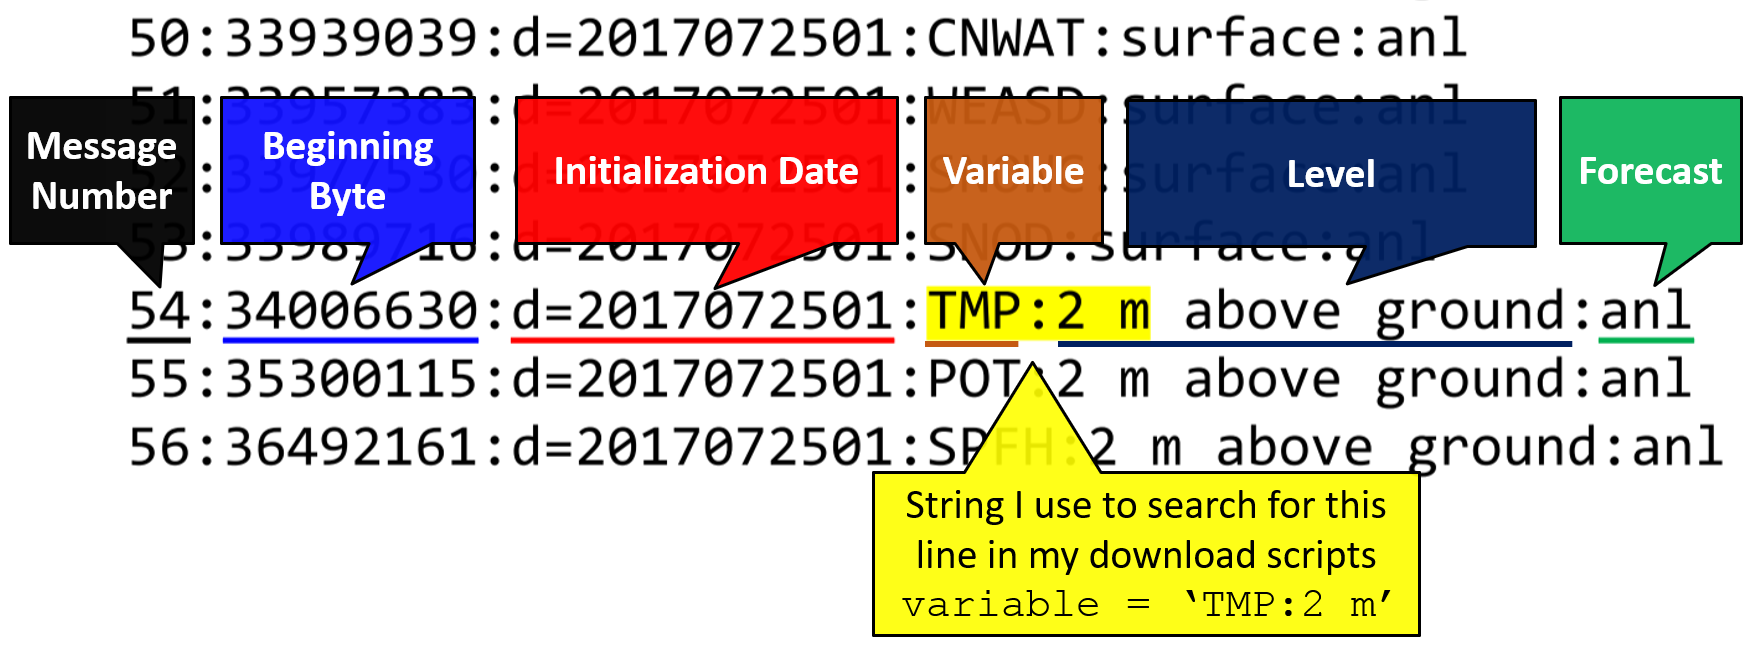
Interpolation
Variable + pressure level = message number
def update_message_value(grb, metar_value):
    lats, lons = grb.latlons()

    (i, i_j) = get_indexes_by_coord(lats, station_coords[0], threshold=1)
    (j_i, j) = get_indexes_by_coord(lons, station_coords[1], threshold=0.1)

    n_temp = np.array(grb.values, copy=True)
    n_temp[i, j] = metar_value
    grb['values'] = n_temp

    return grb.tostring()

def load_metar(grbs, filename):
    metar = pd.read_hdf(filename)

    surface_temp = grbs.select(name='Temperature')[41]
    surface_uwind = grbs.select(name='U component of wind')[41]
    surface_vwind = grbs.select(name='V component of wind')[41]
    surface_press = grbs.select(name='Surface pressure')[0]

    metar_data_by_messagenumber = {
        surface_temp.messagenumber: metar.temp,
        surface_uwind.messagenumber: metar.uwind,
        surface_vwind.messagenumber: metar.vwind,
        surface_press.messagenumber: metar.press
    }

return metar_data_by_messagenumberRunning WPS
If the execution is successful, symbolic links are created for the NetCDF files (met_em*) in the WRF execution directory.
run-wps "$START_DATE" "$END_DATE" -i 3 --data-dir ./gfs-dataSLURM Job
- minimum radius decomposition value + domain size = 64 cores (MPI)
- cpu- per-task = 1
- Job priority = TOP
- Maximum run time = 0.5h > 0.288 hours (1035.5505 s)

SLURM Job
#!/bin/bash

#SBATCH --job-name=wrf-baq-0.5km
#SBATCH --nodes=1
#SBATCH --ntasks=72
#SBATCH --cpus-per-task=1
#SBATCH --time=00:30:00
#SBATCH --account=syseng
#SBATCH --partition=syseng
#SBATCH -o slurm.out.log
#SBATCH -e slurm.err.log
#SBATCH --priority=TOP

module load autotools prun/1.3 gnu8/8.3.0 openmpi3/3.1.4 ohpc miniconda wrf/4.3-baq-0.5km

python3 $BIN_DIR/run_wrf.py "$START_DATE" "$END_DATE" -i 3 -n 8 --srun --only-real
python3 $BIN_DIR/run_wrf.py "$START_DATE" "$END_DATE" -i 3 -n 64 --srun --only-wrf --output $WRF_OUTPUT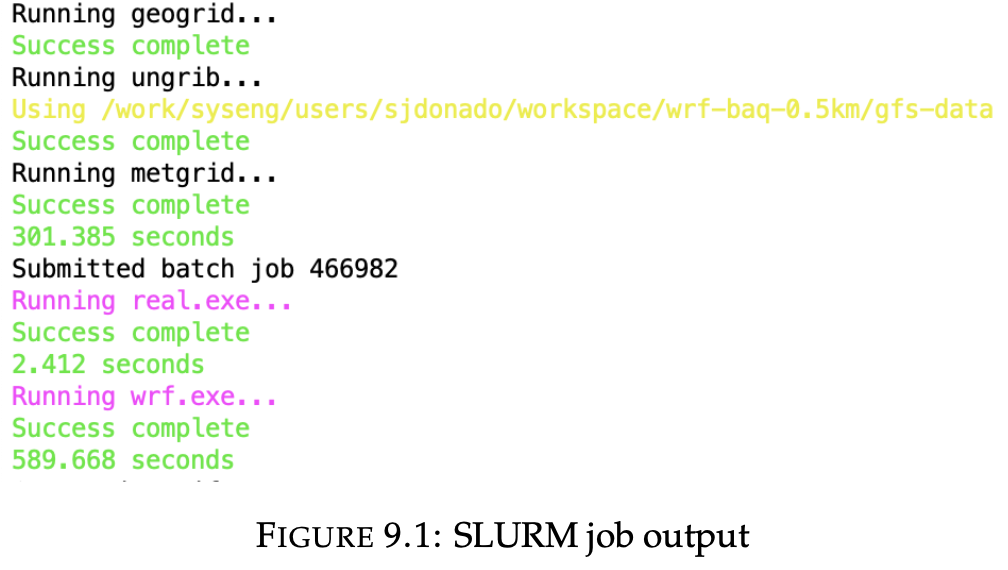
Output visualization
NetCDF file
- netCDF4 library
- python-wrf library
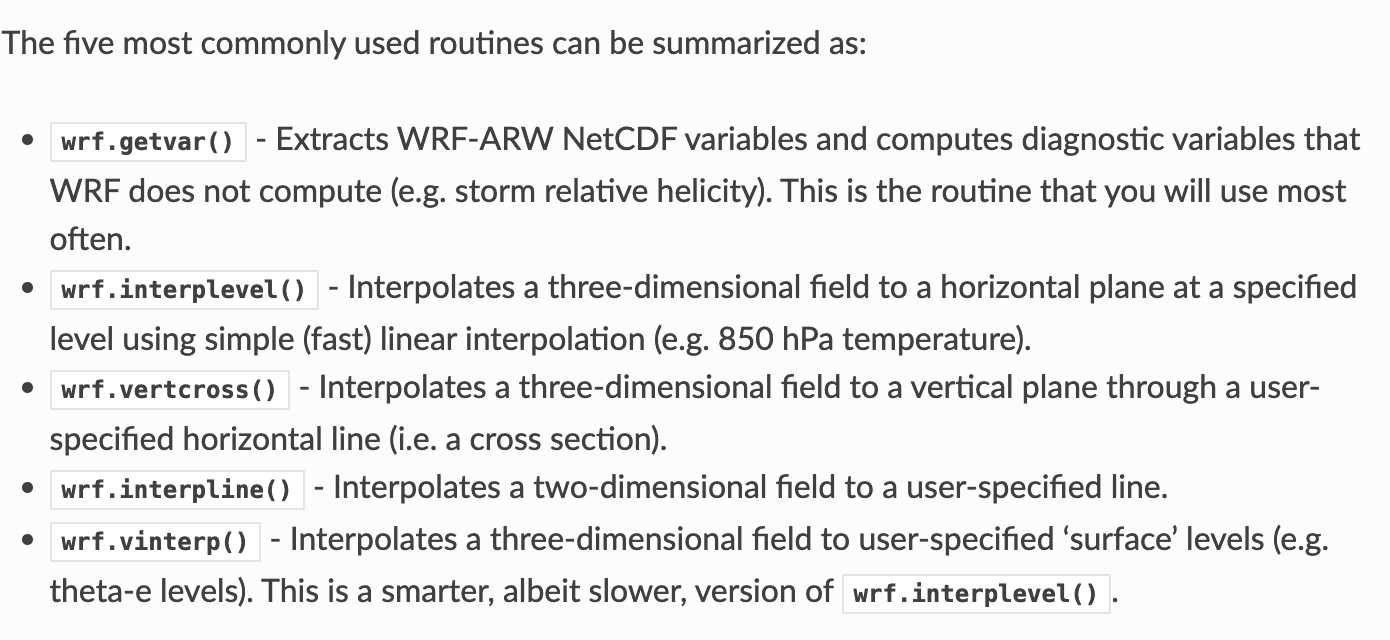
- desiredlev = 150
- timeidx = 0 will return the first 3h of the simulation
- interplevel -> NaN?
{
Output visualization
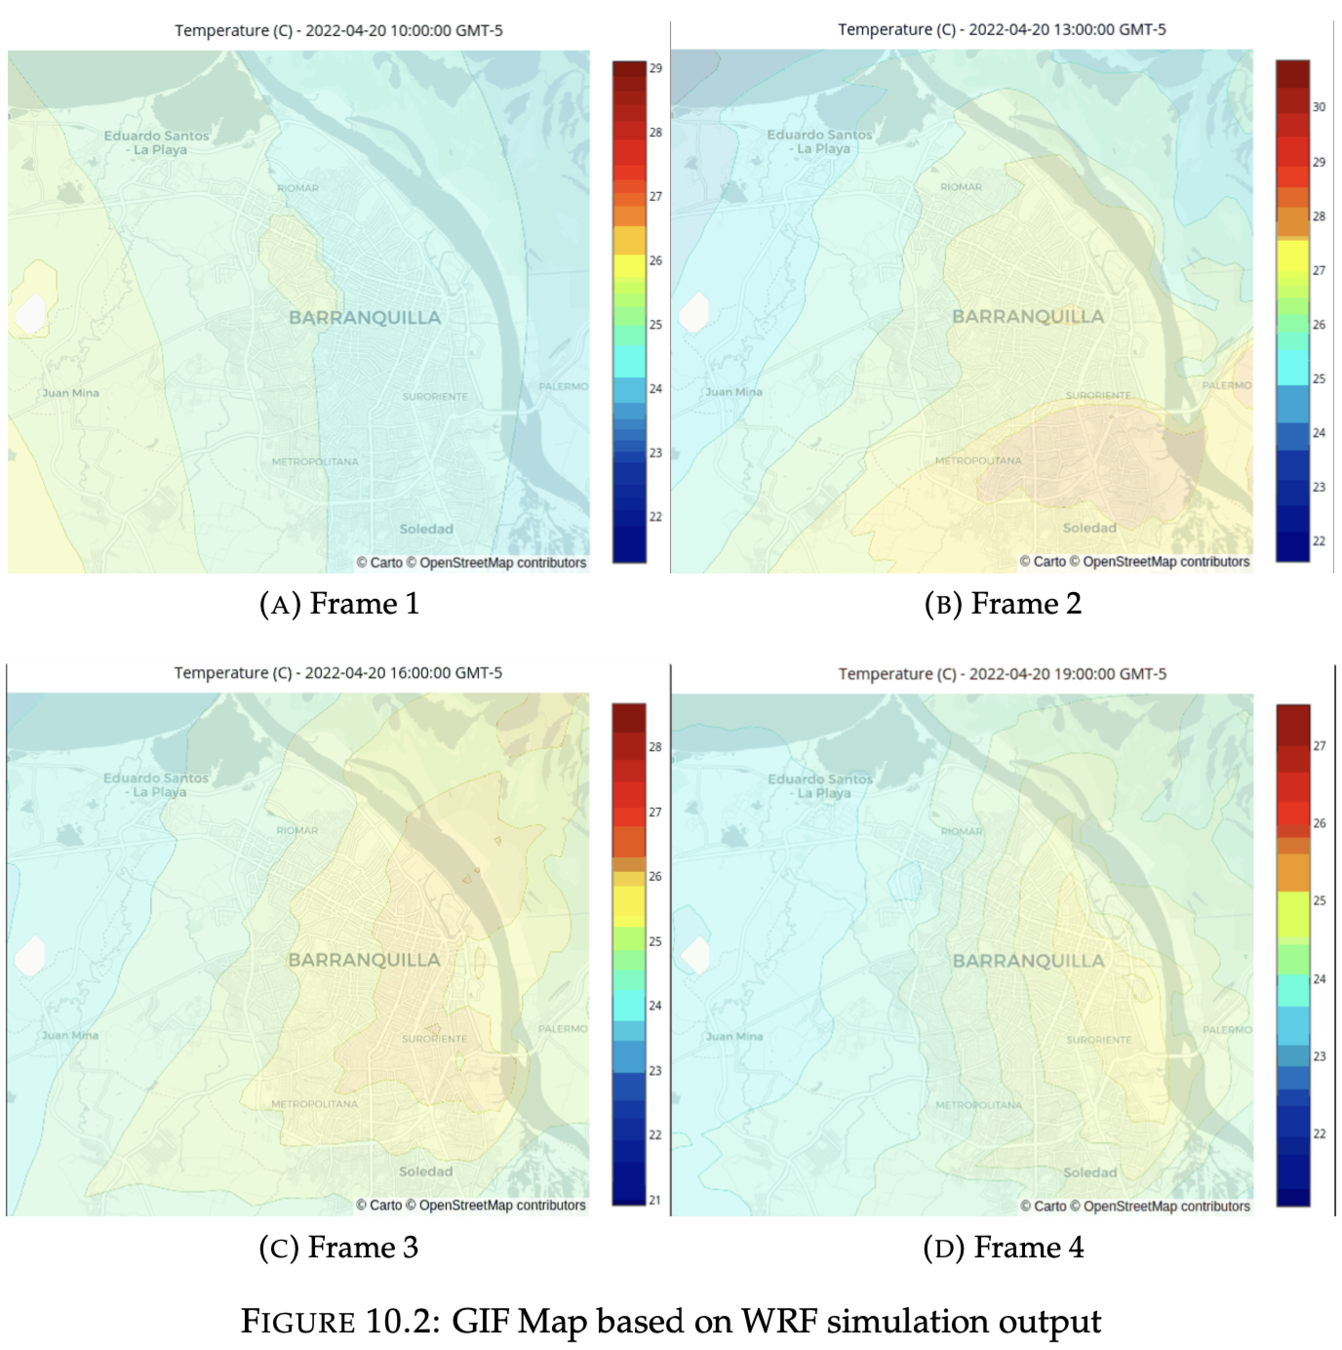
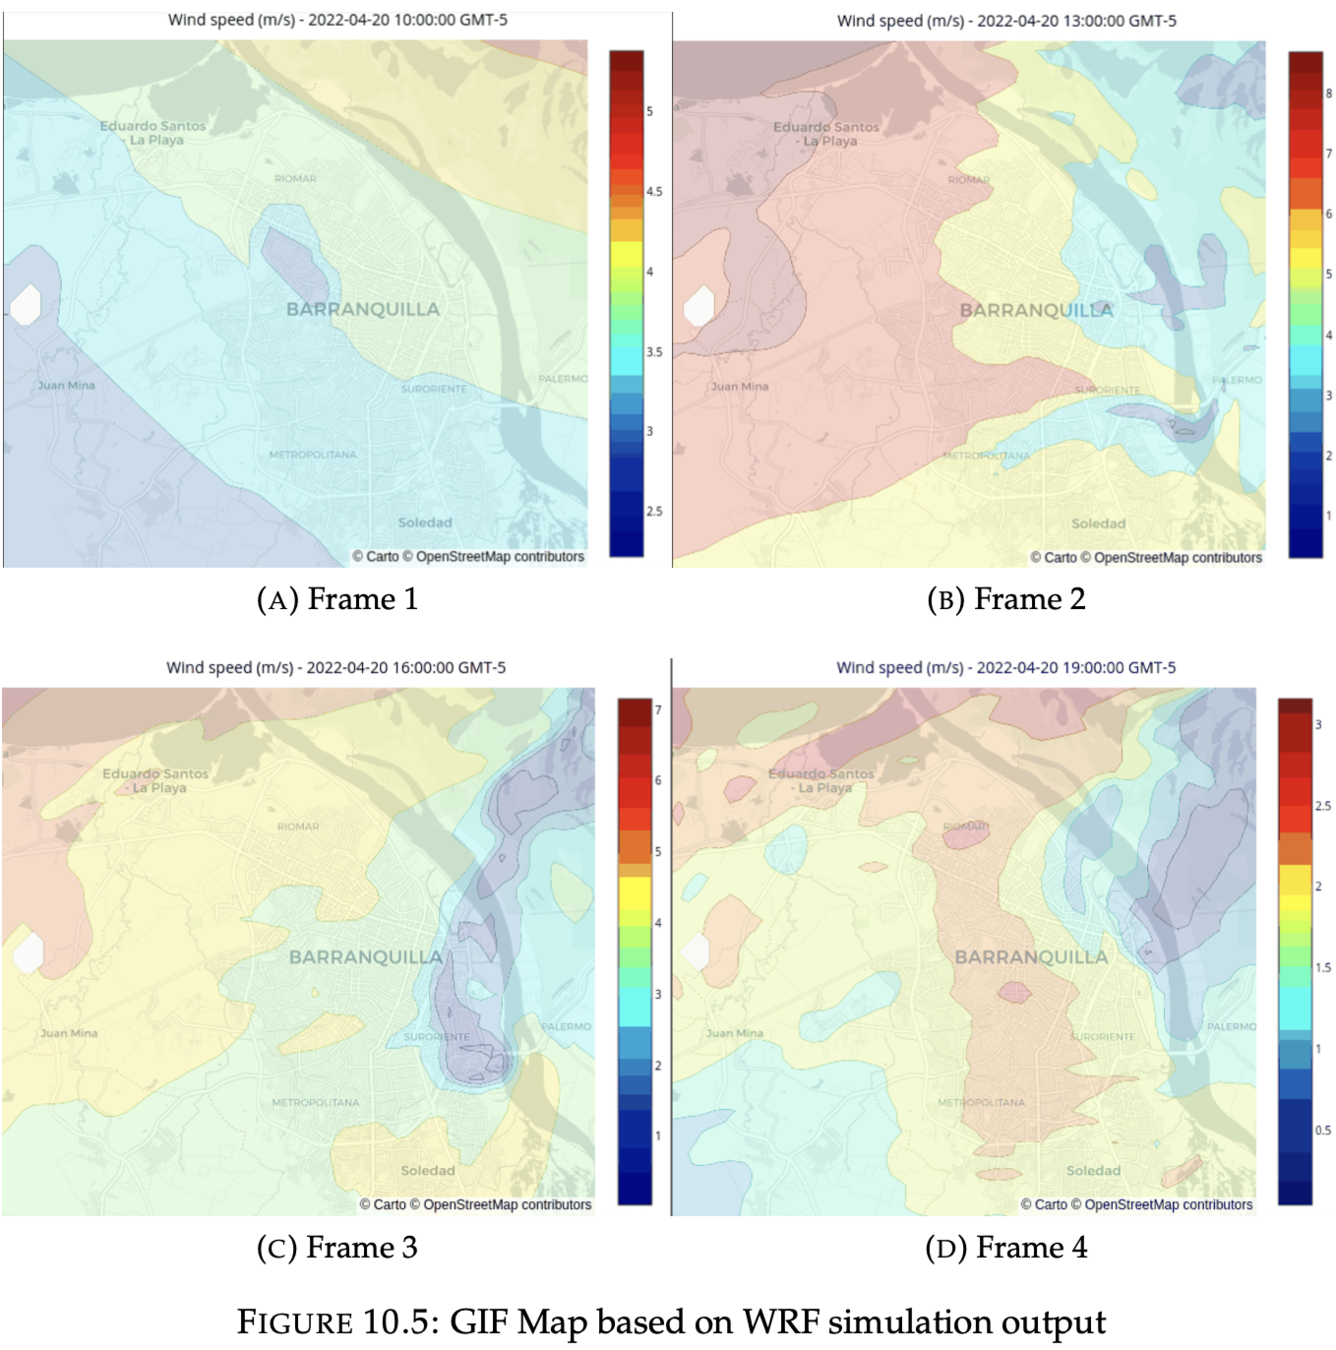
1. GIF animation
#!/usr/bin/env python3
import os
import re
import imageio
import json
from pathlib import Path
from datetime import datetime, timedelta
import geojsoncontour
import numpy as np
import pandas as pd
import wrf
from netCDF4 import Dataset as NetCDFFile
import folium
import plotly.graph_objects as go
import matplotlib.pyplot as plt
import branca.colormap as cm
from shapely.geometry import shape, Point
nc_file = NetCDFFile('./wrf_output')
time_size = nc_file.dimensions['Time'].size
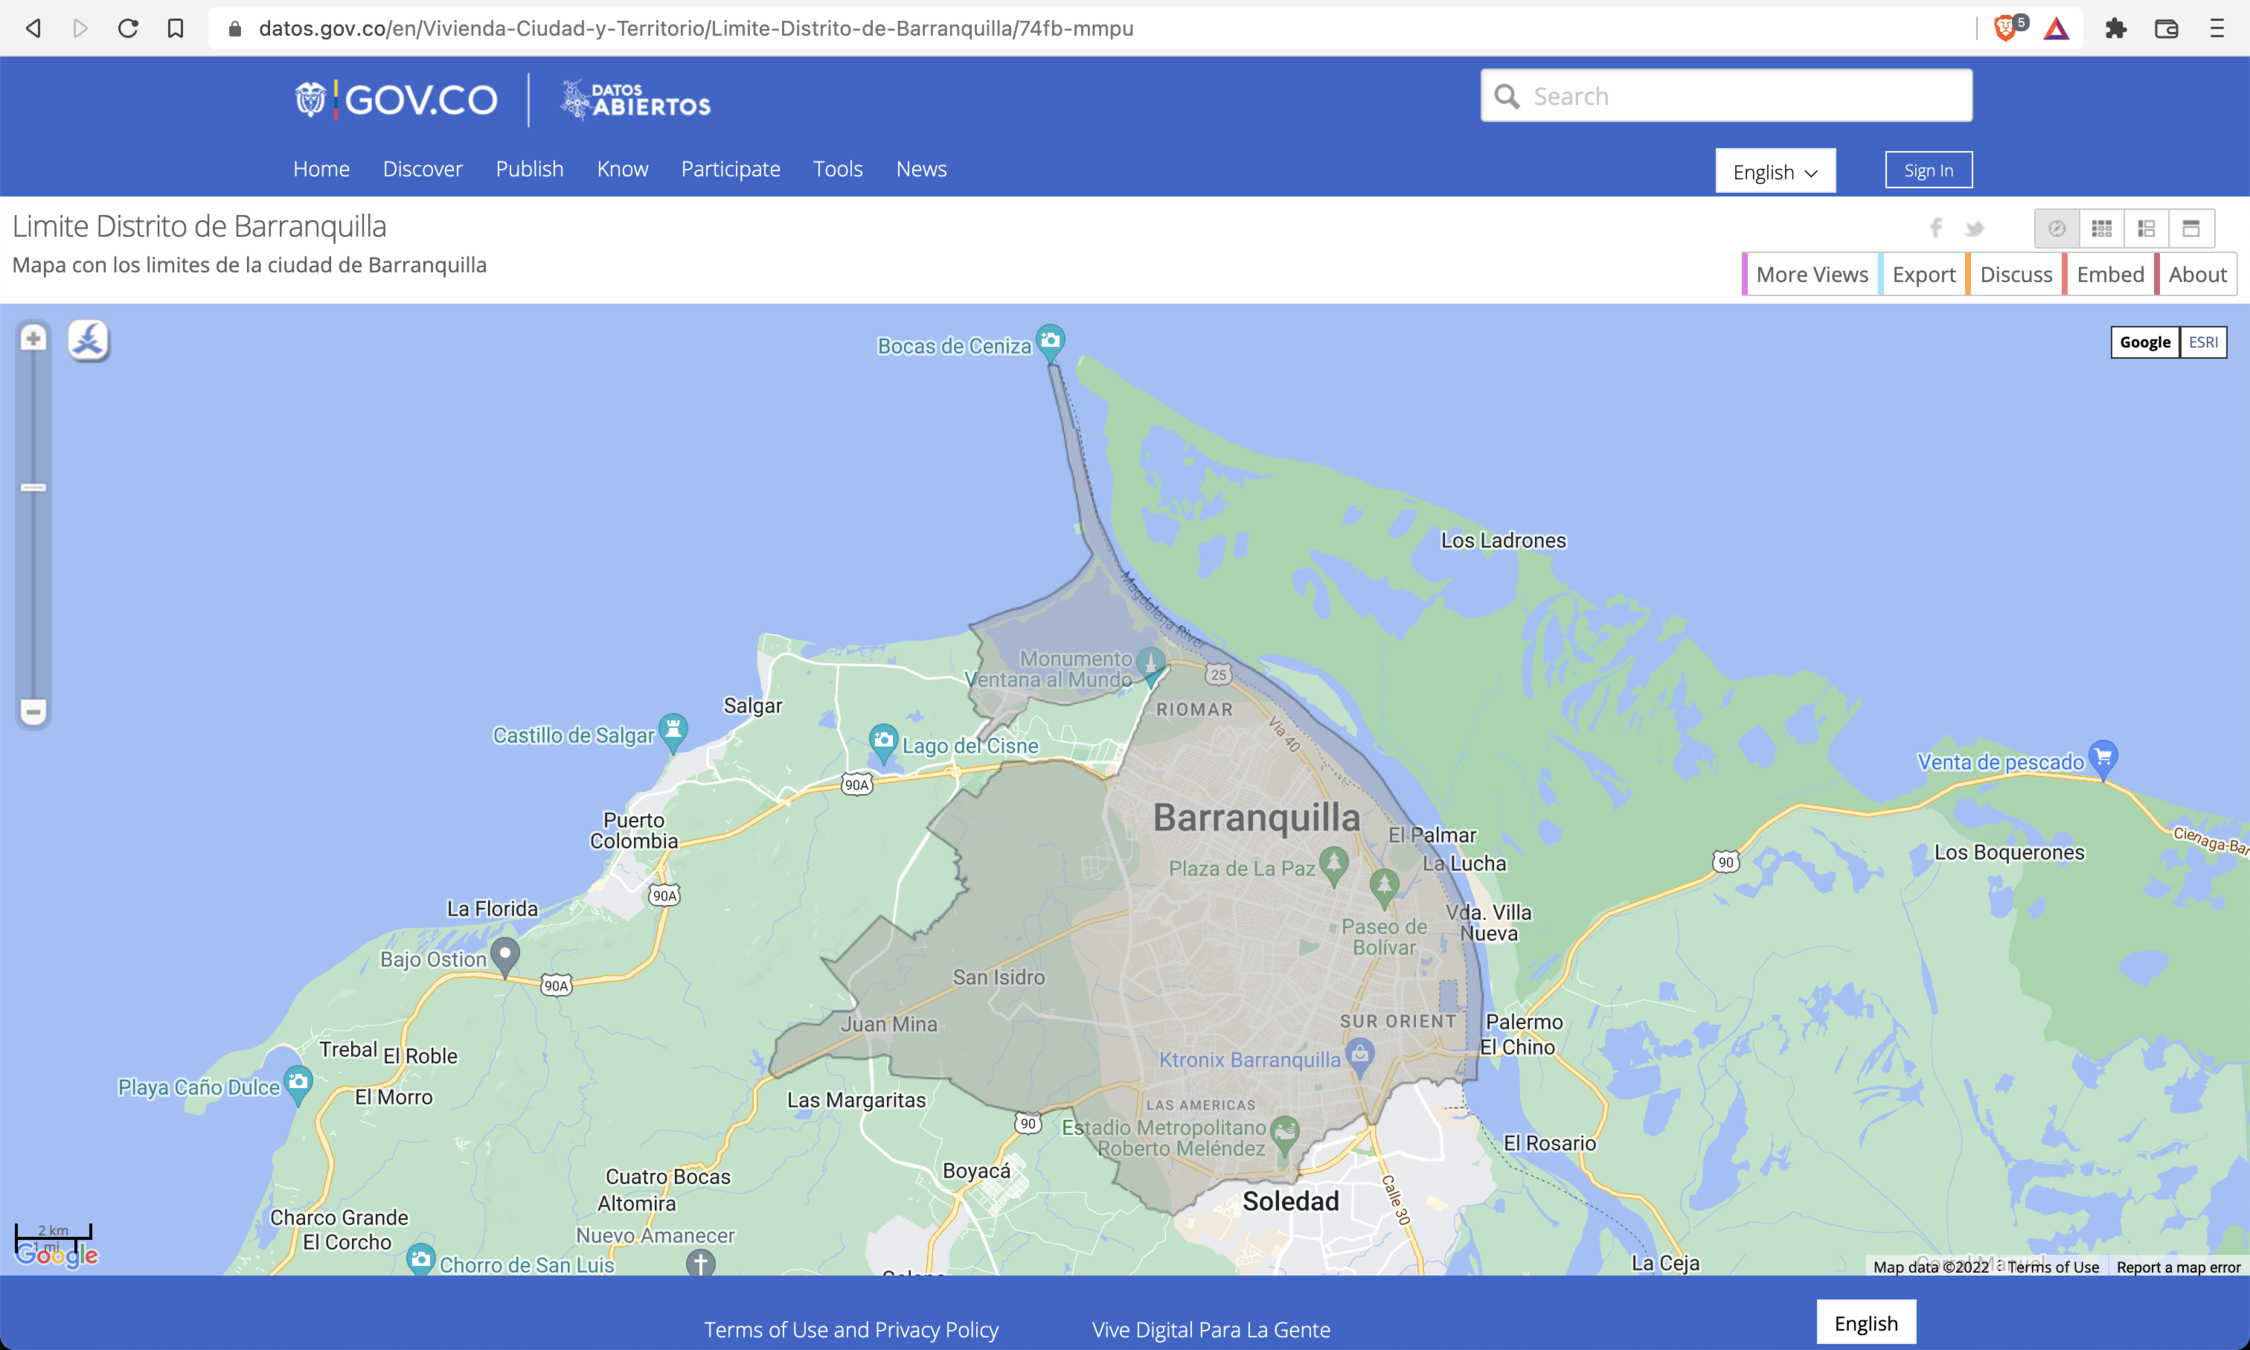
with open('./Limite Distrito de Barranquilla.geojson') as f:
baq_geojson = json.load(f)
baq_polygon = shape(baq_geojson['features'][0]['geometry'])
def get_data(nc_file: NetCDFFile, timeidx: int):
desiredlev = 150
height = wrf.getvar(nc_file, 'height', timeidx=timeidx)
u_all = wrf.getvar(nc_file, 'ua', timeidx=timeidx)
v_all = wrf.getvar(nc_file, 'va', timeidx=timeidx)
T_all = wrf.getvar(nc_file, 'tc', timeidx=timeidx)
P_all = wrf.getvar(nc_file, 'pressure', timeidx=timeidx)
pw = wrf.getvar(nc_file, 'pw', timeidx=timeidx)
P = wrf.interplevel(P_all, height, desiredlev)
T = wrf.interplevel(T_all, height, desiredlev)
u = wrf.interplevel(u_all, height, desiredlev)
v = wrf.interplevel(v_all, height, desiredlev)
data = {
'pwater': ('Precipitable Water (kg/m2)', pw),
'temp': ('Temperature (C)', T),
'wind': ('Wind speed (m/s)', np.sqrt(u ** 2 + v ** 2)),
'uwind': ('U wind speed (m/s)', u),
'vwind': ('V wind speed (m/s)', v),
'press': ('Pressure (hPa)', P)
}
return data
def geojson_title_to_float(title):
result = re.search(
r"([-]?([0-9]*[.])?[0-9]+)-([-]?([0-9]*[.])?[0-9]+)", title)
groups = result.groups()
value = np.median([float(groups[0]), float(groups[2])])
return value
def gj_to_df(gj):
gj_data = np.zeros([len(gj['features']), 2])
for i in range(len(gj['features'])):
gj['features'][i]['id'] = i
gj_data[i, 0] = i
gj_data[i, 1] = geojson_title_to_float(
gj['features'][i]['properties']['title'])
df = pd.DataFrame(gj_data, columns=['id', 'variable'])
return df
def build_gif_frame(lats, lons, caption, variable, date):
contour = plt.contourf(lons, lats, variable, cmap=plt.cm.jet)
gj = json.loads(geojsoncontour.contourf_to_geojson(
contourf=contour, ndigits=4, unit='m'))
df_contour = gj_to_df(gj)
zmin = df_contour.variable.min() - df_contour.variable.median() / 10
zmax = df_contour.variable.max() + df_contour.variable.median() / 10
trace = go.Choroplethmapbox(
geojson=gj,
locations=df_contour.id,
z=df_contour.variable,
zmin=zmin,
zmax=zmax,
colorscale='jet',
marker_line_width=0.1,
marker=dict(opacity=0.2)
)
layout = go.Layout(
title=f"{caption} - {date} GMT-5",
title_x=0.5,
width=600,
margin=dict(t=26, b=0, l=0, r=0),
font=dict(color='black', size=10),
mapbox=dict(
center=dict(
lat=lats.mean().item(0),
lon=lons.mean().item(0)
),
zoom=11,
style='carto-positron'
)
)
fig = go.Figure(data=[trace], layout=layout)
return fig
def get_image(timeidx: int, nc_var: str, start_date: datetime):
date = start_date + timedelta(hours=timeidx * time_size) - timedelta(hours=5)
data = get_data(nc_file, timeidx)
(caption, variable) = data[nc_var]
(lats, lons) = wrf.latlon_coords(variable)
fig = build_gif_frame(lats, lons, caption, variable, date)
png_file = f"{nc_var}_{timeidx}.png"
try:
fig.write_image(png_file)
except Exception:
return None
img = imageio.imread(png_file)
os.remove(png_file)
if timeidx == time_size - 1:
build_folium_map(lats, lons, caption, variable, date)
return img
def build_folium_map(lats, lons, caption, variable, start_date):
vmin = variable.min() - variable.median() / 10
vmax = variable.max() + variable.median() / 10
contour = plt.contourf(lons, lats, variable,
cmap=plt.cm.jet, vmin=vmin, vmax=vmax)
cbar = plt.colorbar(contour)
gj = json.loads(geojsoncontour.contourf_to_geojson(
contourf=contour, ndigits=4, unit='m'))
f_map = folium.Map(
location=[lats.mean(), lons.mean()],
tiles='Cartodb Positron',
zoom_start=12
)
folium.GeoJson(
gj,
style_function=lambda x: {
'color': x['properties']['stroke'],
'weight': x['properties']['stroke-width'],
'fillColor': x['properties']['fill'],
'opacity': 0.3
},
name='contour'
).add_to(f_map)
colormap = cm.LinearColormap(
colors=['darkblue', 'blue', 'cyan', 'green', 'greenyellow', 'yellow', 'orange', 'red', 'darkred'],
index=np.array(cbar.values),
vmin=cbar.values[0],
vmax=cbar.values[len(cbar.values) - 1],
caption=caption
)
f_map.add_child(colormap)
folium.GeoJson(
baq_geojson,
style_function=lambda x: {
'color': 'rgb(12, 131, 242)',
'fillColor': 'rgba(255, 0, 0, 0)'
},
name='baq_map'
).add_to(f_map)
var_geo_bounds = wrf.geo_bounds(variable)
for lat in np.arange(var_geo_bounds.bottom_left.lat, var_geo_bounds.top_right.lat, 0.01):
for lon in np.arange(var_geo_bounds.bottom_left.lon, var_geo_bounds.top_right.lon, 0.02):
if baq_polygon.contains(Point(lon, lat)):
x, y = wrf.ll_to_xy(nc_file, lat, lon)
value = round(variable[x.item(0), y.item(0)].values.item(0), 2)
folium.Marker(
location=[lat, lon],
popup=None,
icon=folium.DivIcon(
html=f"""<span style="font-size: 16px; color: yellow; -webkit-text-stroke: 1px black;">{value}</span>""")
).add_to(f_map)
f_map.get_root().html.add_child(folium.Element(
'<p style="text-align:center;font-size:14px;margin:4px">{} GMT-5</p>'.format(start_date)))
f_map.save(f"{nc_var}.html")
if __name__ == '__main__':
Path('output').mkdir(parents=True, exist_ok=True)
os.system('rm -f ./output/*.gif ./output/*.html')
os.chdir('./output')
start_date = datetime.strptime(
os.environ.get('START_DATE', None), '%Y-%m-%d %H')
nc_variables = os.environ.get('NC_VARIABLES', None).split(',')
for nc_var in nc_variables:
print(nc_var)
results = [get_image(timeidx, nc_var, start_date)
for timeidx in range(time_size)]
imageio.mimwrite(f"{nc_var}.gif", [
img for img in results if img is not None], fps=0.5)
print("Data saved in ./output")matplotlib.pyplot
geojsoncontour.contourf_to_geojson
plotly
zmin and zmax values normalized by 0.1 ∗ median
Output visualization
1. GIF animation
Output visualization
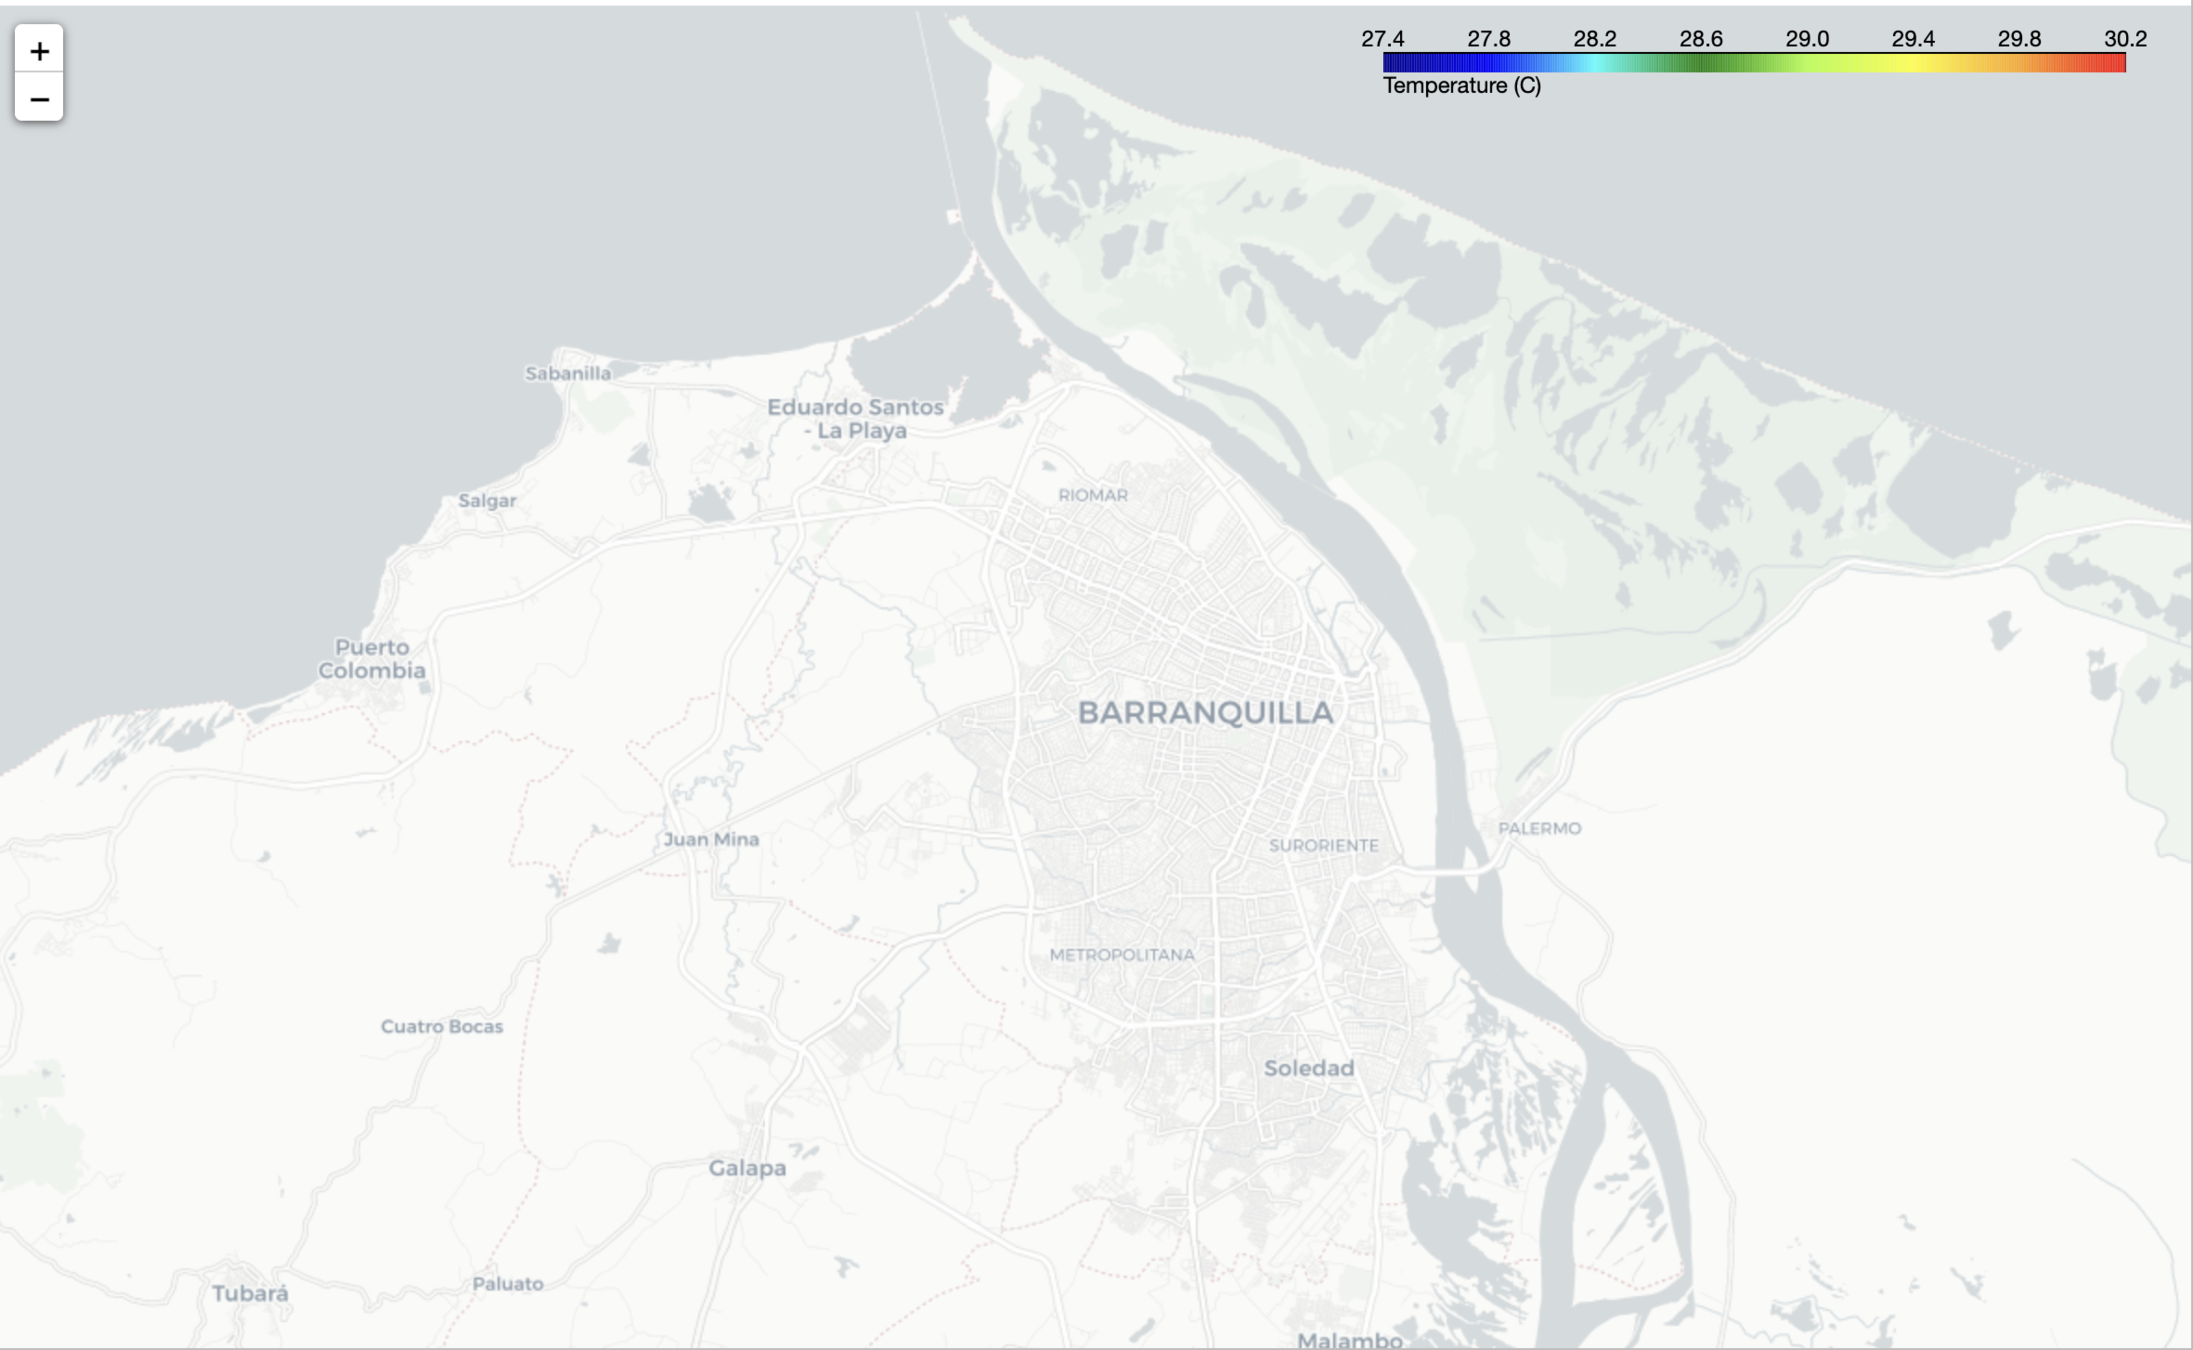
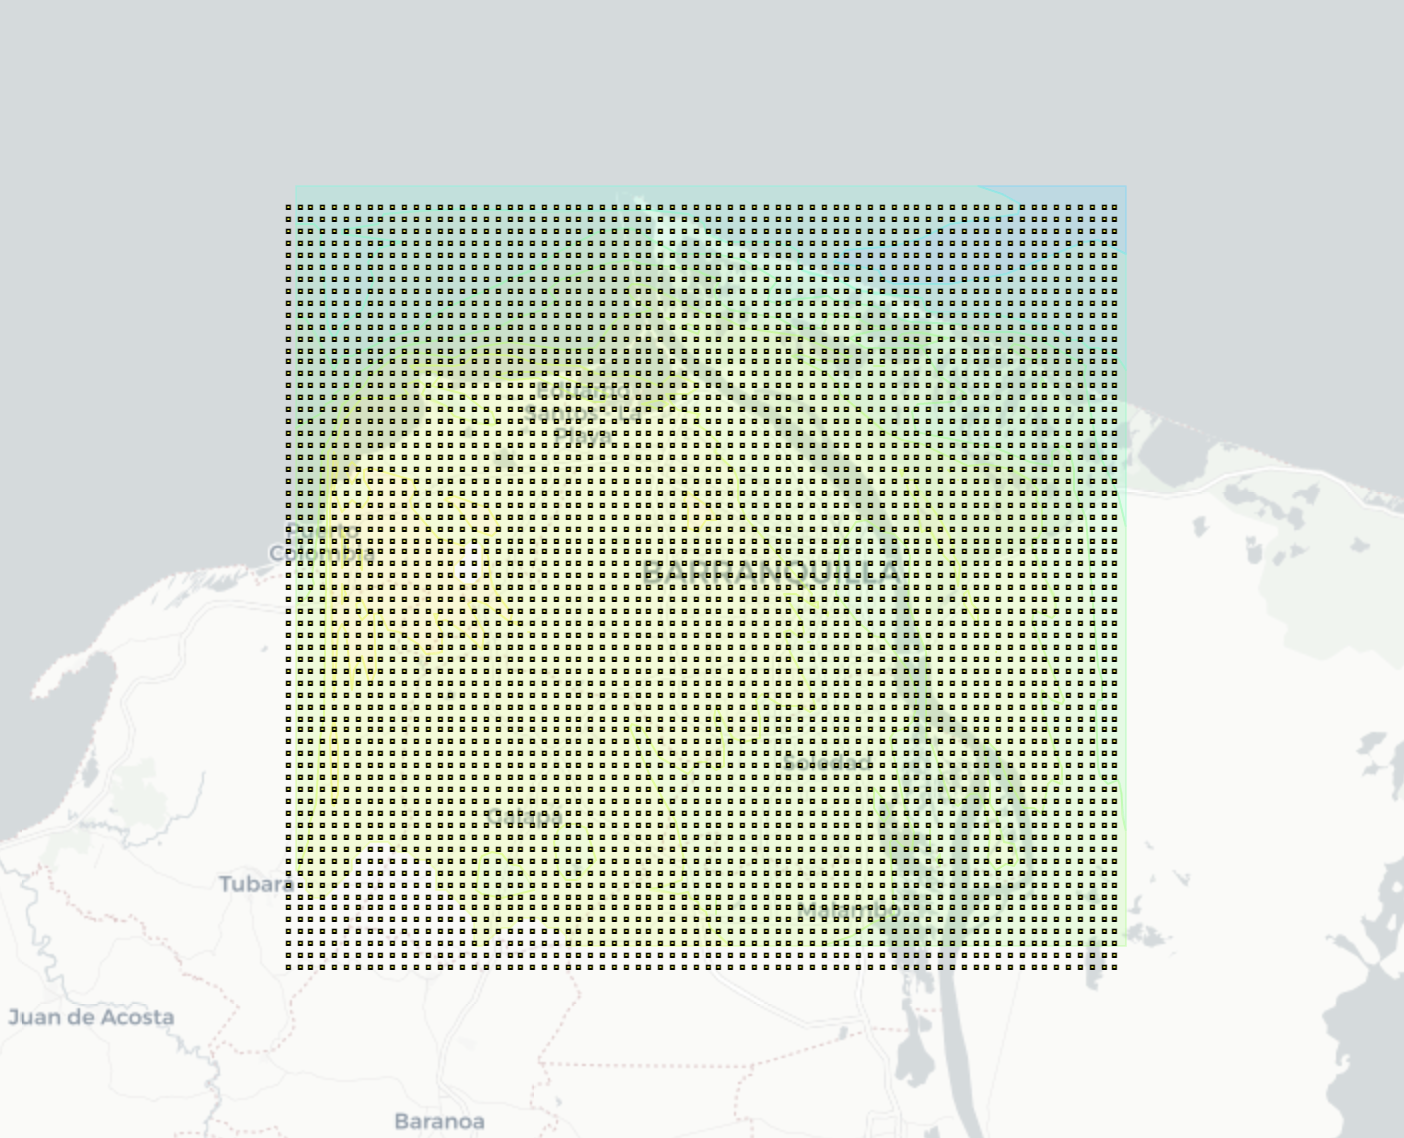
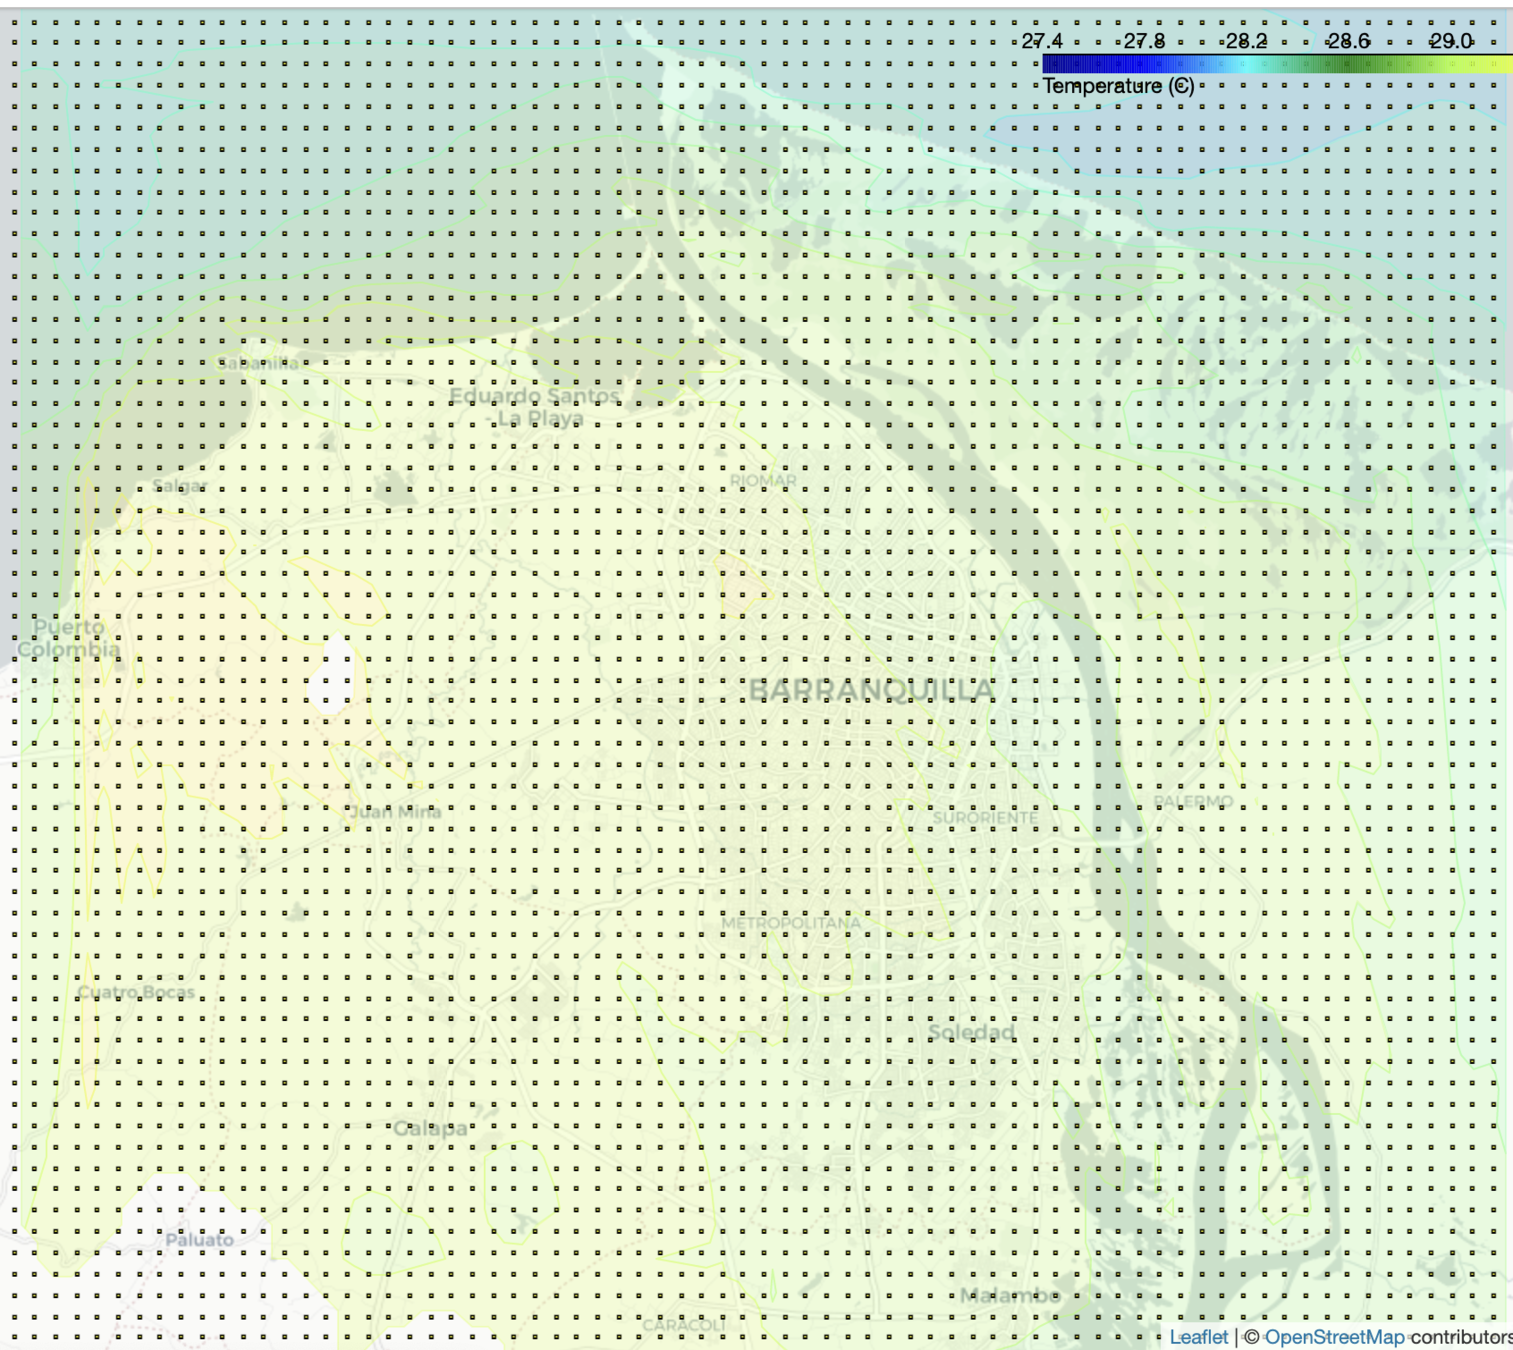
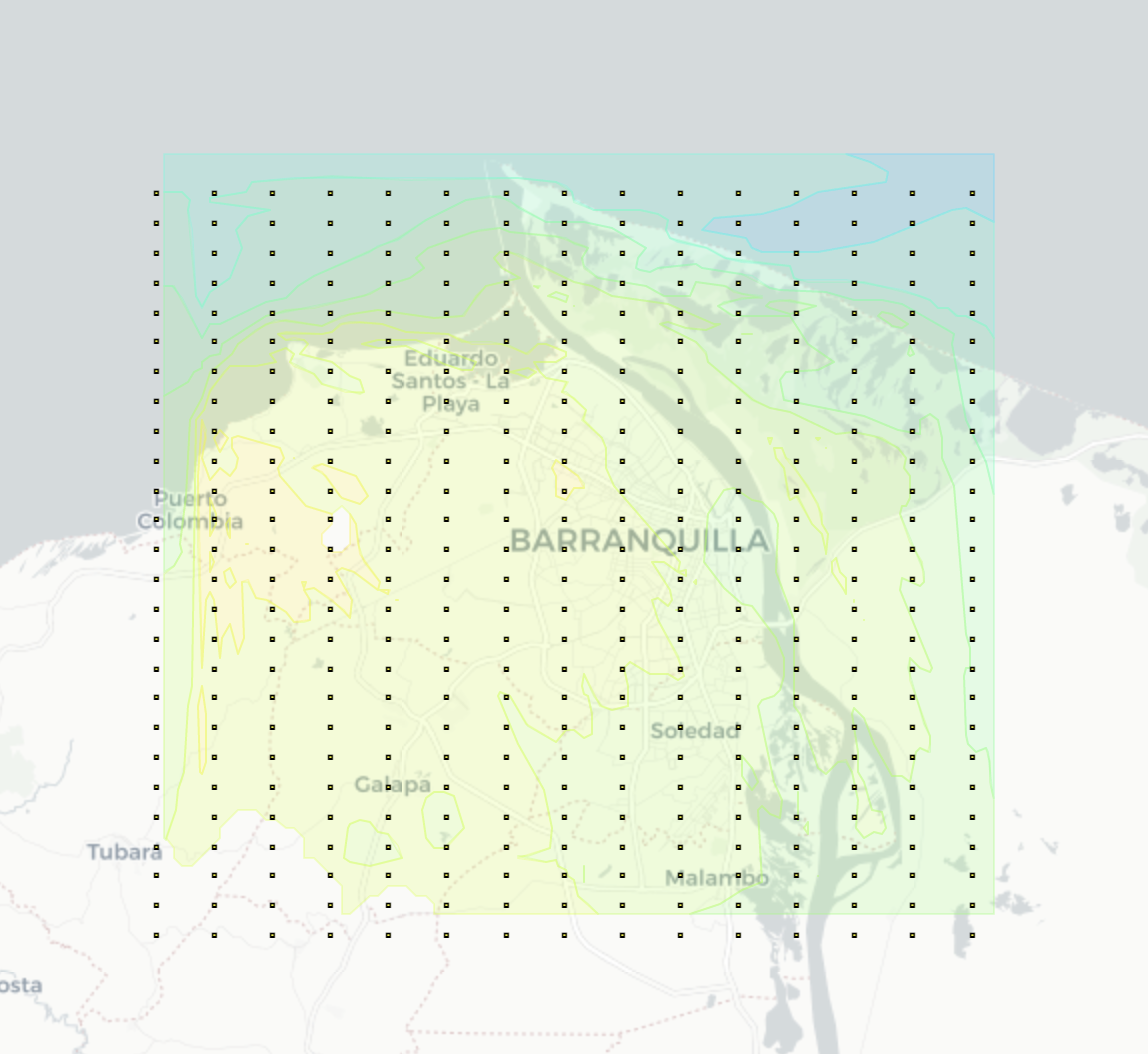
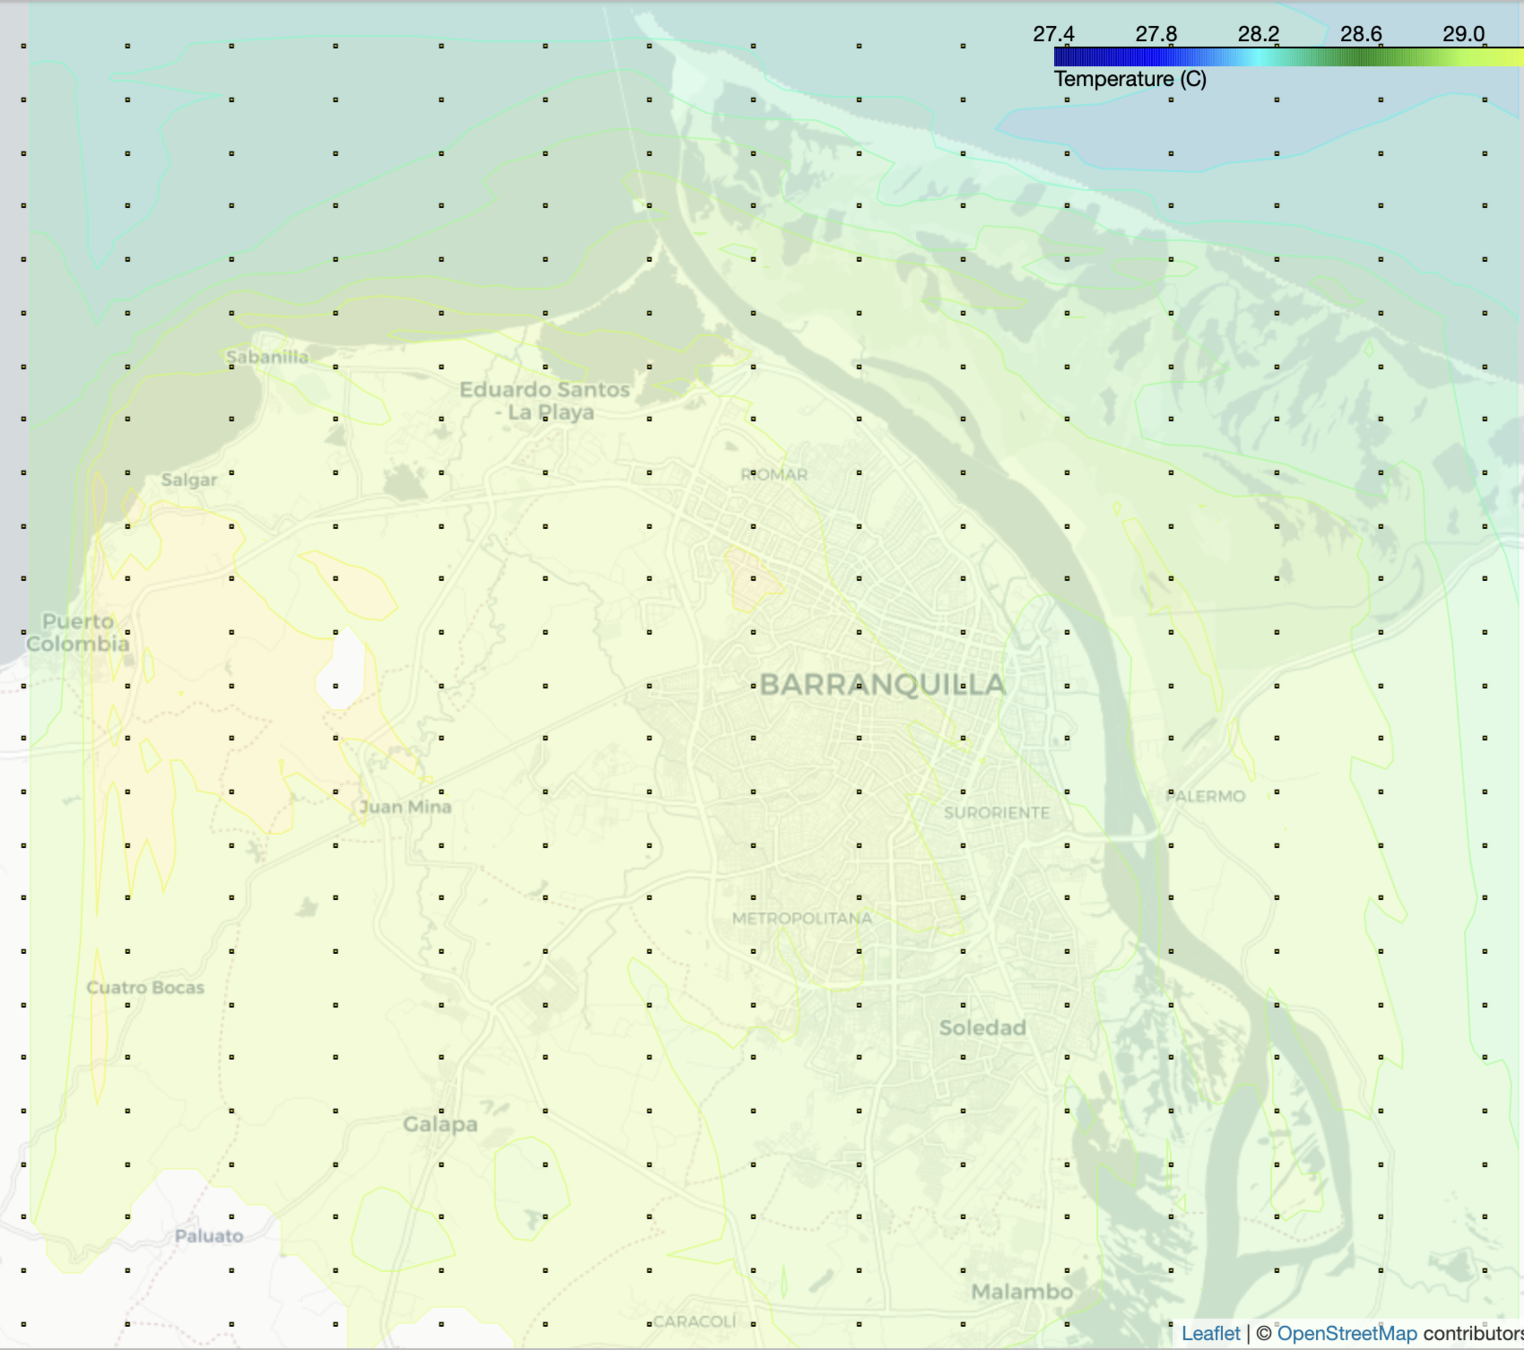
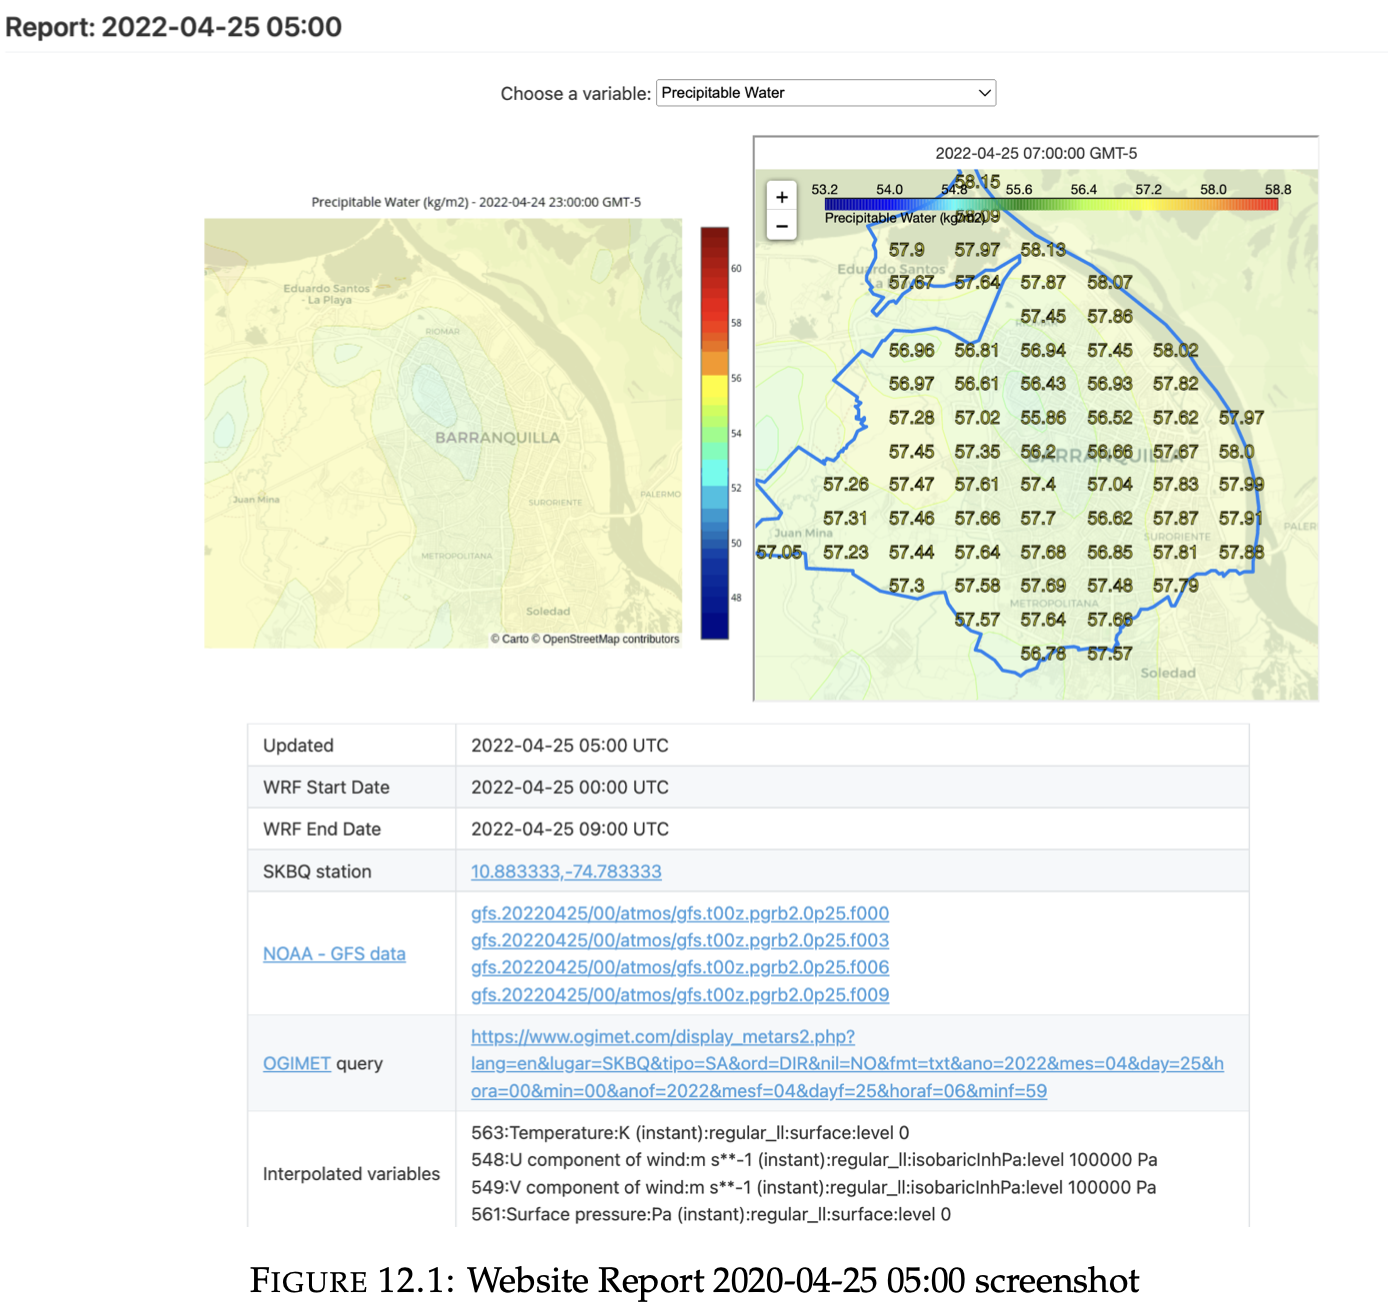
2. HTML Folium Map
- A detailed view of the values in the high resolution grid
- Linear search is performed in the matrix of points, whose complexity is n^2
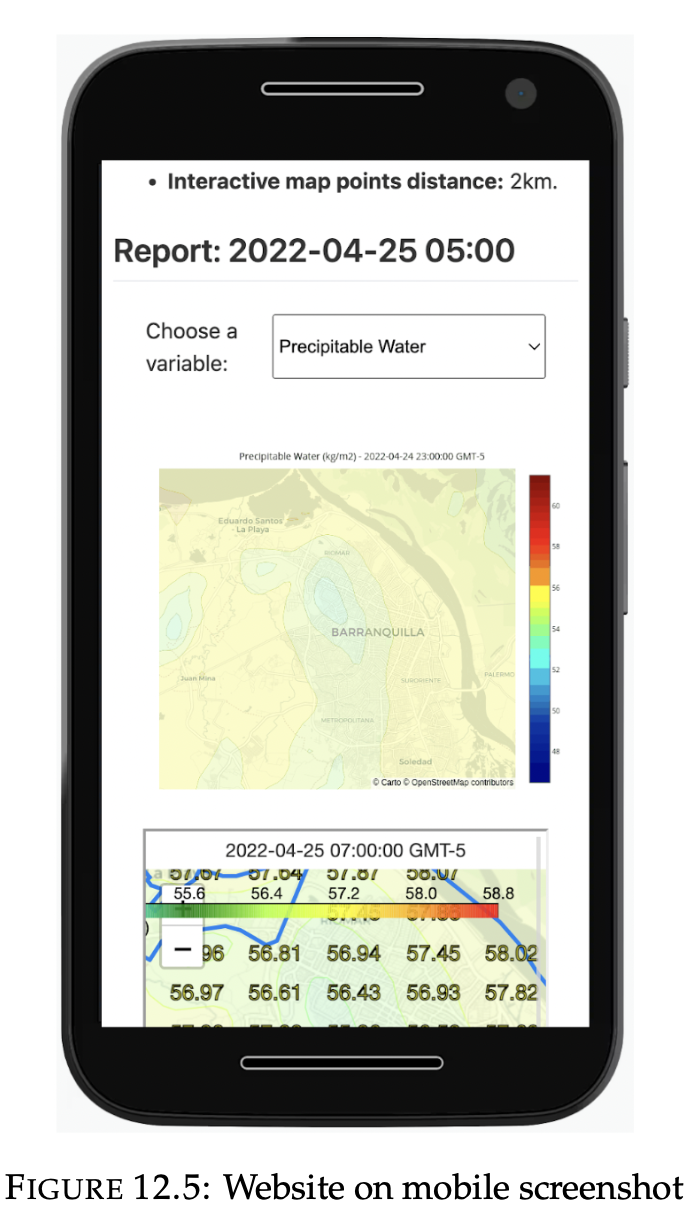
- New 26x15 grid -> 2km
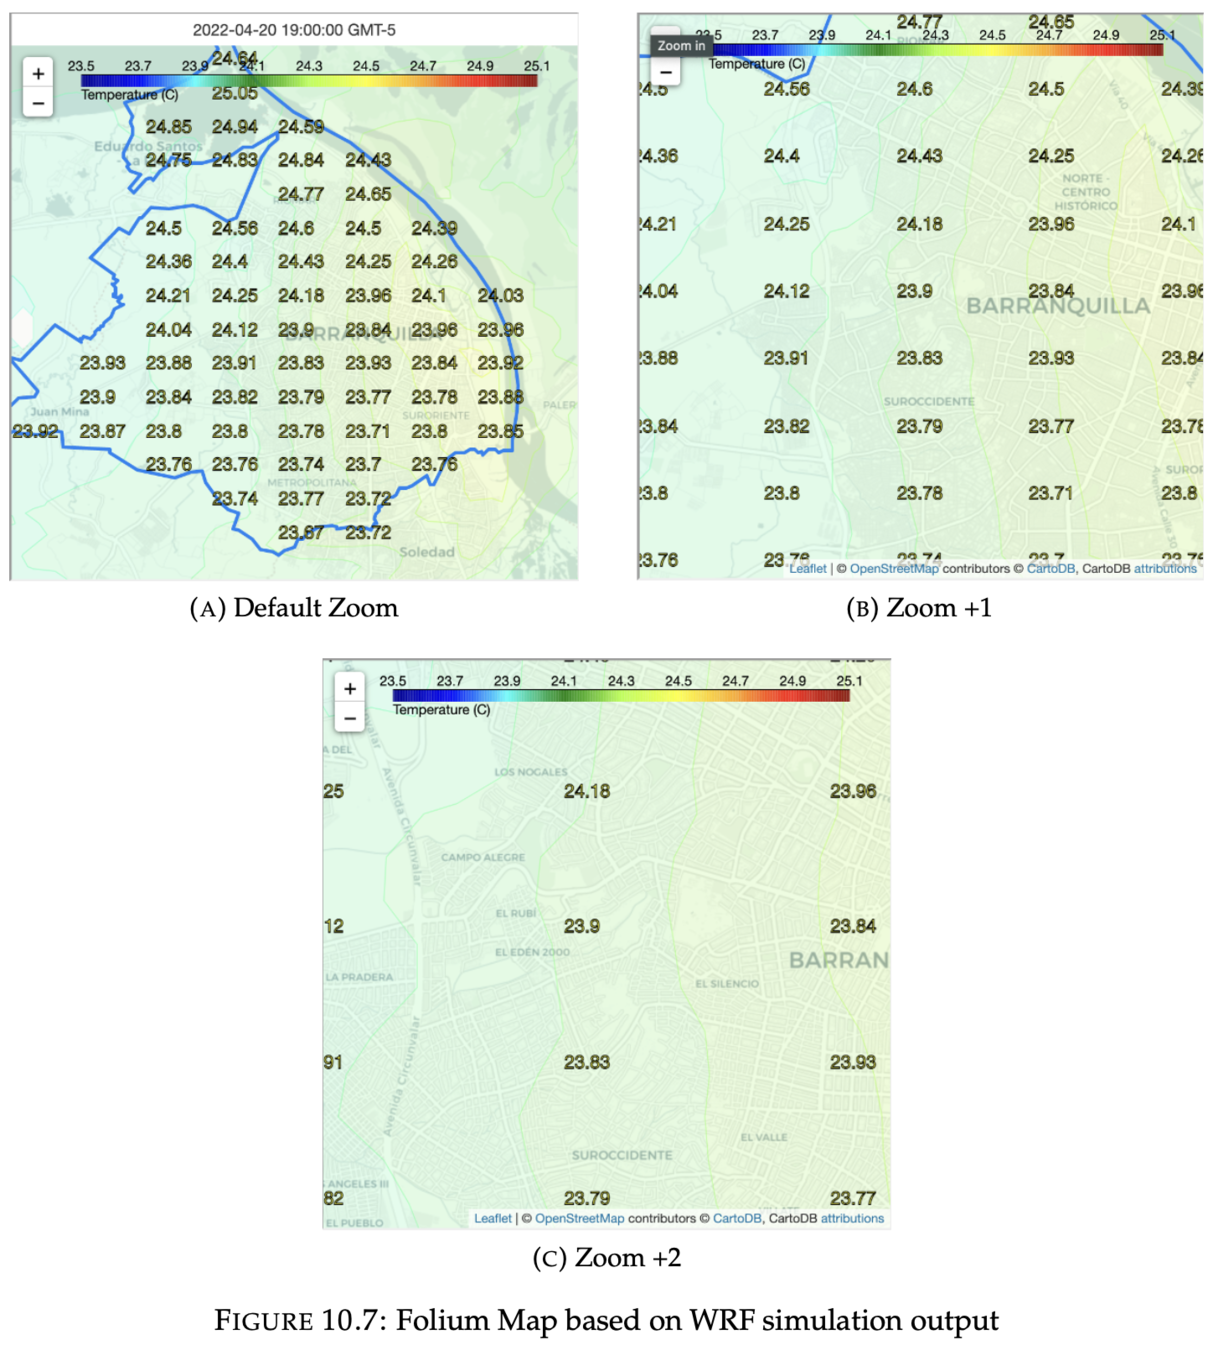
Output visualization
2. HTML Folium Map
Output visualization
2. HTML Folium Map
#!/usr/bin/env python3

import os
import re
import imageio
import json
from pathlib import Path
from datetime import datetime, timedelta

import geojsoncontour
import numpy as np
import pandas as pd

import wrf
from netCDF4 import Dataset as NetCDFFile

import folium
import plotly.graph_objects as go

import matplotlib.pyplot as plt
import branca.colormap as cm

from shapely.geometry import shape, Point

nc_file = NetCDFFile('./wrf_output')
time_size = nc_file.dimensions['Time'].size

with open('./Limite Distrito de Barranquilla.geojson') as f:
    baq_geojson = json.load(f)
    baq_polygon = shape(baq_geojson['features'][0]['geometry'])


def get_data(nc_file: NetCDFFile, timeidx: int):
    desiredlev = 150
    height = wrf.getvar(nc_file, 'height', timeidx=timeidx)

    u_all = wrf.getvar(nc_file, 'ua', timeidx=timeidx)
    v_all = wrf.getvar(nc_file, 'va', timeidx=timeidx)
    T_all = wrf.getvar(nc_file, 'tc', timeidx=timeidx)
    P_all = wrf.getvar(nc_file, 'pressure', timeidx=timeidx)
    pw = wrf.getvar(nc_file, 'pw', timeidx=timeidx)

    P = wrf.interplevel(P_all, height, desiredlev)
    T = wrf.interplevel(T_all, height, desiredlev)
    u = wrf.interplevel(u_all, height, desiredlev)
    v = wrf.interplevel(v_all, height, desiredlev)

    data = {
        'pwater': ('Precipitable Water (kg/m2)', pw),
        'temp': ('Temperature (C)', T),
        'wind': ('Wind speed (m/s)', np.sqrt(u ** 2 + v ** 2)),
        'uwind': ('U wind speed (m/s)', u),
        'vwind': ('V wind speed (m/s)', v),
        'press': ('Pressure (hPa)', P)
    }

    return data


def geojson_title_to_float(title):
    result = re.search(
        r"([-]?([0-9]*[.])?[0-9]+)-([-]?([0-9]*[.])?[0-9]+)", title)
    groups = result.groups()

    value = np.median([float(groups[0]), float(groups[2])])

    return value


def gj_to_df(gj):
    gj_data = np.zeros([len(gj['features']), 2])

    for i in range(len(gj['features'])):
        gj['features'][i]['id'] = i
        gj_data[i, 0] = i
        gj_data[i, 1] = geojson_title_to_float(
            gj['features'][i]['properties']['title'])

    df = pd.DataFrame(gj_data, columns=['id', 'variable'])

    return df


def build_gif_frame(lats, lons, caption, variable, date):
    contour = plt.contourf(lons, lats, variable, cmap=plt.cm.jet)

    gj = json.loads(geojsoncontour.contourf_to_geojson(
        contourf=contour, ndigits=4, unit='m'))
    df_contour = gj_to_df(gj)

    zmin = df_contour.variable.min() - df_contour.variable.median() / 10
    zmax = df_contour.variable.max() + df_contour.variable.median() / 10

    trace = go.Choroplethmapbox(
        geojson=gj,
        locations=df_contour.id,
        z=df_contour.variable,
        zmin=zmin,
        zmax=zmax,
        colorscale='jet',
        marker_line_width=0.1,
        marker=dict(opacity=0.2)
    )

    layout = go.Layout(
        title=f"{caption} - {date} GMT-5",
        title_x=0.5,
        width=600,
        margin=dict(t=26, b=0, l=0, r=0),
        font=dict(color='black', size=10),
        mapbox=dict(
            center=dict(
                lat=lats.mean().item(0),
                lon=lons.mean().item(0)
            ),
            zoom=11,
            style='carto-positron'
        )
    )

    fig = go.Figure(data=[trace], layout=layout)

    return fig


def get_image(timeidx: int, nc_var: str, start_date: datetime):
    date = start_date + timedelta(hours=timeidx * time_size) - timedelta(hours=5)

    data = get_data(nc_file, timeidx)

    (caption, variable) = data[nc_var]
    (lats, lons) = wrf.latlon_coords(variable)

    fig = build_gif_frame(lats, lons, caption, variable, date)

    png_file = f"{nc_var}_{timeidx}.png"
    try:
        fig.write_image(png_file)
    except Exception:
        return None

    img = imageio.imread(png_file)
    os.remove(png_file)

    if timeidx == time_size - 1:
        build_folium_map(lats, lons, caption, variable, date)

    return img


def build_folium_map(lats, lons, caption, variable, start_date):
    vmin = variable.min() - variable.median() / 10
    vmax = variable.max() + variable.median() / 10

    contour = plt.contourf(lons, lats, variable,
                           cmap=plt.cm.jet, vmin=vmin, vmax=vmax)
    cbar = plt.colorbar(contour)

    gj = json.loads(geojsoncontour.contourf_to_geojson(
        contourf=contour, ndigits=4, unit='m'))

    f_map = folium.Map(
        location=[lats.mean(), lons.mean()],
        tiles='Cartodb Positron',
        zoom_start=12
    )

    folium.GeoJson(
        gj,
        style_function=lambda x: {
            'color': x['properties']['stroke'],
            'weight': x['properties']['stroke-width'],
            'fillColor': x['properties']['fill'],
            'opacity': 0.3
        },
        name='contour'
    ).add_to(f_map)

    colormap = cm.LinearColormap(
        colors=['darkblue', 'blue', 'cyan', 'green', 'greenyellow', 'yellow', 'orange', 'red', 'darkred'],
        index=np.array(cbar.values),
        vmin=cbar.values[0],
        vmax=cbar.values[len(cbar.values) - 1],
        caption=caption
    )
    f_map.add_child(colormap)

    folium.GeoJson(
        baq_geojson,
        style_function=lambda x: {
            'color': 'rgb(12, 131, 242)',
            'fillColor': 'rgba(255, 0, 0, 0)'
        },
        name='baq_map'
    ).add_to(f_map)

    var_geo_bounds = wrf.geo_bounds(variable)
    for lat in np.arange(var_geo_bounds.bottom_left.lat, var_geo_bounds.top_right.lat, 0.01):
        for lon in np.arange(var_geo_bounds.bottom_left.lon, var_geo_bounds.top_right.lon, 0.02):
            if baq_polygon.contains(Point(lon, lat)):
                x, y = wrf.ll_to_xy(nc_file, lat, lon)
                value = round(variable[x.item(0), y.item(0)].values.item(0), 2)
                folium.Marker(
                    location=[lat, lon],
                    popup=None,
                    icon=folium.DivIcon(
                        html=f"""<span style="font-size: 16px; color: yellow; -webkit-text-stroke: 1px black;">{value}</span>""")
                ).add_to(f_map)

    f_map.get_root().html.add_child(folium.Element(
        '<p style="text-align:center;font-size:14px;margin:4px">{} GMT-5</p>'.format(start_date)))

    f_map.save(f"{nc_var}.html")


if __name__ == '__main__':
    Path('output').mkdir(parents=True, exist_ok=True)
    os.system('rm -f ./output/*.gif ./output/*.html')
    os.chdir('./output')

    start_date = datetime.strptime(
        os.environ.get('START_DATE', None), '%Y-%m-%d %H')
    nc_variables = os.environ.get('NC_VARIABLES', None).split(',')

    for nc_var in nc_variables:
        print(nc_var)
        results = [get_image(timeidx, nc_var, start_date)
                   for timeidx in range(time_size)]
        imageio.mimwrite(f"{nc_var}.gif", [
                         img for img in results if img is not None], fps=0.5)

print("Data saved in ./output")matplotlib.pyplot
geojsoncontour.contourf_to_geojson
folium
Output visualization
2. HTML Folium Map
Publish
#!/usr/bin/env sh

wait_file() {
  local file="$1"; shift
  local wait_seconds="${1:-1800}"; shift # 30 minutes as default timeout
  until test $((wait_seconds--)) -eq 0 -o -e "$file" ; do sleep 1; done
  ((++wait_seconds))
}

export WORK_DIR='/work/syseng/users/sjdonado/workspace/wrf-baq-0.5km'
cd $WORK_DIR

module load wrf/4.3-baq-0.5km miniconda

eval "$(conda shell.bash hook)"
conda activate wrf-baq-0.5km

rm -f ./output/*

echo "Setting up env variables..."
eval "$(./set_env_variables.py)"

echo "*** Debugging parameters ***"
echo "Created at: $CREATED_AT"
echo "Start date: $START_DATE"
echo "End date: $END_DATE"
echo "WRF interval hours: $WRF_INTERVAL_HOURS"
echo "WRF output: $WRF_OUTPUT"
echo "NOAA AWS Bucket: $NOAA_AWS_BUCKET"
echo "GFS Start date: $GFS_START_DATE"
echo "GFS Time offset: $GFS_TIME_OFFSET"
echo "GFS interval hours: $GFS_INTERVAL_HOURS"
echo "Ogimet Start Date: $OGIMET_START_DATE"
echo "Ogimet End Date: $OGIMET_END_DATE"
echo "NC variables: $NC_VARIABLES"
echo "BAQ station coordinates: $BAQ_STATION_COORDINATES"
echo "******"

./download_gfs_data.py
./fetch_ogimet_data.py
./ogimet_grib_interpolation.py

run-wps "$START_DATE" "$END_DATE" -i 3 --data-dir ./gfs-data

rm -f ./wrf_output
sbatch ./sbatch-run.sh

wait_file "./wrf_output" && {
  cat slurm.out.log

  echo "Generating gifs..."
  ./build_maps.py

  echo "Uploading to Github..."

  git pull
  git add output
  git commit -m "auto [$CREATED_AT]: BAQ 0.5km WRF output"
  git push
}
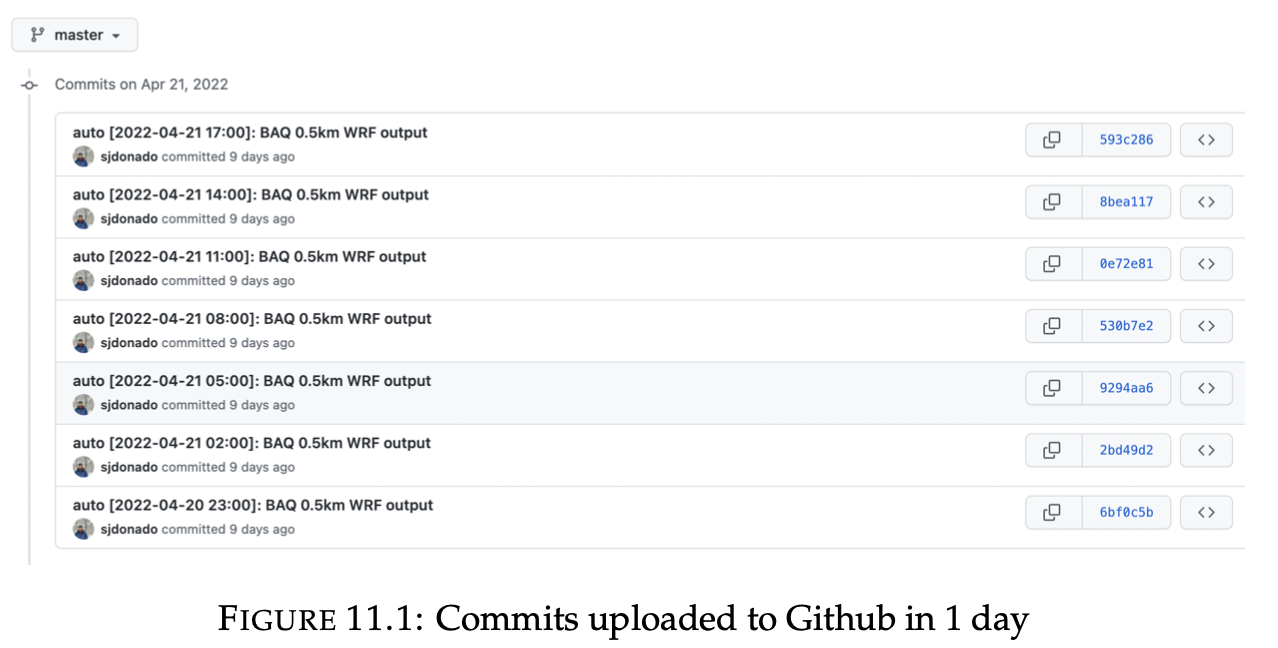
echo "Done!"- Each commit in the repository represents the result of a simulation for a specific date
Web page
reporter (JSON format)
- createdAt.
- startDate.
- endDate.
- ncVariables.
- ogimetStationCoordinates.
- gfsUrls.
- ogimetUrl.
- interpolatedVariables.

Web page
name: Github pages deploy

on:
  push:
    branches:
      - master

jobs:
  deploy:
    runs-on: ubuntu-18.04
    steps:
      - uses: actions/checkout@v2

      - name: Setup Hugo
        uses: peaceiris/actions-hugo@v2
        with:
          hugo-version: '0.82.0'

      - name: Build
        run: hugo --minify

      - name: Deploy
        uses: peaceiris/actions-gh-pages@v3
        with:
          deploy_key: ${{ secrets.ACTIONS_DEPLOY_KEY }}
          publish_dir: ./public
- Hugo static site generator == Markdown + css + js
- Github Action listening to the master branch
- Github Pages -> gh-pages branch
Web page
1. Github REST API
- Endpoint: https://api.github.com/$USER/$REPO/commits/$SHA
- Query limit = 60 requests per hour (cache by default)
- github.com and api.github.com blob files are blocked by CORS
{
  "sha": "1e0f4e6d1948fb8dc153517ecb49c235ab1ed821",
  "filename": "output/temp.gif",
  "status": "modified",
  "additions": 0,
  "deletions": 0,
  "changes": 0,
  "blob_url": "https://github.com/AML-CS/wrf-baq-0.5km/blob/f9e4075e14b350d7d822c3cafa04de04ab438417/output%2Ftemp.gif",
  "raw_url": "https://github.com/AML-CS/wrf-baq-0.5km/raw/f9e4075e14b350d7d822c3cafa04de04ab438417/output%2Ftemp.gif",
  "contents_url": "https://api.github.com/repos/AML-CS/wrf-baq-0.5km/contents/output%2Ftemp.gif?ref=f9e4075e14b350d7d822c3cafa04de04ab438417"
},
Web page
1. Github REST API
- raw.githubusercontent.com -> Access-Control-Allow-Origin: *
- .gif + .json ✅
- X-Frame-Options header?
{
  "name": "temp.gif",
  "path": "output/temp.gif",
  "sha": "1e0f4e6d1948fb8dc153517ecb49c235ab1ed821",
  "size": 399799,
  "url": "https://api.github.com/repos/AML-CS/wrf-baq-0.5km/contents/output/temp.gif?ref=f9e4075e14b350d7d822c3cafa04de04ab438417",
  "html_url": "https://github.com/AML-CS/wrf-baq-0.5km/blob/f9e4075e14b350d7d822c3cafa04de04ab438417/output/temp.gif",
  "git_url": "https://api.github.com/repos/AML-CS/wrf-baq-0.5km/git/blobs/1e0f4e6d1948fb8dc153517ecb49c235ab1ed821",
  "download_url": "https://raw.githubusercontent.com/AML-CS/wrf-baq-0.5km/f9e4075e14b350d7d822c3cafa04de04ab438417/output/temp.gif",
  "type": "file",
  ...
}
Web page
1. Github REST API
- Get the base64 encoded file
- Regex filters the commit name -> "BAQ 0.5km WRF output"
window.initWRFBaqApp = async function init() {
  const API_ENDPOINT = 'https://api.github.com/repos/AML-CS/wrf-baq-0.5km';
  const RAW_API_ENDPOINT = 'https://raw.githubusercontent.com/AML-CS/wrf-baq-0.5km';

  const SHA = new URLSearchParams(document.location.search).get('report_sha') || 'master';

  const allReportsPagination = {
    itemsPerPage: 15,
    currentPage: 1,
    loading: false,
  };

  const ncVariablesToName = {
    'pwater': 'Precipitable Water',
    'wind': 'Wind speed',
    'temp': 'Temperature',
    'uwind': 'U wind speed',
    'vwind': 'V wind speed',
    'press': 'Pressure',
  };

  function apiFetch(url) {
    return fetch(url)
      .then(async (res) => ({
        hasMore: (res.headers.get('link') || '').includes('next'),
        data: (await res.json())
      }))
      .catch(err => {
        console.error(err);
        hideApp();
      });
  }

  async function fetchReport(sha) {
    const { data: { files } } = await apiFetch(`${API_ENDPOINT}/commits/${sha}`);
    const { data: report } = await apiFetch(`${RAW_API_ENDPOINT}/${sha}/output/report.json`);

    const images = {};
    const folium = {};
    const filenameRegex = new RegExp(/output\/(.*)\..*/);

    await Promise.all(files.map(async ({ filename, 'contents_url': contentsUrl }) => {
      const key = filenameRegex.exec(filename)[1];
      if (filename.includes('.gif')) {
        images[key] = `${RAW_API_ENDPOINT}/${sha}/${filename}`;
      }
      if (filename.includes('.html')) {
        const { data: { content } } = await apiFetch(contentsUrl);
        folium[key] = `data:text/html;base64,${content}`;
      }
    }));

    return { report, images, folium };
  }

  async function fetchAllReportsWithPagination(pagination) {
    const { currentPage, itemsPerPage } = pagination;

    pagination.loading = true;
    const { data: commits, hasMore } = await apiFetch(`${API_ENDPOINT}/commits?page=${currentPage}&per_page=${itemsPerPage}`);

    const reports = commits.map(({ sha, commit }) => {
      if (commit.message.includes('BAQ 0.5km WRF output')) {
        return {
          message: commit.message,
          sha,
        }
      }
    }).filter(Boolean);

    pagination.loading = false;

    return { reports, hasMore };
  }

  function displayReportData(data) {
    const reportTitle = document.getElementById('report-title');
    const reportDataTable = document.getElementById('report-data');

    reportTitle.innerHTML = `Report: ${data.createdAt}`;
    reportDataTable.innerHTML = '';

    const formatter = {
      createdAt: (value) => ['Updated', `${value} UTC`],
      startDate: (value) => ['WRF Start Date', `${value}:00 UTC`],
      endDate: (value) => ['WRF End Date', `${value}:00 UTC`],
      gfsUrls: (value) => [`<a href="https://registry.opendata.aws/noaa-gfs-bdp-pds/" target="_blank" rel="noopener noreferrer nofollow">NOAA - GFS data</a>`, value.map((url) => `<a href="https://noaa-gfs-bdp-pds.s3.amazonaws.com/index.html#${url}" target="_blank" rel="noopener noreferrer nofollow">${url}</a>`).join('<br>')],
      ogimetUrl: (value) => [`<a href="https://www.ogimet.com/home.phtml.en" target="_blank" rel="noopener noreferrer nofollow">OGIMET</a> query`, `<a href="${value}" target="_blank" rel="noopener noreferrer nofollow">${value}</a>`],
      ogimetStationCoordinates: (value) => ['SKBQ station', `<a href="https://www.google.com/maps/place/${value.join(',')}" target="_blank" rel="noopener noreferrer nofollow" >${value.join(',')}</a>`],
      interpolatedVariables: (value) => ['Interpolated variables', value.join('<br>').replace(/:fcst(.*?):from [0-9]+/g, '')],
    }

    Object.entries(data).forEach(([key, value]) => {
      const tr = document.createElement('tr');
      const keyTd = document.createElement('td');
      const valueTd = document.createElement('td');

      if (key in formatter) {
        const [title, valueParsed] = formatter[key](value);

        keyTd.innerHTML = title;
        valueTd.innerHTML = valueParsed;

        tr.appendChild(keyTd);
        tr.appendChild(valueTd);

        reportDataTable.appendChild(tr);
      }
    });
  }

  function displayAllReportsTable(data) {
    const allReportsTable = document.getElementById('all-reports');
    allReportsTable.innerHTML = '';

    data.forEach(({ message, sha }) => {
      const tr = document.createElement('tr');
      const messageTd = document.createElement('td');
      const urlTd = document.createElement('td');

      messageTd.innerHTML = message;
      urlTd.innerHTML = `<a href="${window.location.href}?report_sha=${sha}" target="_blank" rel="noopener noreferrer nofollow">See report</a>`;

      tr.appendChild(messageTd);
      tr.appendChild(urlTd);

      allReportsTable.appendChild(tr);
    });
  }

  function createElementIntoContainer(containerId, tag, variables) {
    const parent = document.getElementById(containerId);
    const child = document.createElement(tag);

    Object.entries(variables).forEach(([key, value]) => {
      child[key] = value;
    });

    if (parent.querySelector(tag)) {
      parent.removeChild(parent.querySelector(tag));
    }
    parent.appendChild(child);
  }

  function loadFolium(variable, url) {
    createElementIntoContainer('maps-folium', 'iframe', {
      src: url,
      title: ncVariablesToName[variable],
    });
  }

  function loadGif(variable, url) {
    createElementIntoContainer('maps-gif', 'img', {
      src: url,
      alt: ncVariablesToName[variable],
    });
  }

  function initVariablesSelect(report, images, folium) {
    const variablesSelect = document.getElementById('variables-select');

    report.ncVariables.forEach((variable, index) => {
      const option = document.createElement('option');
      option.value = variable;
      option.textContent = ncVariablesToName[variable];

      if (index === 0) {
        option.selected = true;
        loadGif(variable, images[variable]);
        loadFolium(variable, folium[variable]);
      }

      variablesSelect.appendChild(option);
    });

    variablesSelect.addEventListener('change', (e) => {
      const variable = e.target.value;

      loadGif(variable, images[variable]);
      loadFolium(variable, folium[variable]);
    });
  }

  function initAllReportsPagination() {
    const newerButton = document.getElementById('newer');
    const olderButton = document.getElementById('older');

    newerButton.addEventListener('click', (e) => {
      const { currentPage, loading } = allReportsPagination;

      if (loading) {
        return;
      }

      if (currentPage > 1) {
        allReportsPagination.currentPage -= 1;
      }

      if (allReportsPagination.currentPage === 1) {
        newerButton.disabled = true;
      }

      showAllReportsWithPagination();

      olderButton.disabled = false;
    });

    olderButton.addEventListener('click', async (e) => {
      const { loading } = allReportsPagination;

      if (loading) {
        return;
      }

      allReportsPagination.currentPage += 1;
      const { success, hasMore } = await showAllReportsWithPagination();

      if (!success) {
        allReportsPagination.currentPage -= 1;
      }

      if (!hasMore || !success) {
        olderButton.disabled = true;
      }

      newerButton.disabled = false;
    });
  }

  function showApp() {
    const app = document.getElementById('wrf-baq-app');
    app.classList.remove('hide');
  }

  function hideApp() {
    const app = document.getElementById('wrf-baq-app');
    app.classList.add('hide');
  }

  async function showReport() {
    const { report, images, folium } = await fetchReport(SHA);

    if (Object.keys(report).length >= 7) {
      initVariablesSelect(report, images, folium);
      displayReportData(report);

      return true;
    }
  }

  async function showAllReportsWithPagination() {
    const { reports, hasMore } = await fetchAllReportsWithPagination(allReportsPagination);

    const success = reports.length > 0;

    if (success) {
      displayAllReportsTable(reports);
    }

    return { success, hasMore }
  }

  if ((await showReport()) && (await showAllReportsWithPagination()).success ) {
    initAllReportsPagination();
    showApp();
  }
}Web page
2. Frontend
- Gets last commit
- Gets the last 15 commits
- HTML is loaded dynamically -> depends on API response
<div id="wrf-baq-app" class="hide">
  <span id="loading">Loading...</span>
  <div>
    <h2 id="report-title"></h2>
    <div class="select-container">
      <label for="variables-select">Choose a variable:</label>
      <select id="variables-select" name="variables"></select>
    </div>
    <div class="maps-container">
      <div id="maps-gif" class="img-loader"></div>
      <div id="maps-folium"></div>
    </div>
  </div>
  <table id="report-data"></table>
  <div>
    <h2>All Reports</h2>
    <table id="all-reports"></table>
    <div class="pagination">
      <button id="newer" disabled>Newer</button>
      <button id="older">Older</button>
    </div>
  </div>
</div>
Web page
2. Frontend
Web page
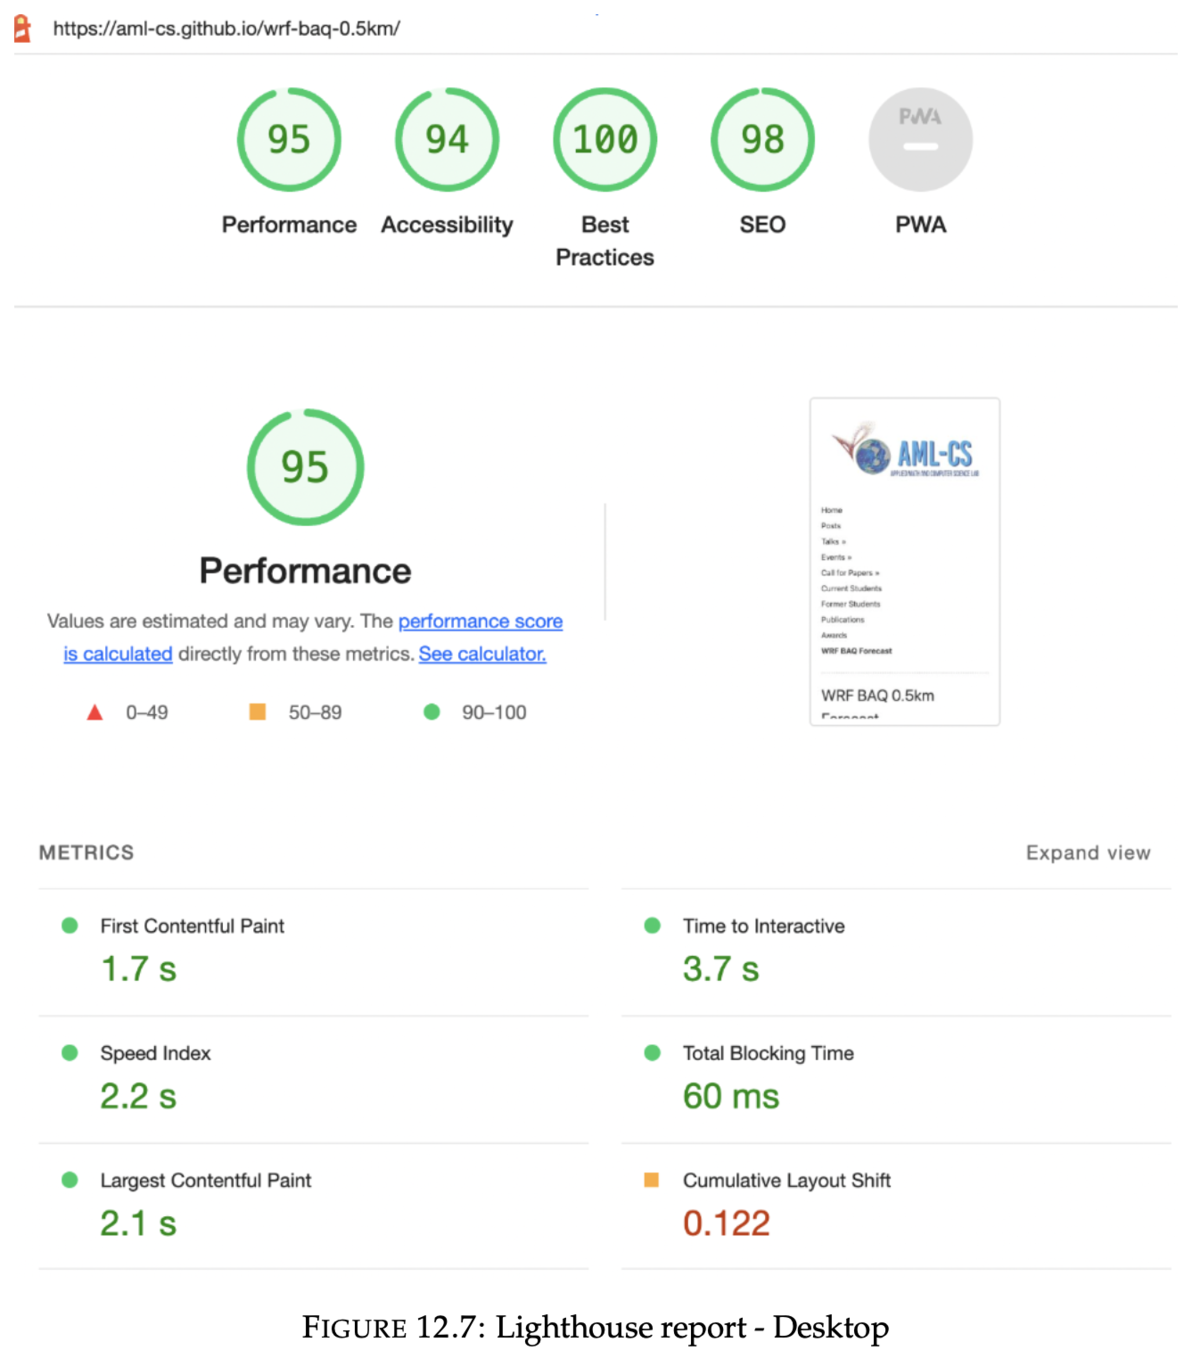
3. Lighthouse Report