Category Representation
Core Question
- Is there a spatial localization to knowledge that is relevant for particular categories?
How do we measure "where" a category is represented?
Core Question
- Is there a spatial localization to knowledge that is relevant for particular categories?
How do we measure "where" a category is represented?
Ultimate Plan:
- Create a map of preference for a category
- Create \(\beta\)-maps for some CREA features
- Show that the weighted sum of b-maps corresponds to the category map defined without the model
don't include words from target category
After some thought ...
Underlying Assumption
- What it means to represent a category is to be able to dinstinguish between examplars of a category
- Knowledge of vehicles entails knowing how a truck differs from a car
- Some one who knows a lot about trees has tree-specific representations
Note, I am not claiming this is sufficient, but that it is necessary
Visual Description

cat_101
Represents Category
- Each word is presented 6 times

cat_101
Does NOT Represent Category
Quantification
Approach 1
- Rank ordering approach
- How similar is one presentation of a word to the other presentations of the same word?
- Take presentation
- Get distance to all other presentations
- Take average rank of same word
- Average words by category
This metric tells us how "distinct" each word is from the other words
Note: For each subject, for each category, we get a "mean percentile" map
1) Take presentation
2) Get distance to all other presentations
3) Take average rank of same word
4) Average words by category
This metric tells us how "distinct" each word is from the other words
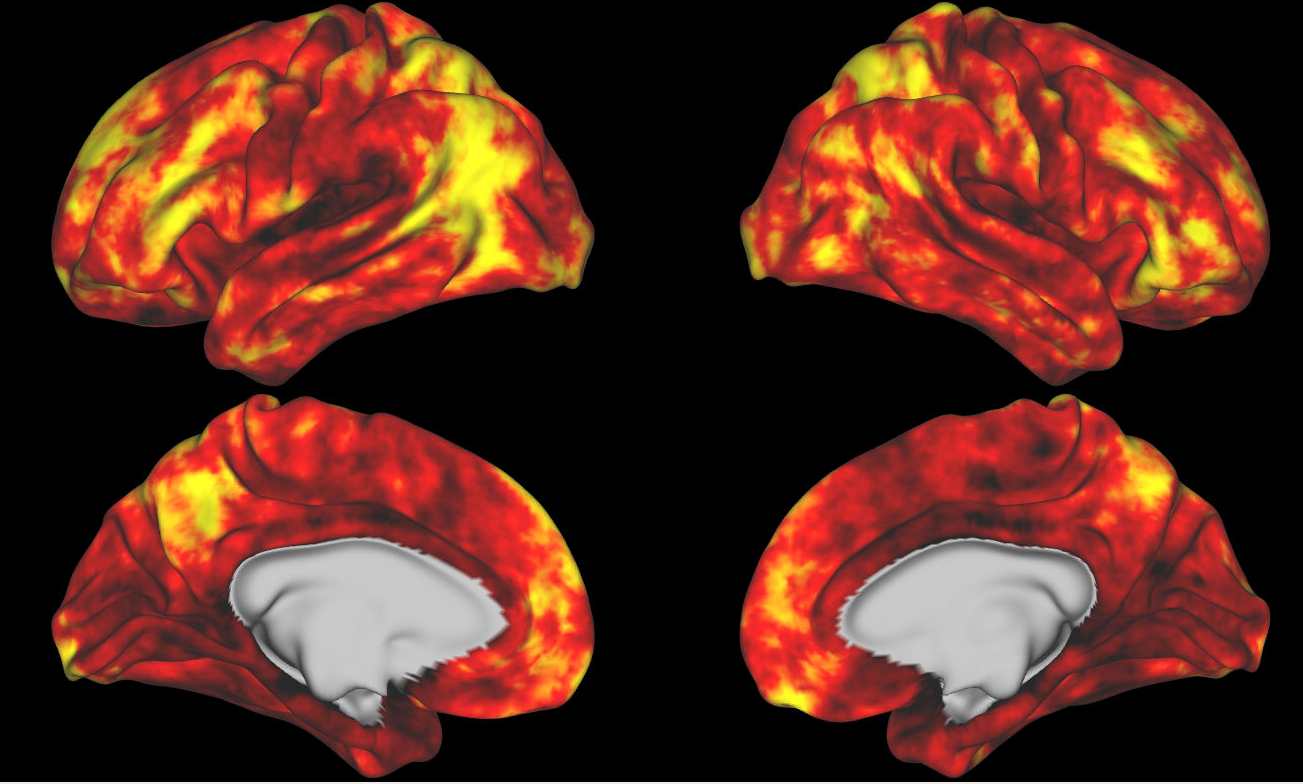
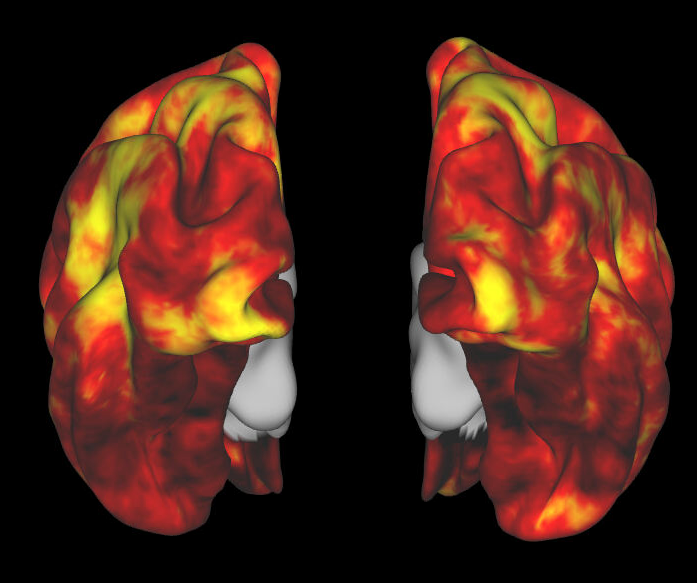
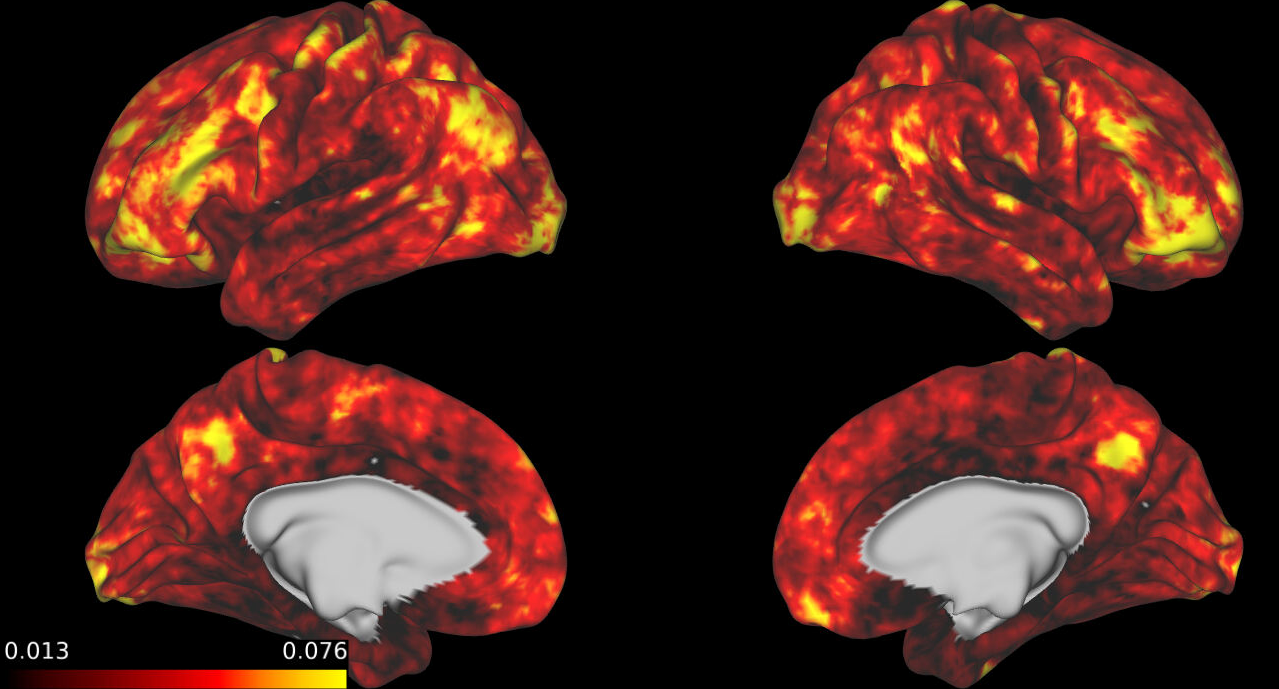
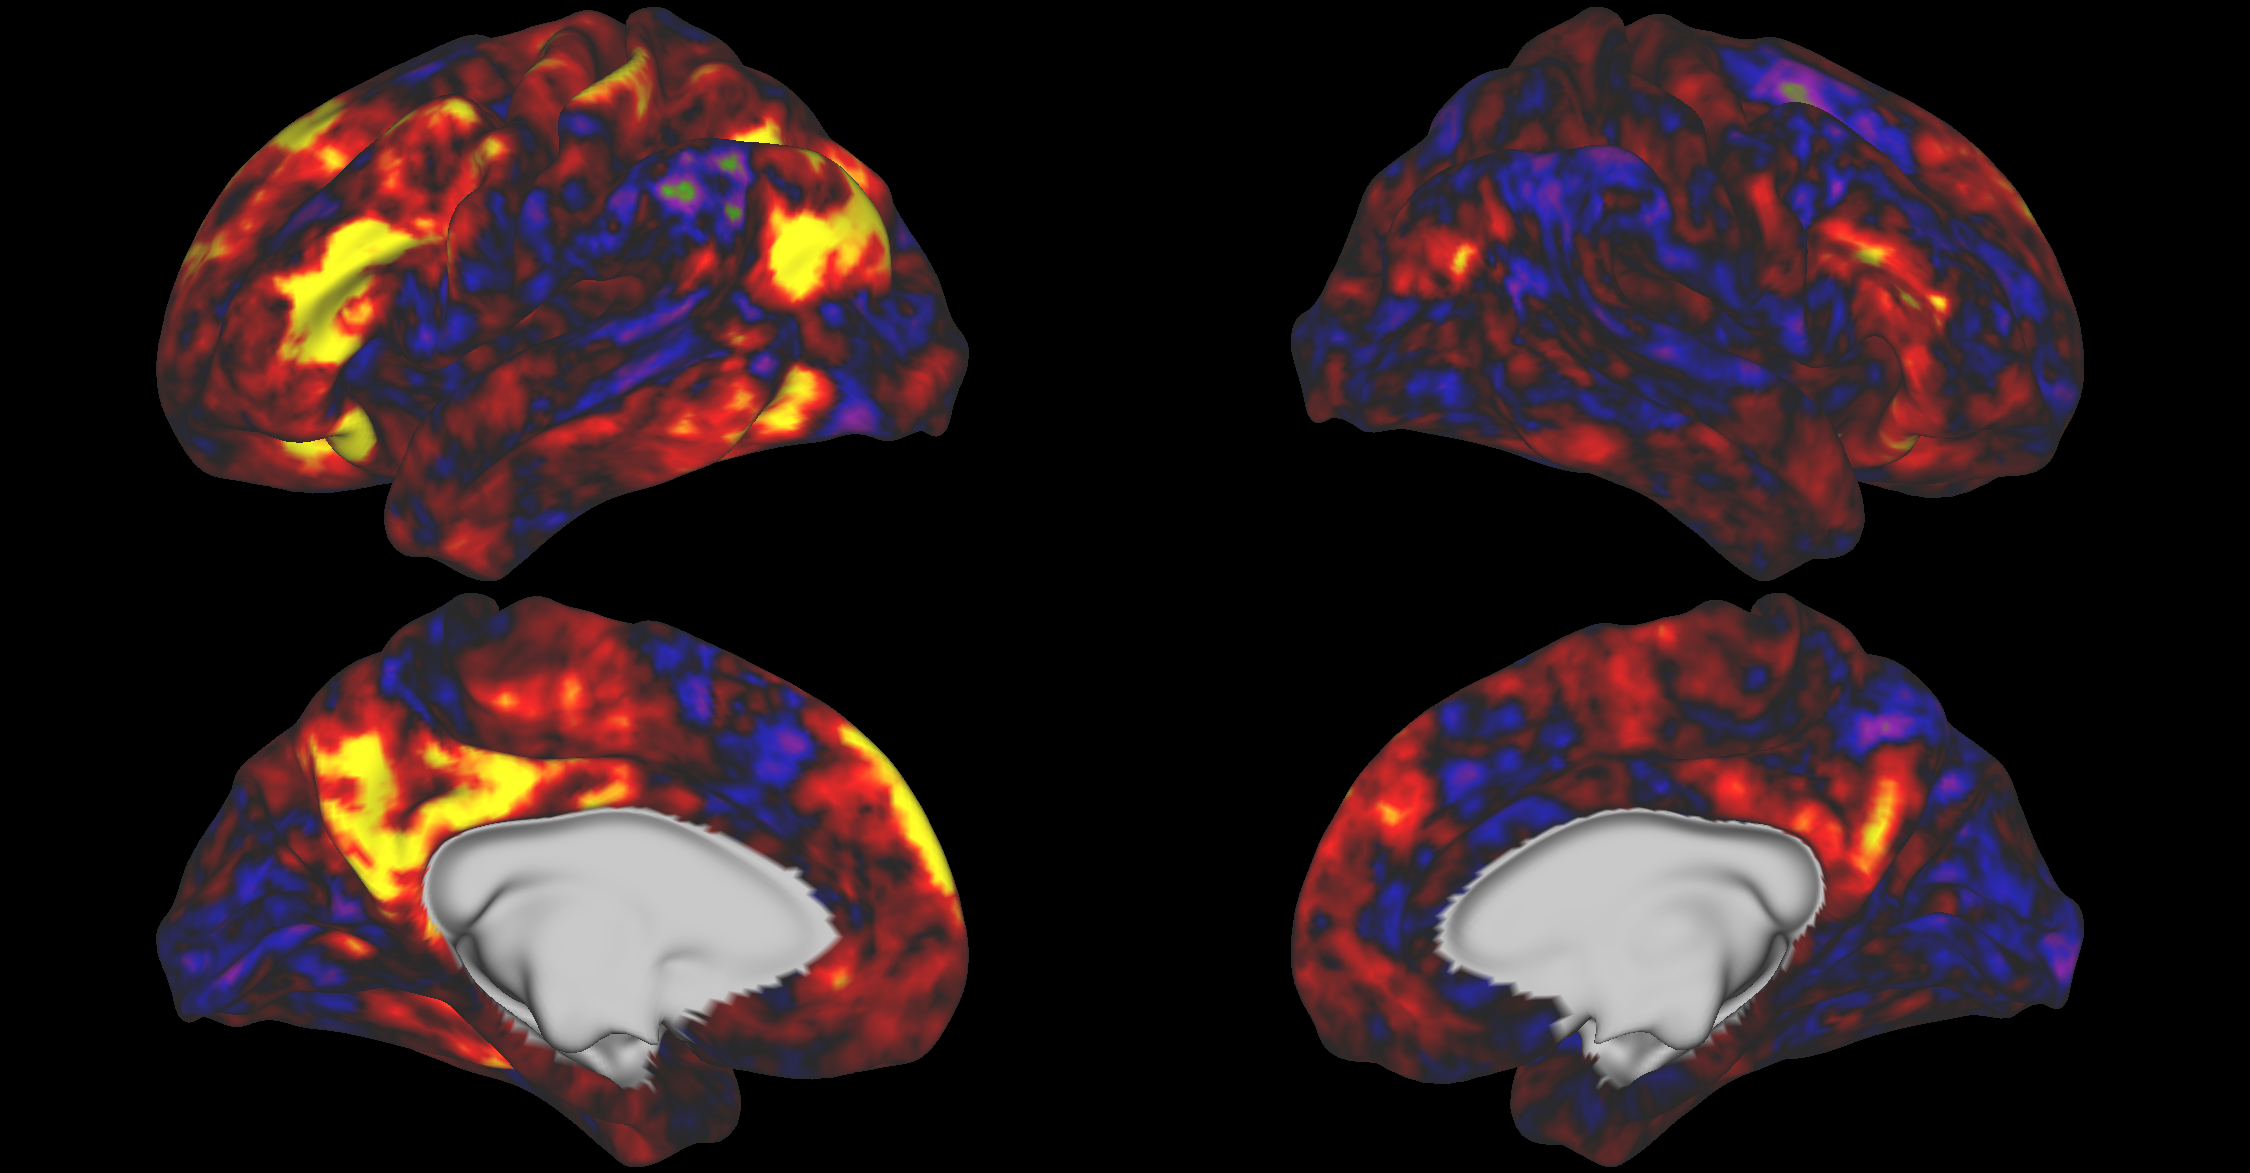
Mean Percentile Across All Categories
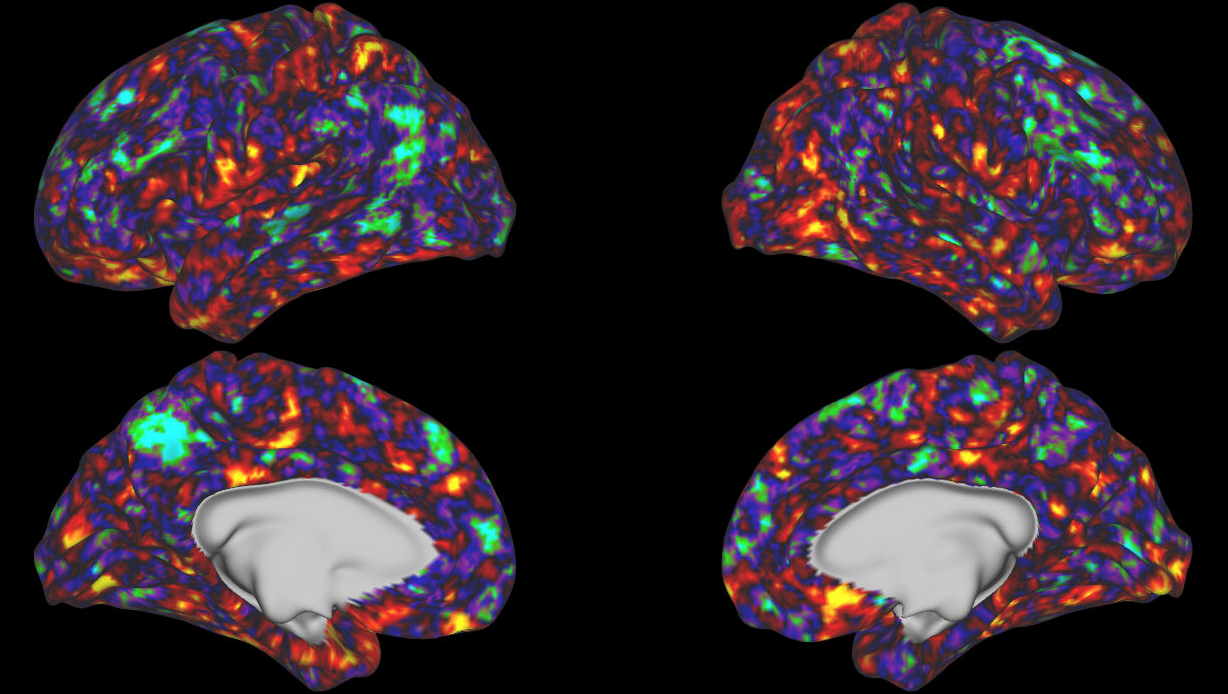
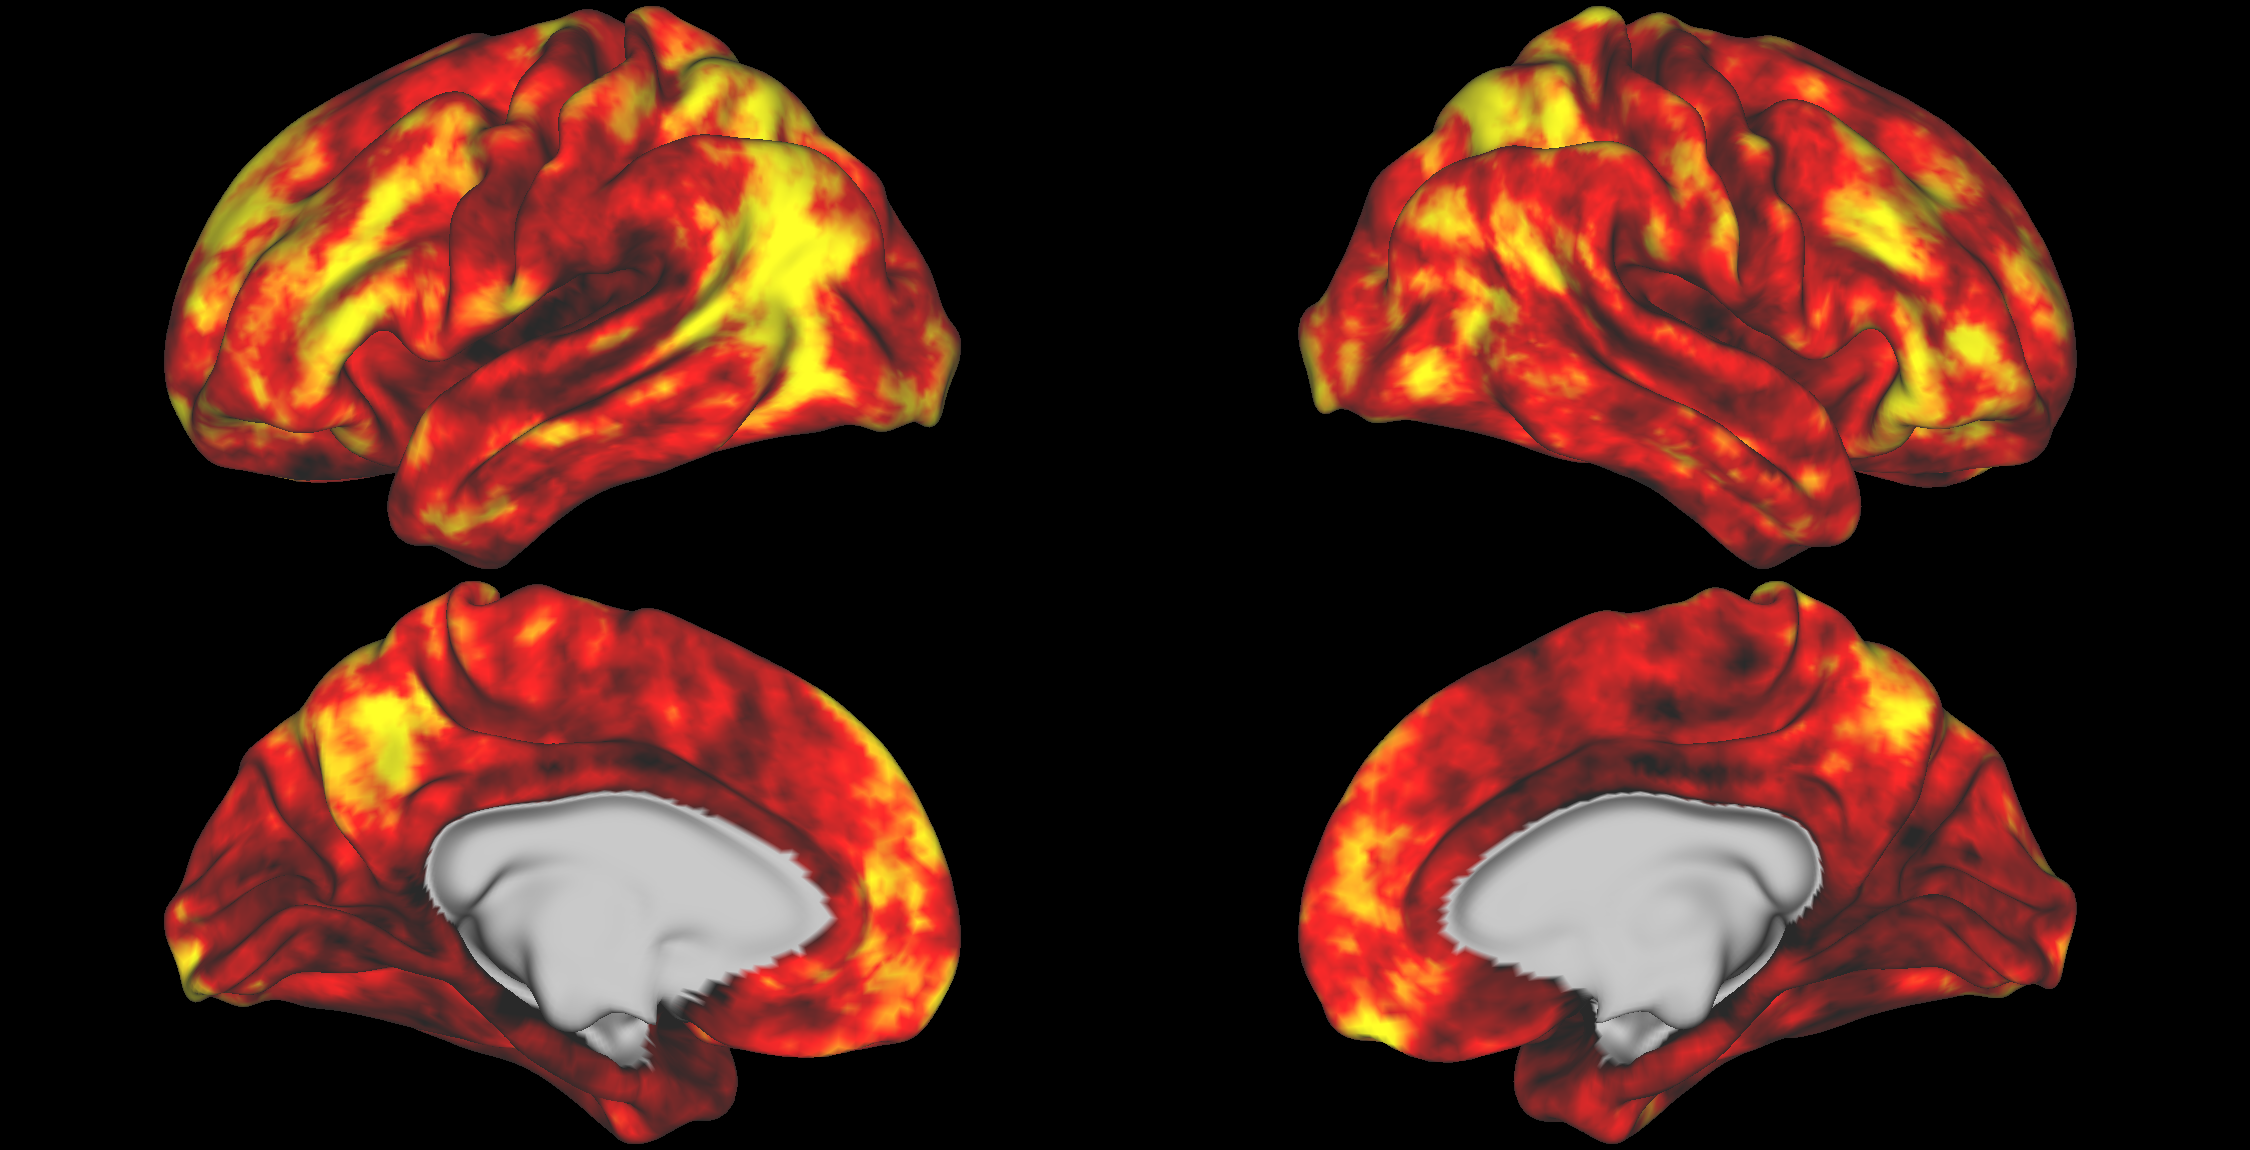
Animal v AO
Animal v AO
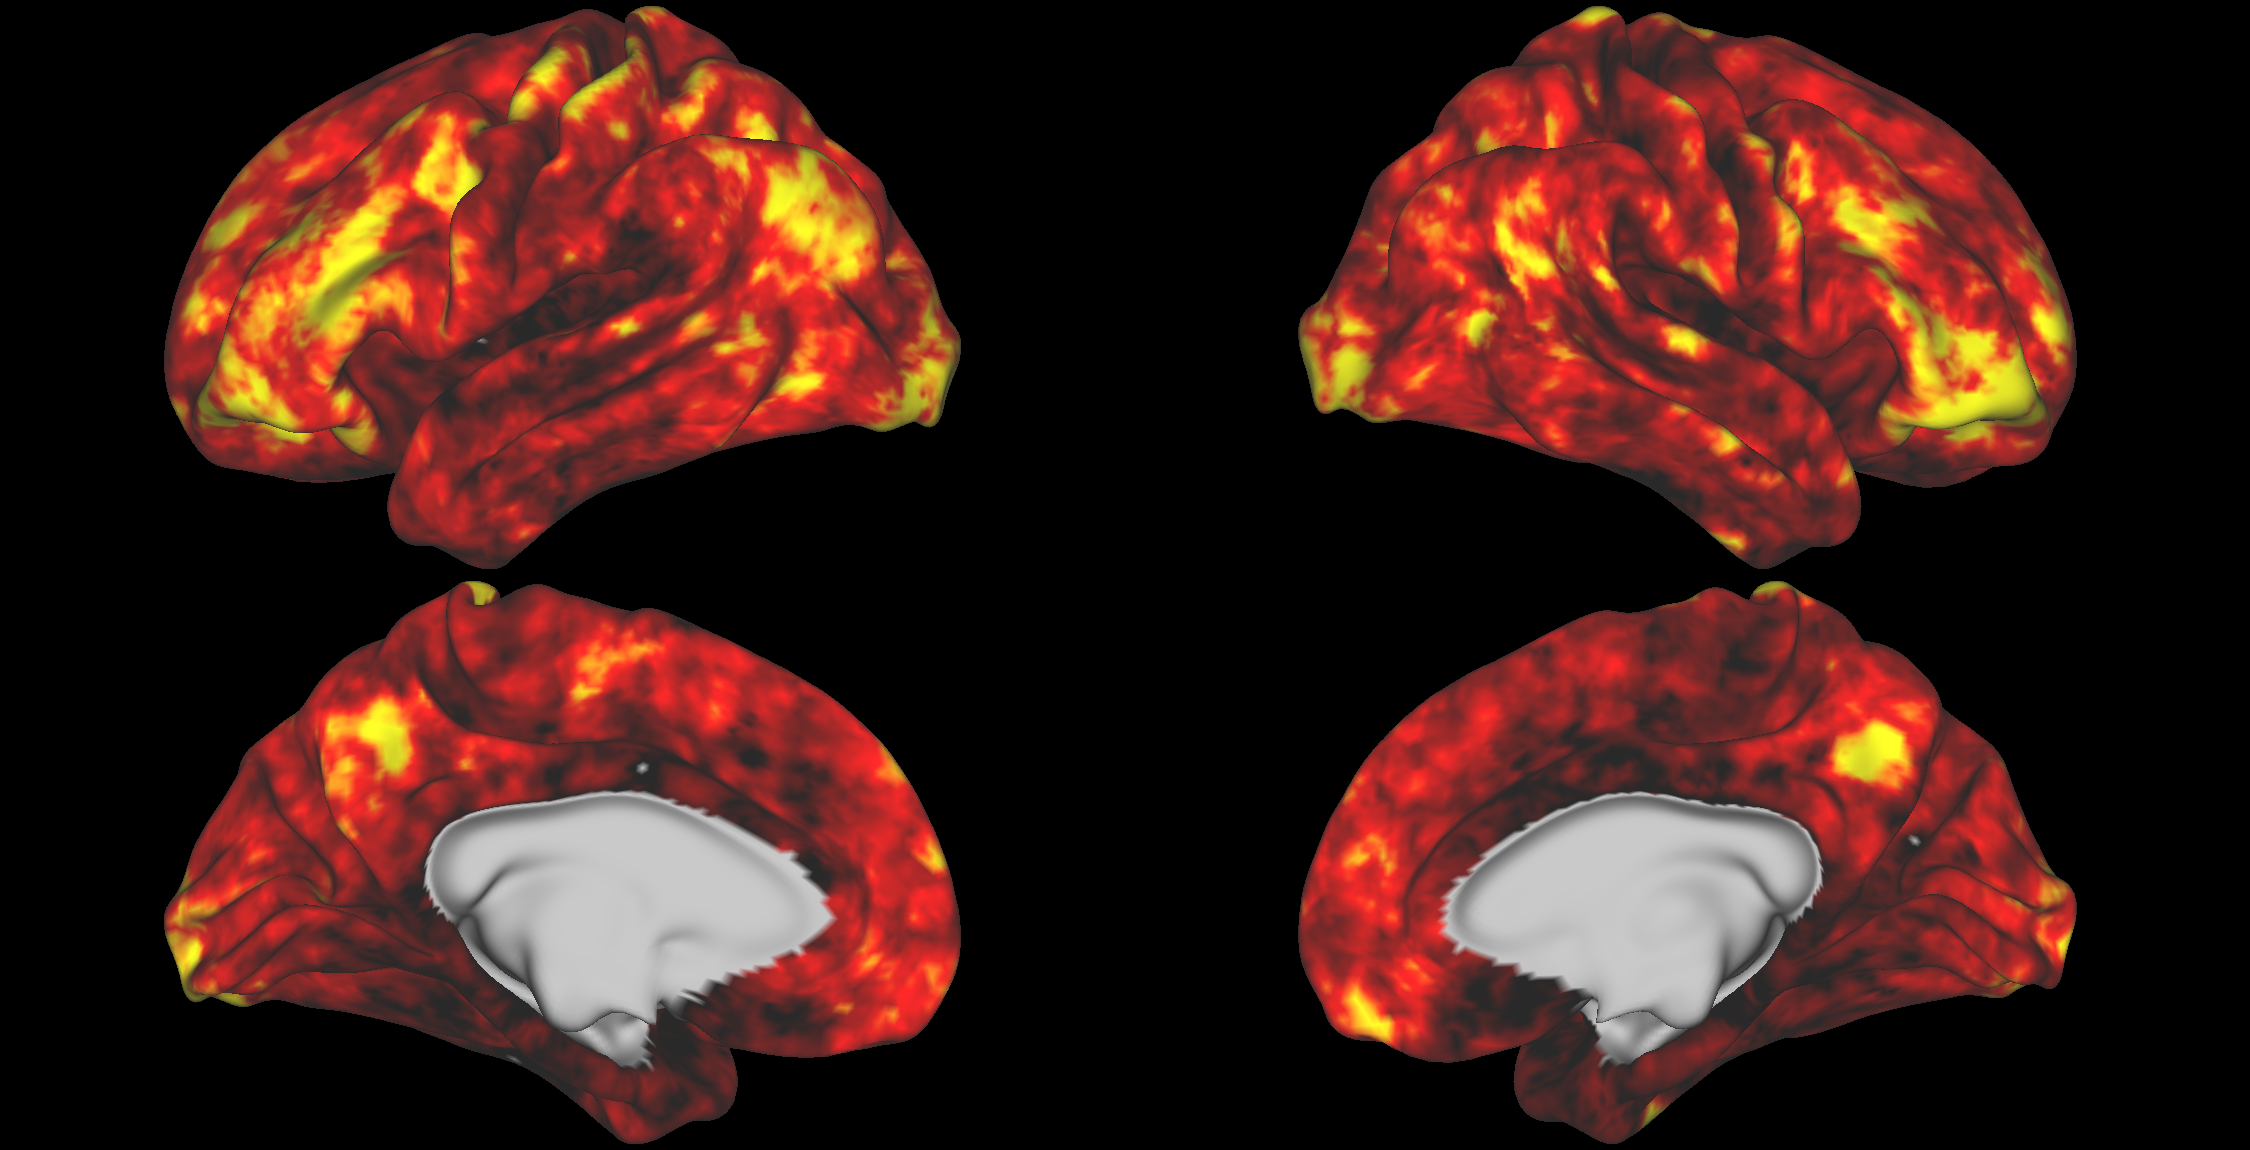
Human Trait v AO

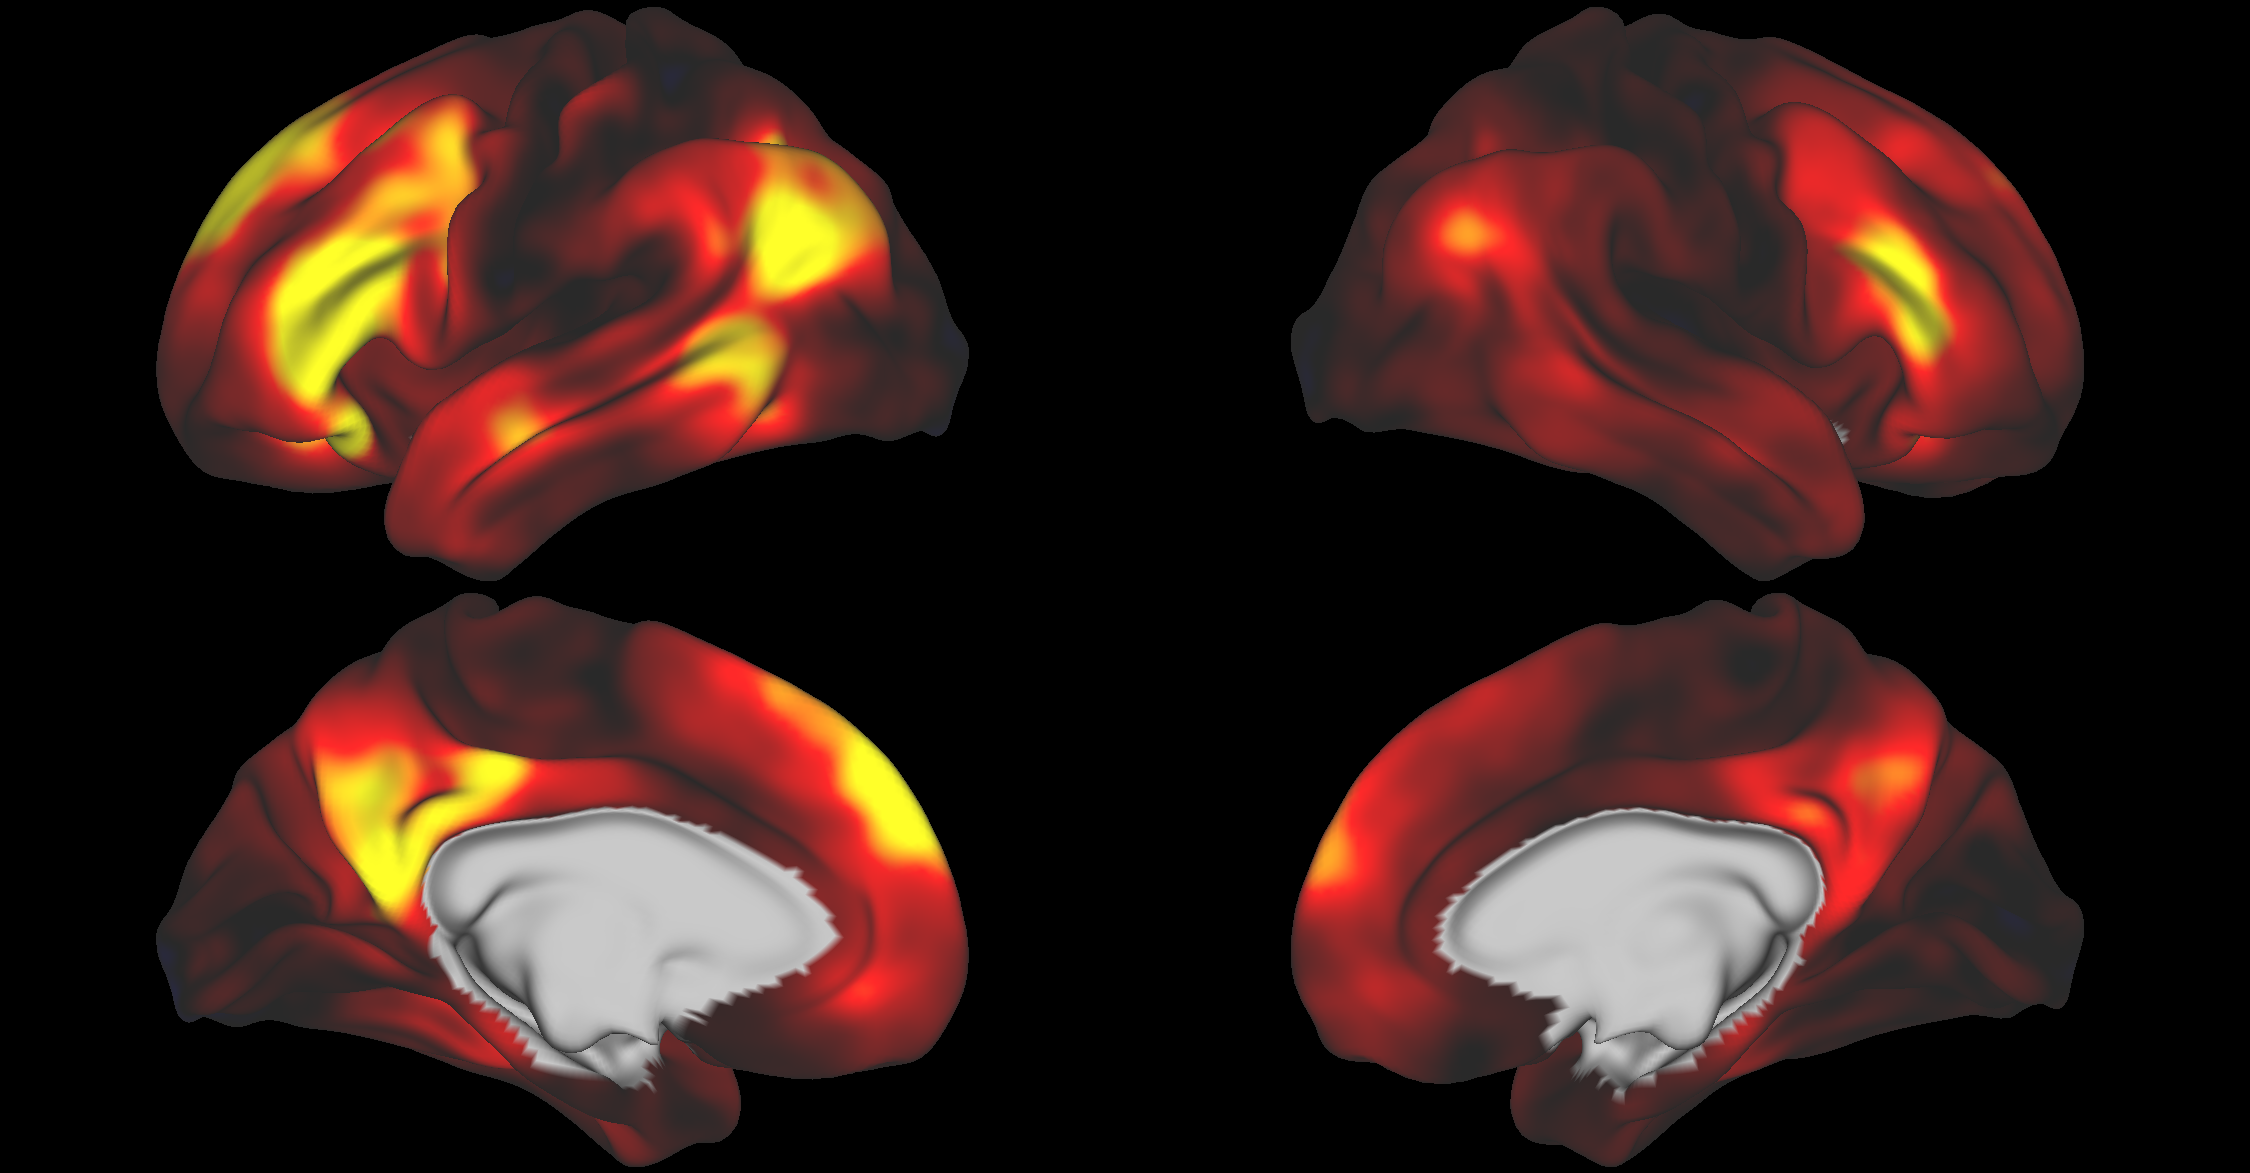
Quantity v AO
Approach 2
- Better metric. Look if DSM from each presentation is similar
- For each category we have 6 DSM's (so 15 pairwise correlations between the DSM's)
- If Category has robust representation in an area, then the DSM's will be consistent. Otherwise, noise will drive the DSM correlations down
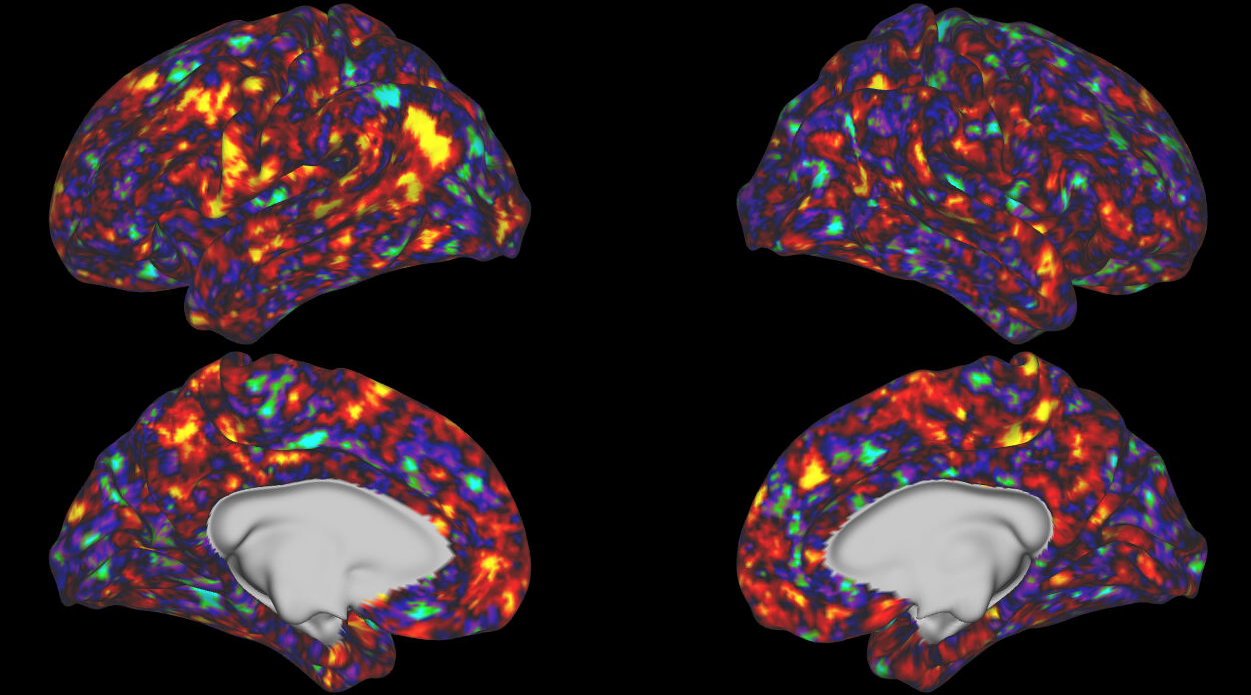
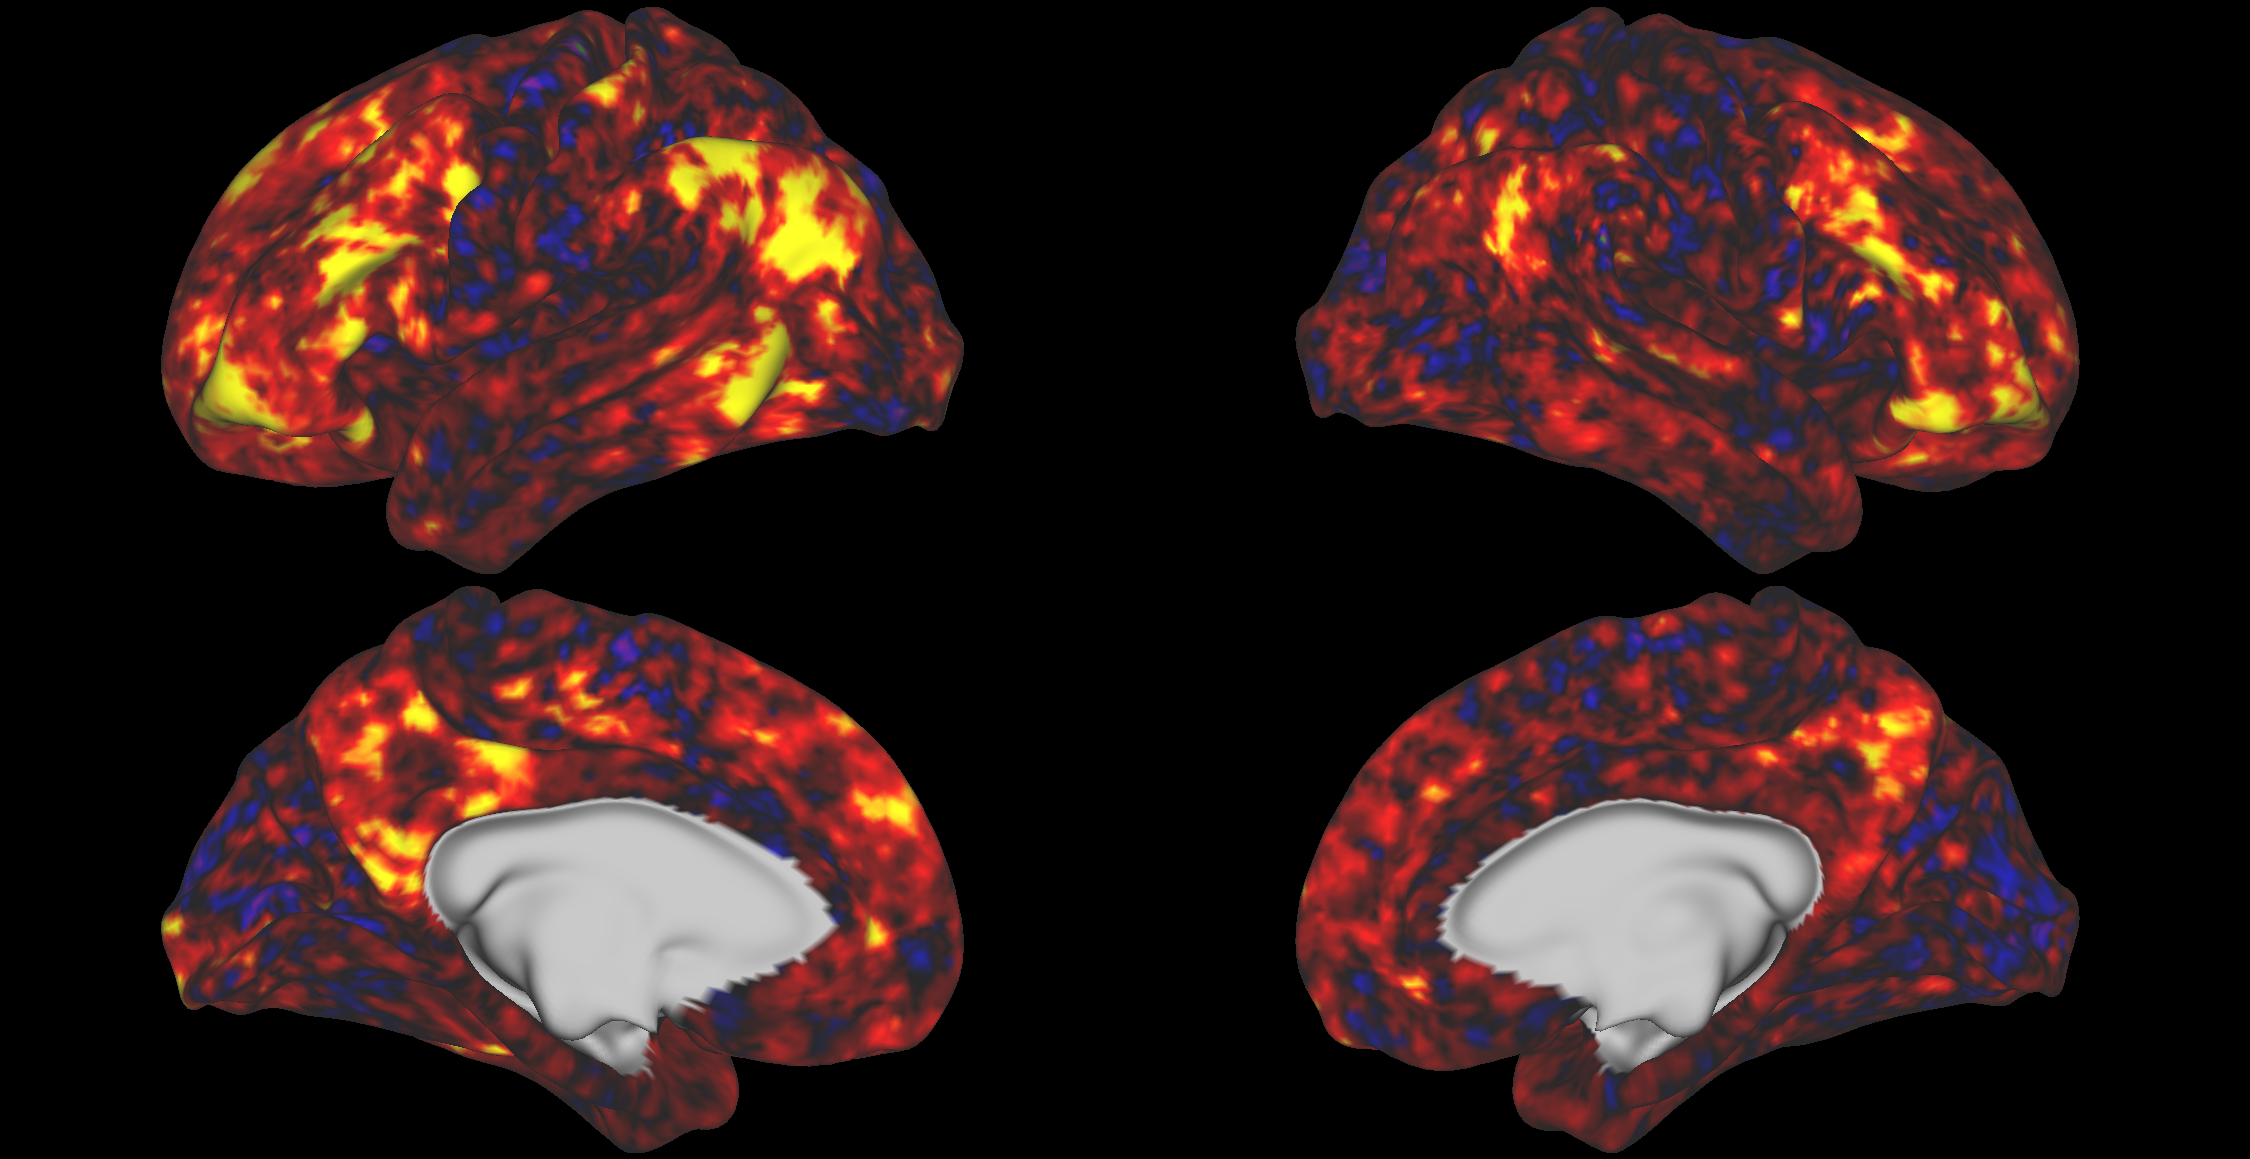
Average DSM Correlation
Toggle
Thoughts
- On the whole, seems DSM correlation across presentations is less sensitive than rank-ordering metric
- Could use another metric ...

(Average Distance between Blue and Orange Dots)
(Average Distance Between Blue Dots)
S =
Between group variance
Within group variance
Thoughts
- On the whole, seems DSM correlation across presentations is less sensitive than rank-ordering metric
- Could use another metric ...
- Could re-phrase definition
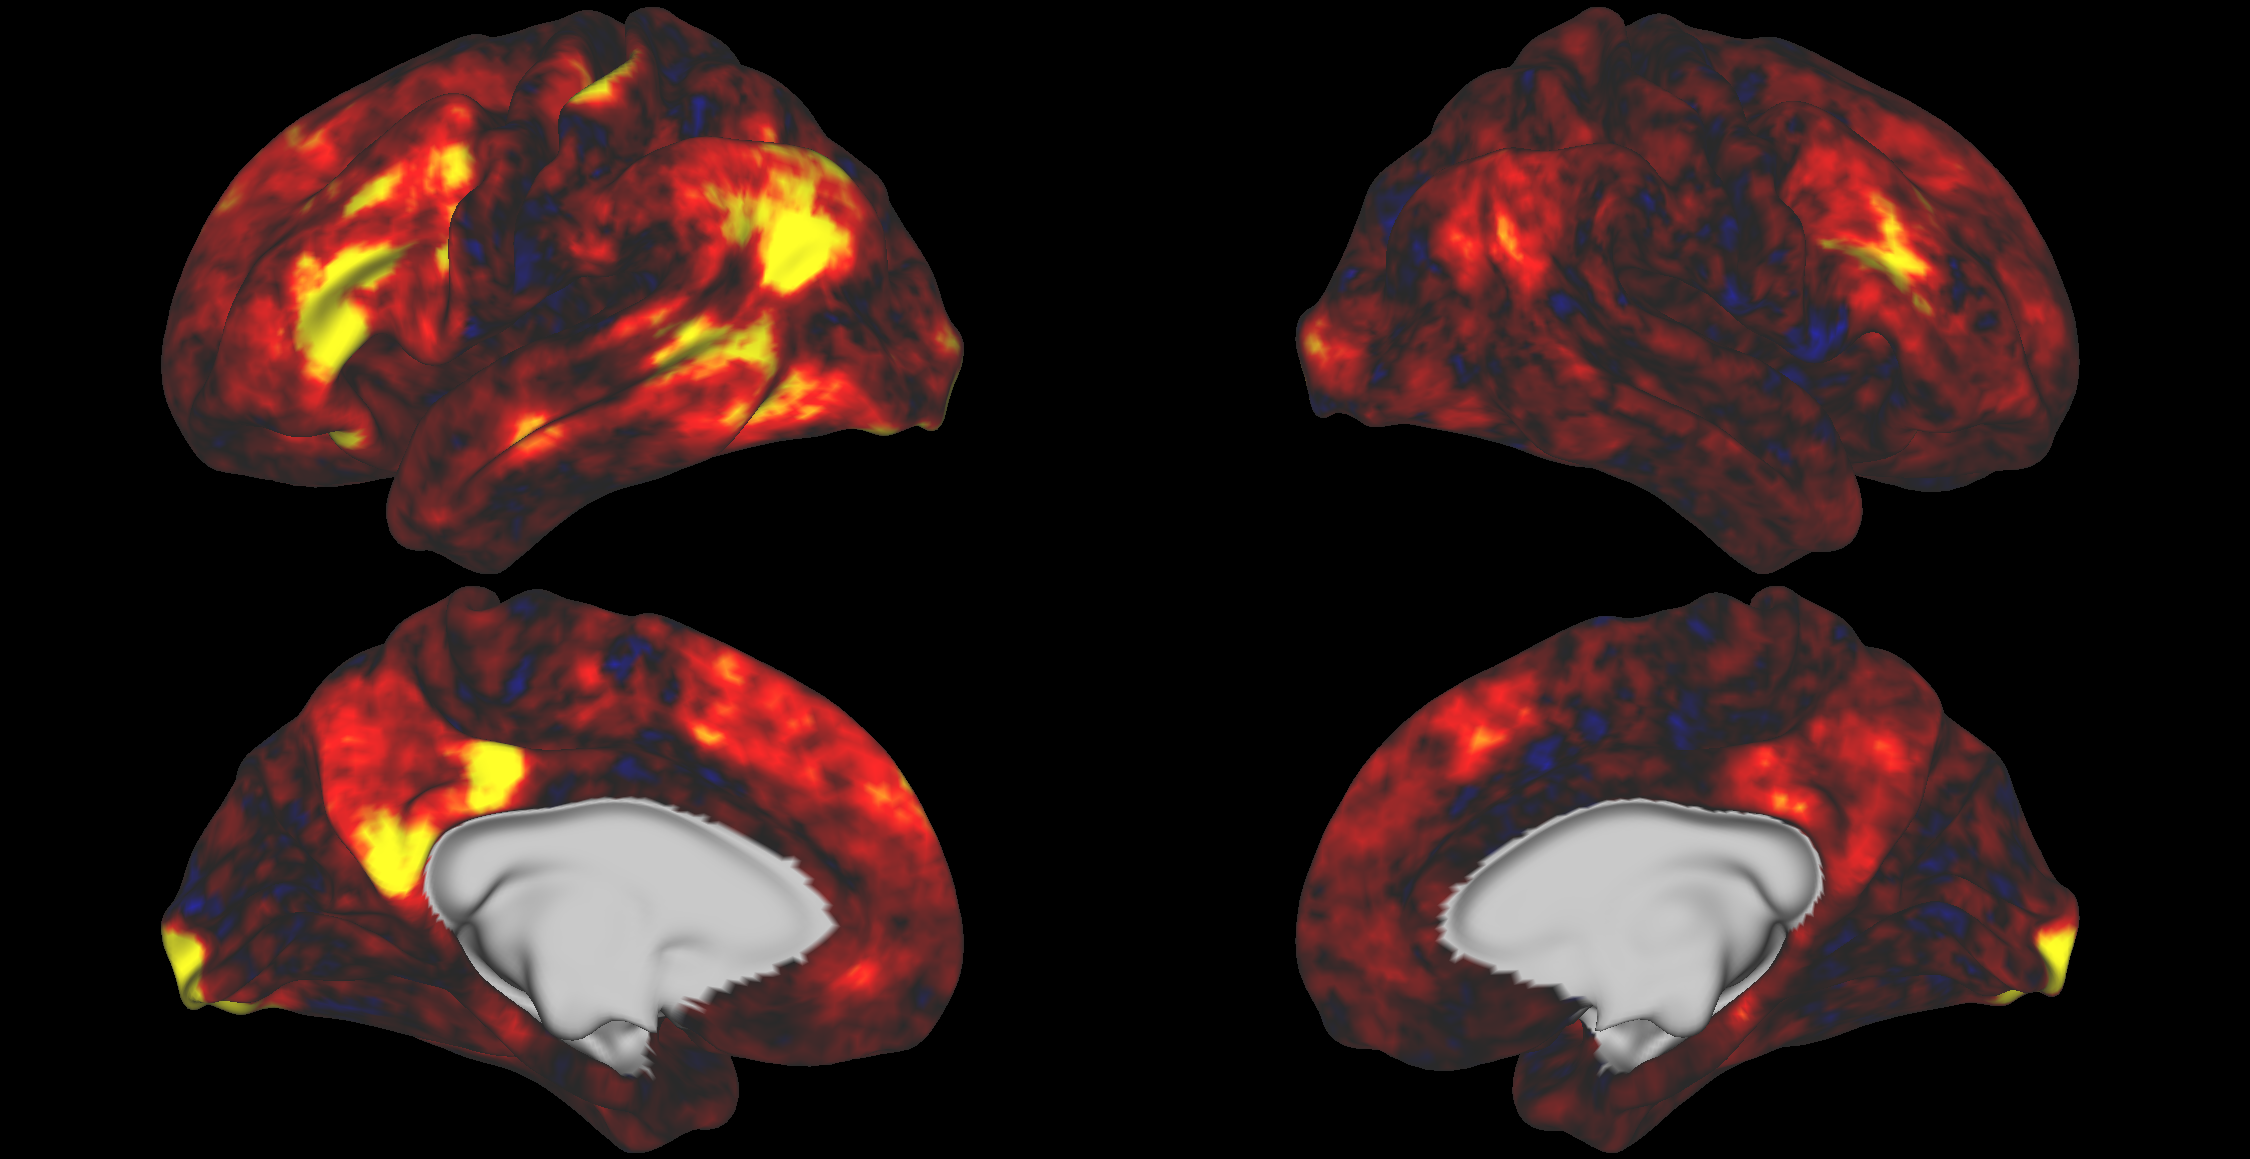
Where are DSM's for a category robust at a group level
Instead of each point bein a presentation of a word to a subject, each point is a subject (with all 6 presentations averaged in that subject)
Thoughts
- On the whole, seems DSM correlation across presentations is less sensitive than rank-ordering metric
- Could use another metric ...
- Could re-phrase definition
- Might need to inspect data more closely
Toggle
CAT Noise
Toggle
SOE Noise
To-Do
- Why are there some negative CREA correlations?
- In particular, why do these show up with CAT and not SOE words?
- Why is primary visual cortex noise ceiling so different between CAT and SOE? Is there something different in the data?
- Do analysis using only SOE object words
- Could do group level
Side Quest(ions)
- Have we ever shown that 6 presentations is optimal? Maybe same results with 5. Could do an analysis on number of presentations
- Are events really just more "complicated" things than objects?