Reproducible Analyses with
R Markdown & IPython Notebook
Wagner Lab Meeting, 10/31/14
Benefits of Reproducible Analyses
- Keep track of analysis steps going from the raw data to final statistics & plots
- Update stats & plots based on revisions to analysis (or addition of subjects)
- Makes sharing analysis pipelines easier
- Collaboration
- Publication
- Replication
- Avoid errors in working between multiple programs & copy/paste mistakes
How?
- R Markdown
- IPython Notebook
- Project Jupyter
- MATLAB Publishing
How?
- R Markdown
- IPython Notebook
- MATLAB Publishing
MATLAB Publishing
- Compile HTML, PDF, etc. documents from an R script
- Improve readability of code by formatting text using Markdown syntax
- Create interactive R Markdown documents using Shiny
Why use it?
How?
open source!
- R Markdown
- IPython Notebook
- Project Jupyter
- MATLAB Publishing
MATLAB Publishing
Quick notes
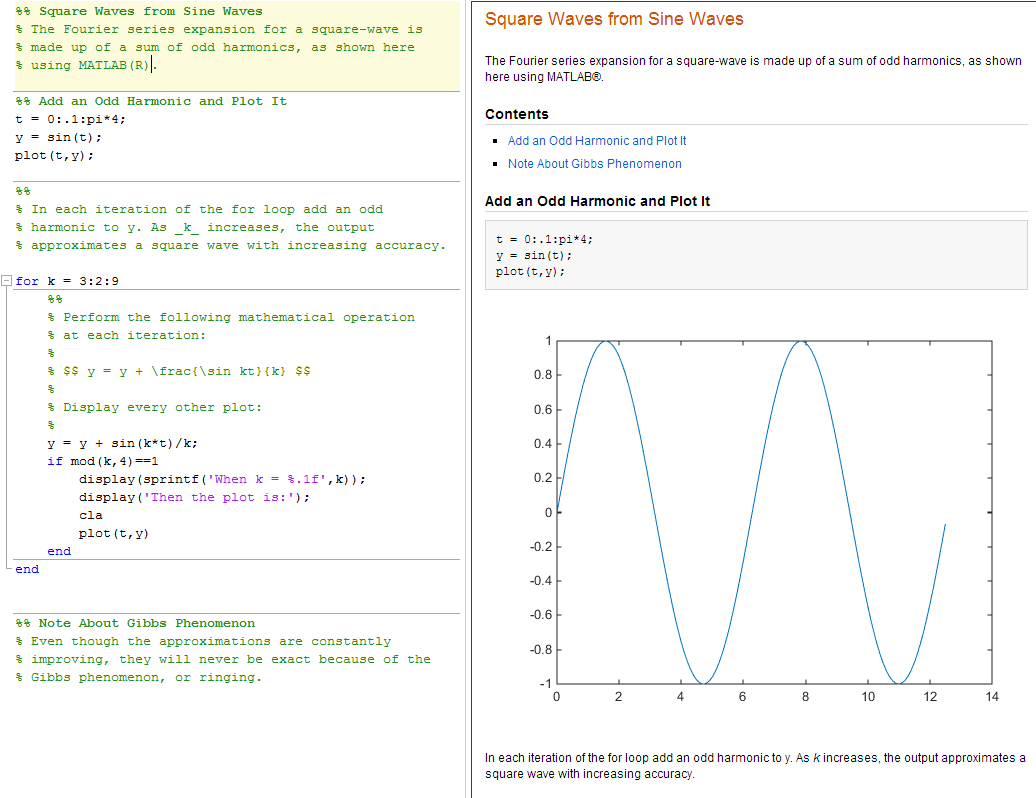
# Generate HTML view of script
publish('run_analysis.m');

# View HTML
web('html/run_analysis.html')
- File Exchange scripts for including dependent and called functions in published version
- Con: not integrated with statistical analyses in R
R Markdown
- Compile HTML, PDF, etc. documents from an R script
- Improve readability of code by formatting text using Markdown syntax
- Create interactive R Markdown documents using Shiny
Why use it?
R Markdown
- Download/Install R
- Download/Install RStudio (optional, but recommended)
- Install the "knitr" package
How do you get it?
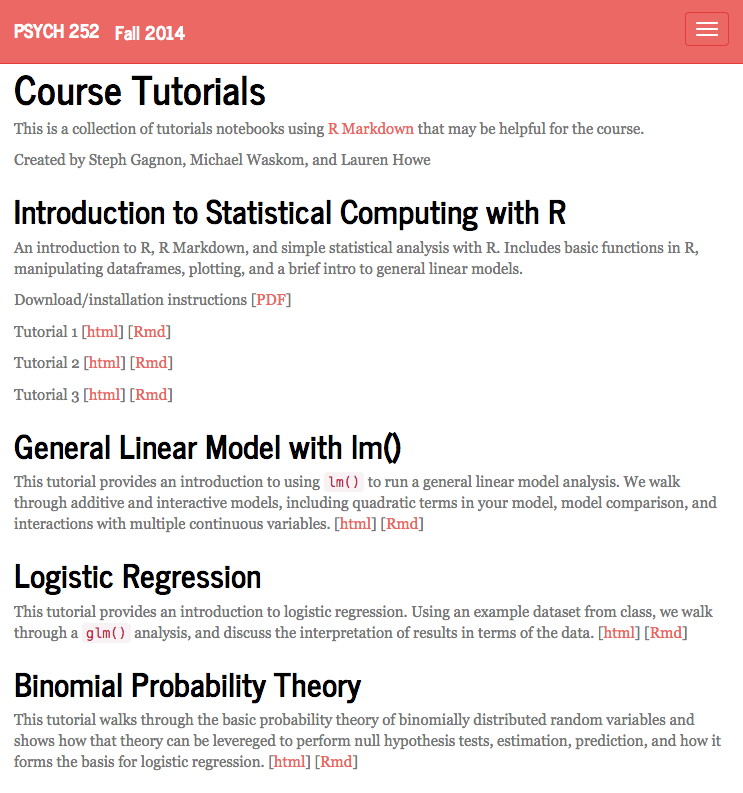
http://stanford.edu/class/psych252/tutorials/index.htmlR Markdown
- Headers
- Emphasis (*italics*, **bold**)
- LaTeX equations ($\chi^2$)
- Tables
- Lists
- Images (!(/path/to/image.png)
- Code chunks/code blocks
- Inline code (``)
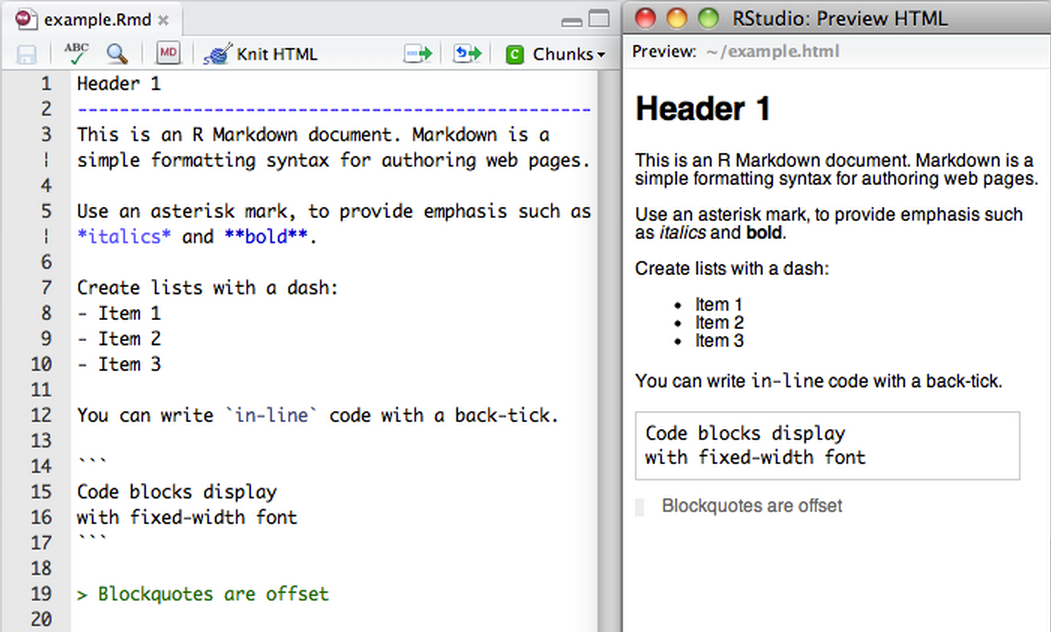
Markdown Basics
R Markdown
- To execute a line of code, type: cmd-return
- To execute a chunk: opt-cmd-c
- To insert a new chunk: opt-cmd-i
- For code completion: tab
- For documentation: ?func-name; ??keyword
-
Comment/uncomment line: shift-cmd-c
Keyboard Shortcuts
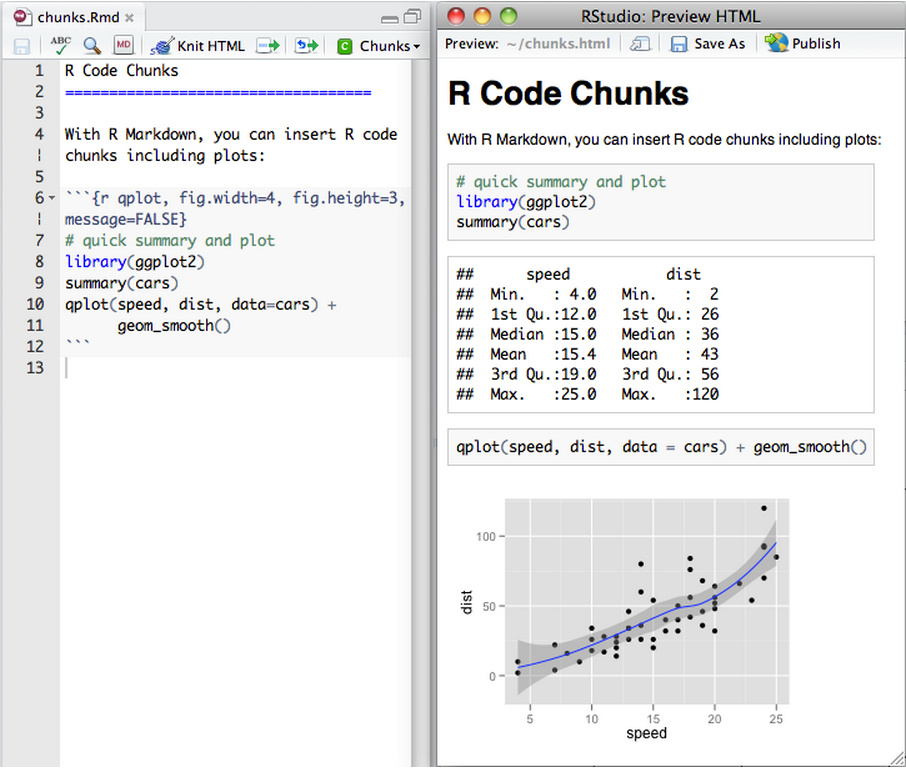
R Markdown
R Code Chunks
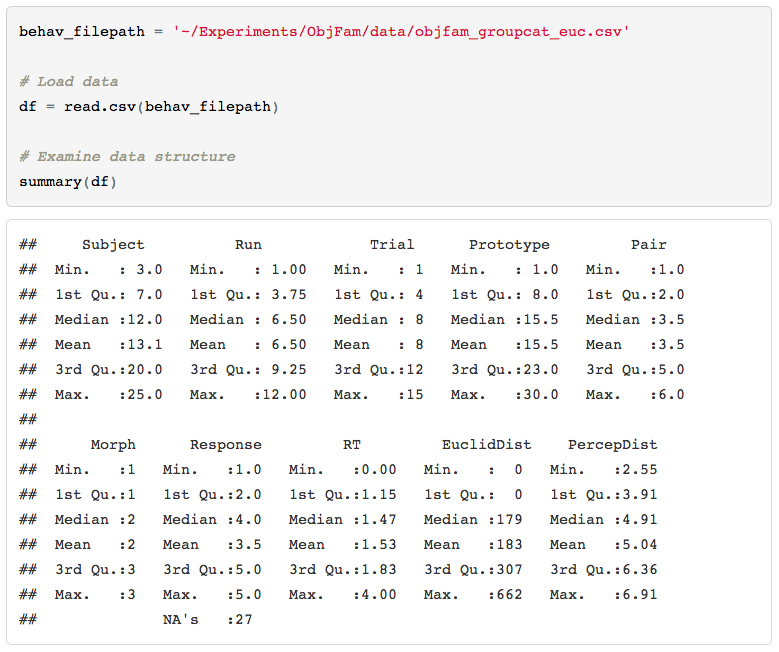
```{r load_data}
behav_filepath = '~/Dropbox/Code/tutorial/objfam_groupcat_euc.csv'

# Load data
df = read.csv(behav_filepath)

# Examine data structure
summary(df)
str(df)
```
R Markdown
R Code Chunks
```{r load_data}
behav_filepath = '~/Dropbox/Code/tutorial/objfam_groupcat_euc.csv'

# Load data
df = read.csv(behav_filepath)

# Examine data structure
summary(df)
str(df)
```
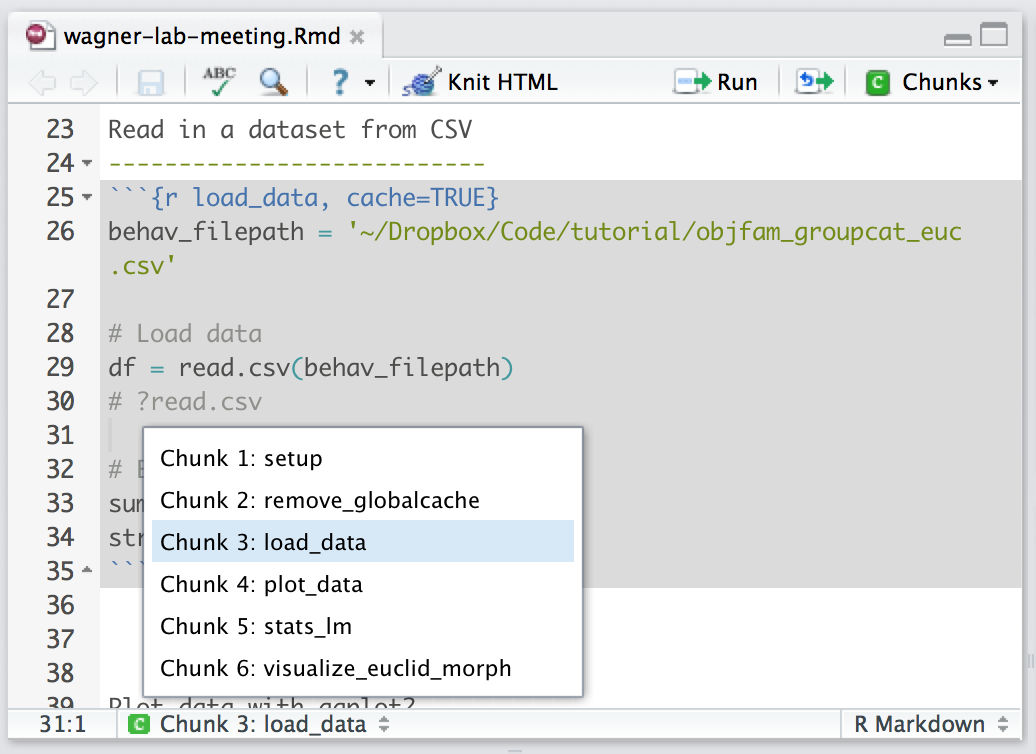
Naming chunks helps navigate script
R Markdown
R Code Chunks
R Markdown
R Code Chunks
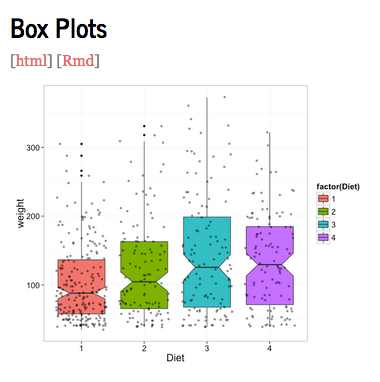
Plot data
----------
- Specify height & width of plot
- Hide code
```{r plot_data, fig.height=3, fig.width=7, echo=FALSE}
boxplot(Response~Morph, data=df)
```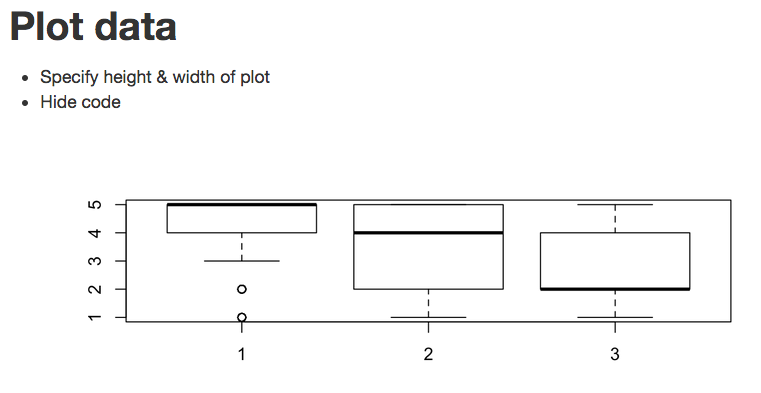
Specify plot dimensions
hide code in knit file
R Markdown
R Code Chunks
General linear model analysis
----------------------
### Does Euclidean distance vary as a function of morph level?
```{r stats}
rs1 = lm(EuclidDist~scale(Morph, scale=FALSE), data=df)
summary(rs1)

final_model = rs1
sm = summary(final_model)
```

#### Stats Summary:
Euclidean distance significantly varies as a function of morph level,
$R^2$ = `r sm$r.squared`,
*F*(`r sm$fstatistic['numdf']`, `r sm$fstatistic['dendf']`) =
`r sm$fstatistic['value']`,
*t* = `r sm$coefficients[6]`,
*estimate* = `r sm$coefficients[2]`.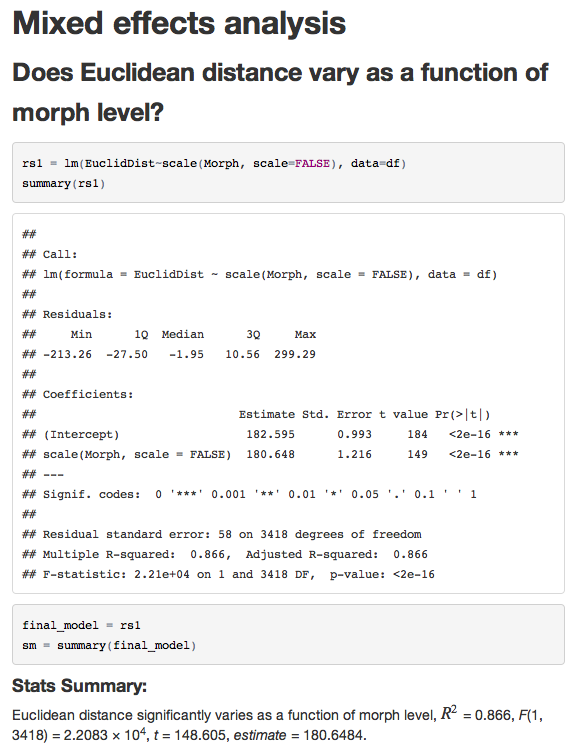
LaTeX style text & inline code
R Markdown
Interactive Documents
```{r, echo = FALSE}
sliderInput("morph", "Morph level:", min = 1, max = 3, value = 2)

renderPlot({
  # Subset data
  df_subset = df[df$Morph==input$morph,]

  # draw the histogram with the specified morph level
  with(df_subset, hist(Response,
                       col = 'darkgray',
                       border = 'white'))
})
```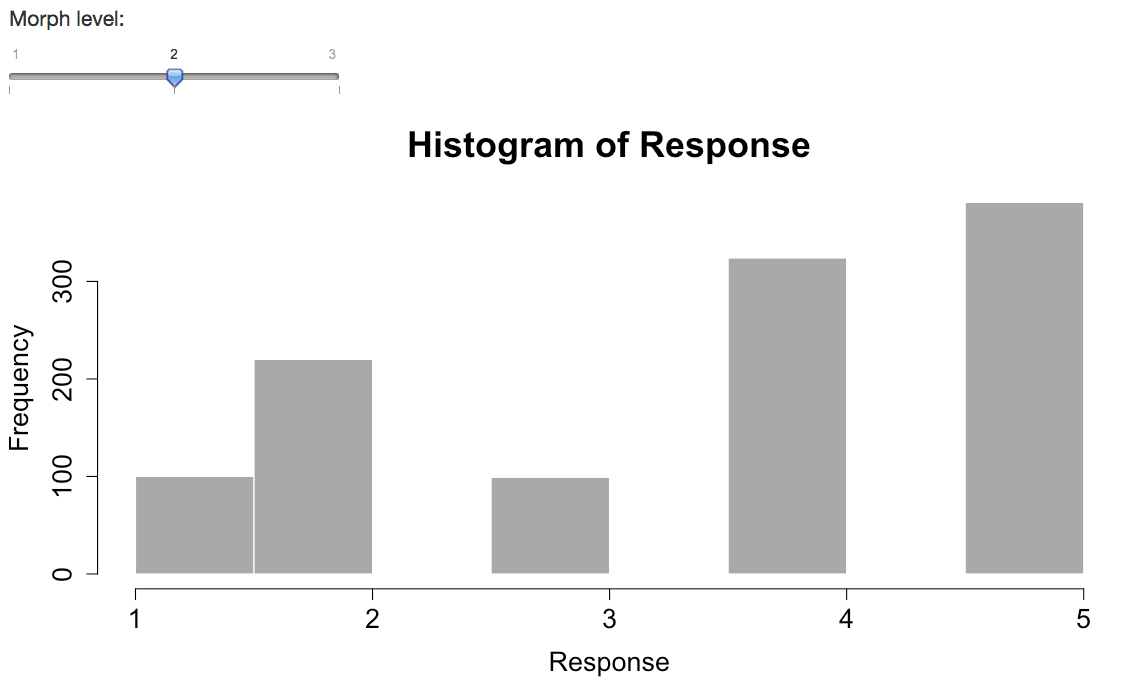
input to plot
R Markdown
-
Github (.Rmd)
- Collaboration with the .Rmd file
- Version control
How to share it?
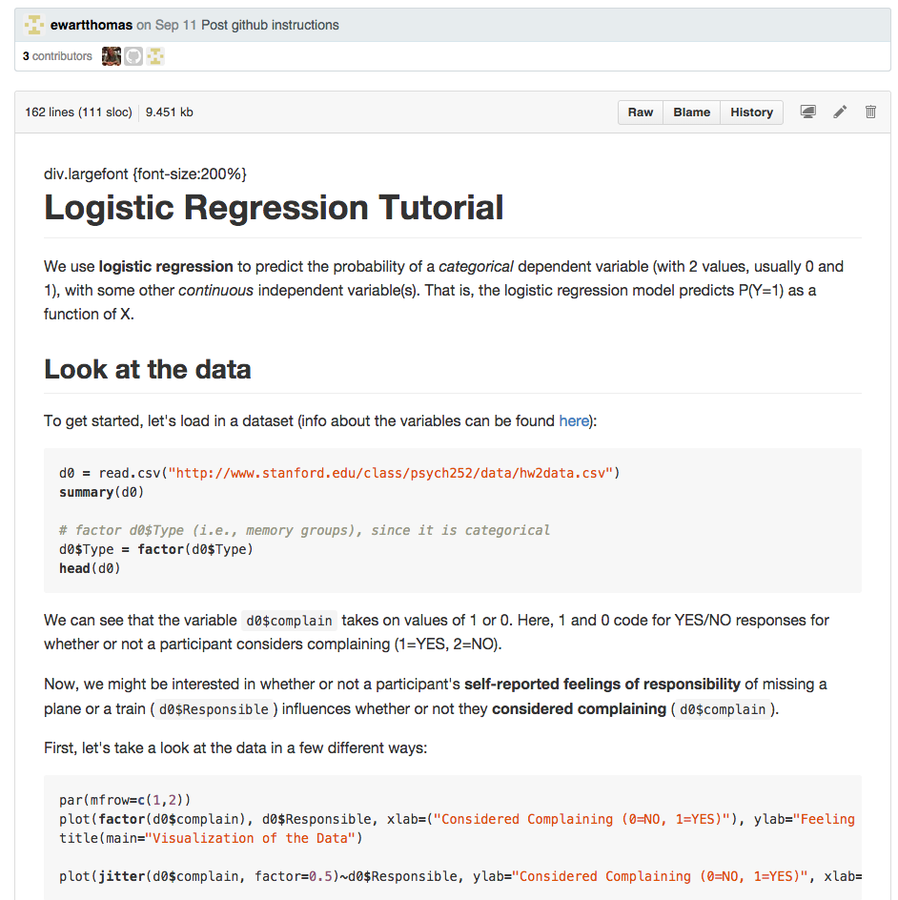
R Markdown
How to share it?
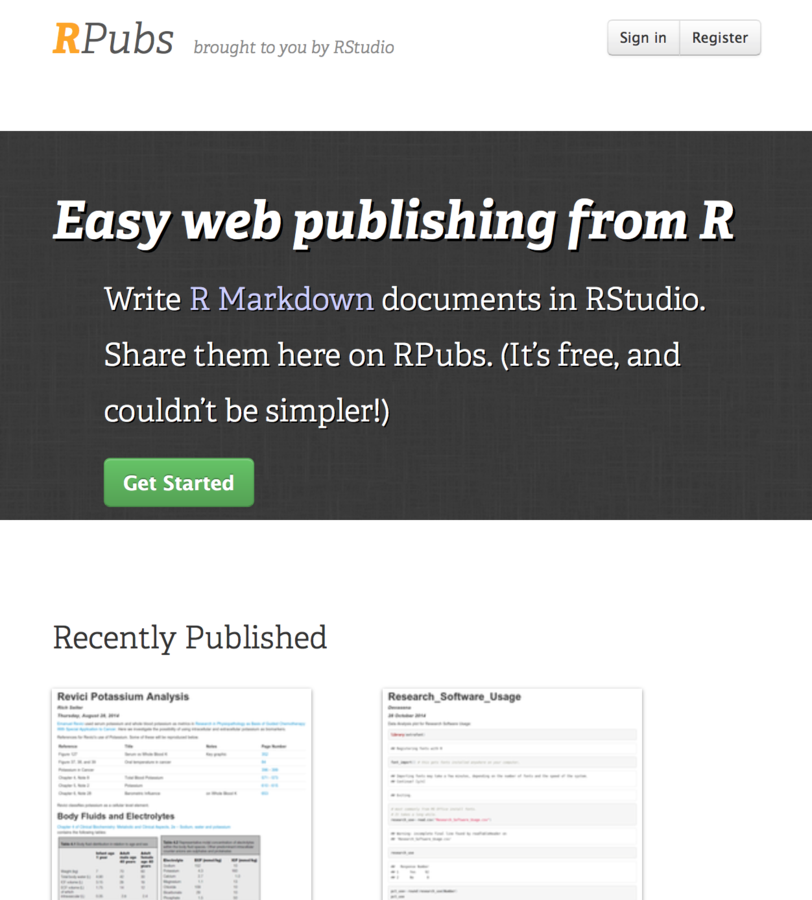
R Markdown
How to share it?
Hands-on Rmd tutorial:
R Tutorials
- Basic R data structures (vectors, lists, dataframes)
-
Manipulating dataframes
- integer/numeric vs. factor
- reshaping (long vs. short)
- accessing rows/columns
-
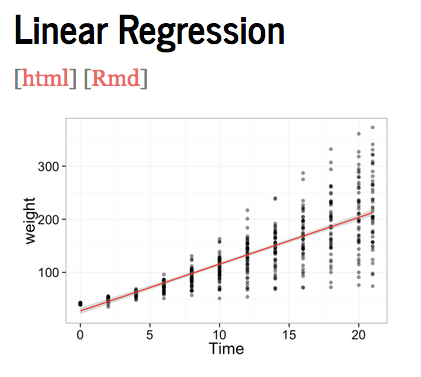
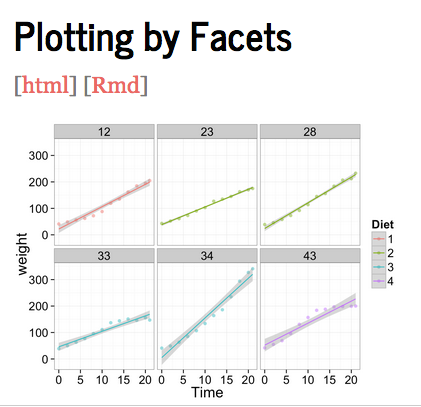
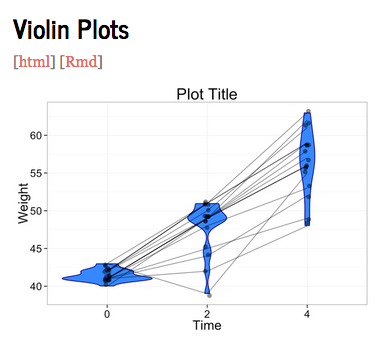
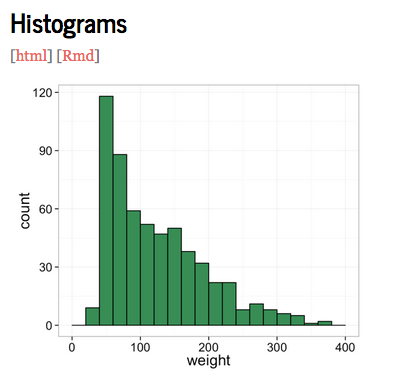
Plotting
- base graphics
- ggplot2
http://stanford.edu/class/psych252/tutorials/index.htmlBasics
R Tutorials
http://stanford.edu/class/psych252/plots/index.html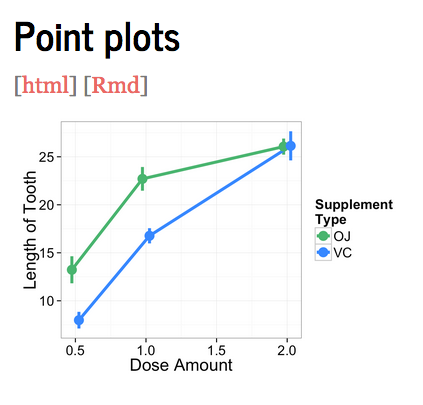
On the web
Thorough Tutorials:
Quick Resources:
Other:
R Tutorials
- Coursera Course: The Data Scientist's Toolbox
- Nov 3 - Dec 1 (3 hrs/week)
- Practical introduction to the tools like version control, markdown, git, GitHub, R, and RStudio.
On the web
R Tutorials
IPython Notebook
- Interactive environment where you can combine code, output, plots, images, markdown, in one document
- Allows use of all Python packages, including Pandas, scipy, numpy, nibabel, etc.
- Integrated with R using rpy2
- Easy plotting with matplotlib & Michael's seaborn package
- Easy to share documents with nbviewer
Why use it?
IPython Notebook
- Download/Install Anaconda
-
Install packages via pip
-
Make sure the environment variable PATH is set to the Anaconda location
How do you get it?
export PATH=~/anaconda/bin:$PATHpip install <package-name>IPython Notebook
- Open up a Terminal window, navigate to the location where you'd like the notebook stored, and type:
- The homepage for your current directory will open in the browser; click on a current notebook to open, or select New Notebook.
How do you use it?
ipython notebook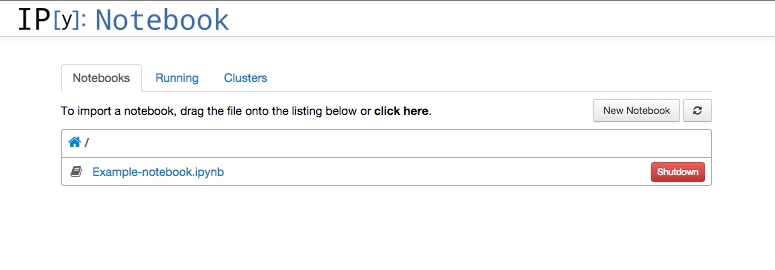
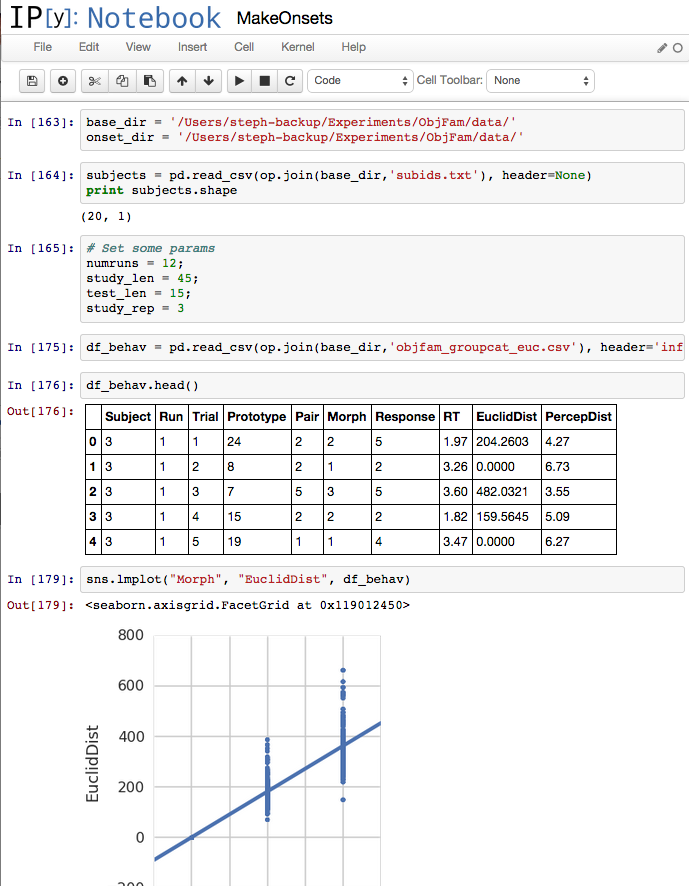
IPython
Examples
- Each block can be code (default), a heading, or markdown
- To execute code, click on the block and type: shift-return
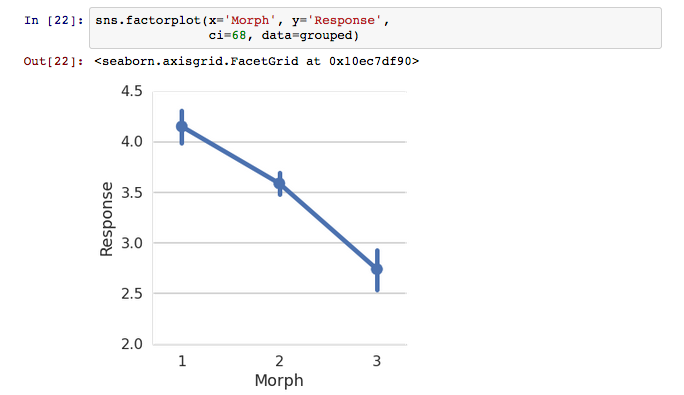
- For code completion: tab; for tooltips inside a function: shift-tab
- For more information: ??, e.g., sns.factorplot??
IPython
Examples
-
Command mode (esc)
- convert to markdown: m
- or to heading: 1,2,3...6
- select previous/next cell: up/down arrows
- new cell above/below: a/b
- delete cell: dd
- Edit mode (return)
IPython
Examples
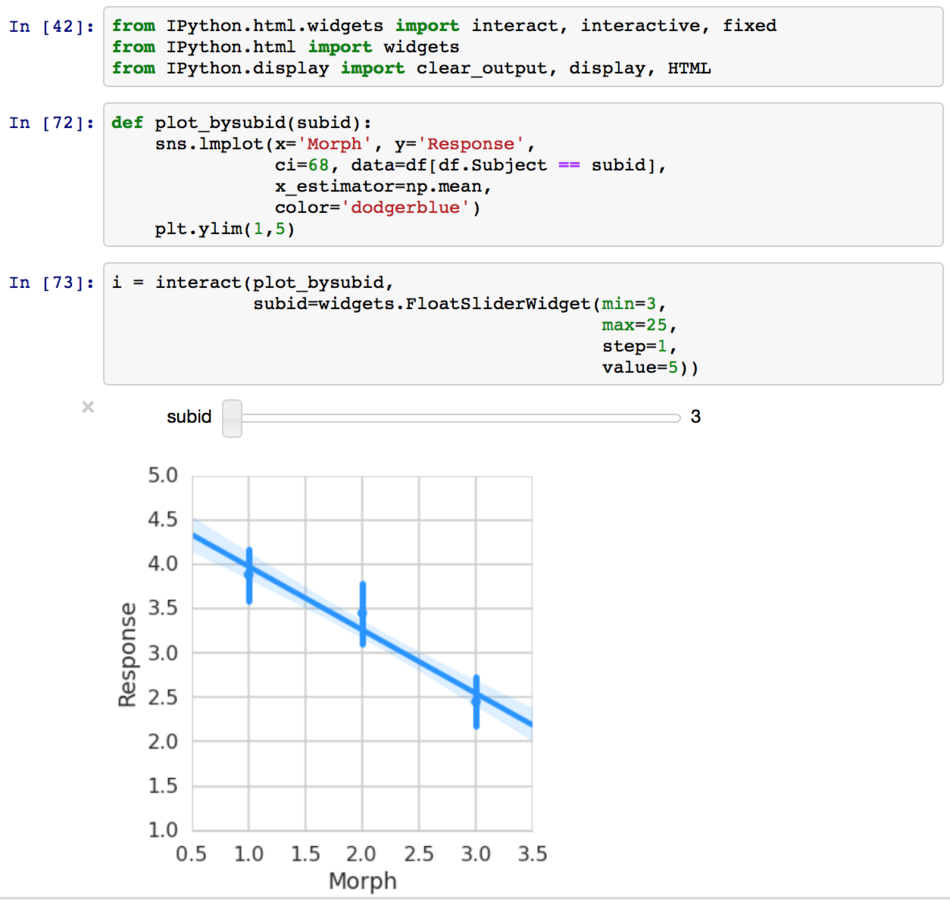
-
Interactive widgets
- Allows for interactive exploration of data within the notebook
IPython
Examples
-
-
R in Python
-
rpy2
- IPython magic integration
-
rpy2
-
R in Python
pip install rpy2# Load R extension
%load_ext rpy2.ipython
# Import dataframe df to R
%R -i df
# New code block:
%%R
print(str(df))
IPython
Examples
-
-
R in Python
-
rpy2
- IPython magic integration
-
Project Jupyter
- General notebooks running IPython, R, Julia, etc.
-
rpy2
-
R in Python
pip install rpy2IPython
Useful Packages
-
Pandas
- Open source library for data structures & data analysis
-
Numpy
- Efficient multi-D arrays
- Scientific computing tools
-
Matplotlib
- 2D plotting library, MATLAB-like interface
-
Seaborn (Michael)
- Statistical data visualization based on matplotlib
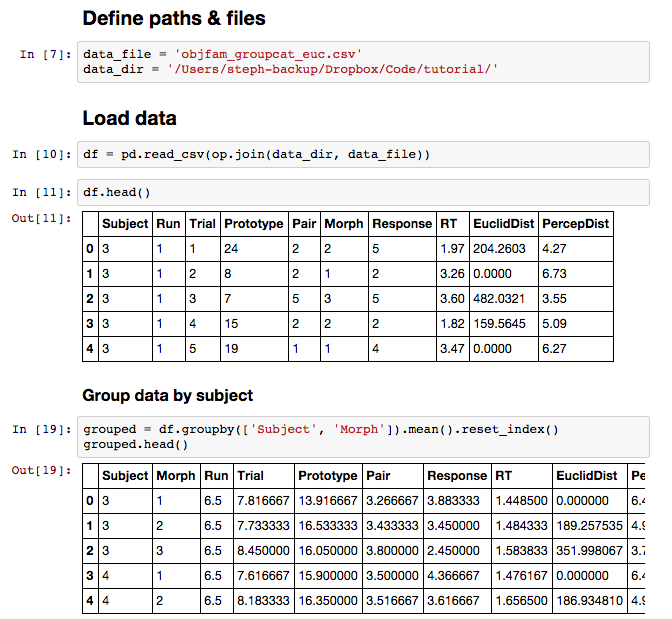
IPython
Pandas
- DataFrame object for easy data manipulation
- Flexible reshaping/pivoting of datasets
- Intelligent label-based slicing, subsetting of large datasets
- Merging/joining of multiple datasets
- Hierarchical indexing
- Tools for reading & writing data between different formats (CSV, text, excel, SQL)
Hands-on IPyNB tutorial:
NBViewer: html
Github: .ipynb file