Dataviz tools for daily journalistic routine
Krisztián Szabó · Rui Barros


atlatszo.hu
atlo.team
publico.pt
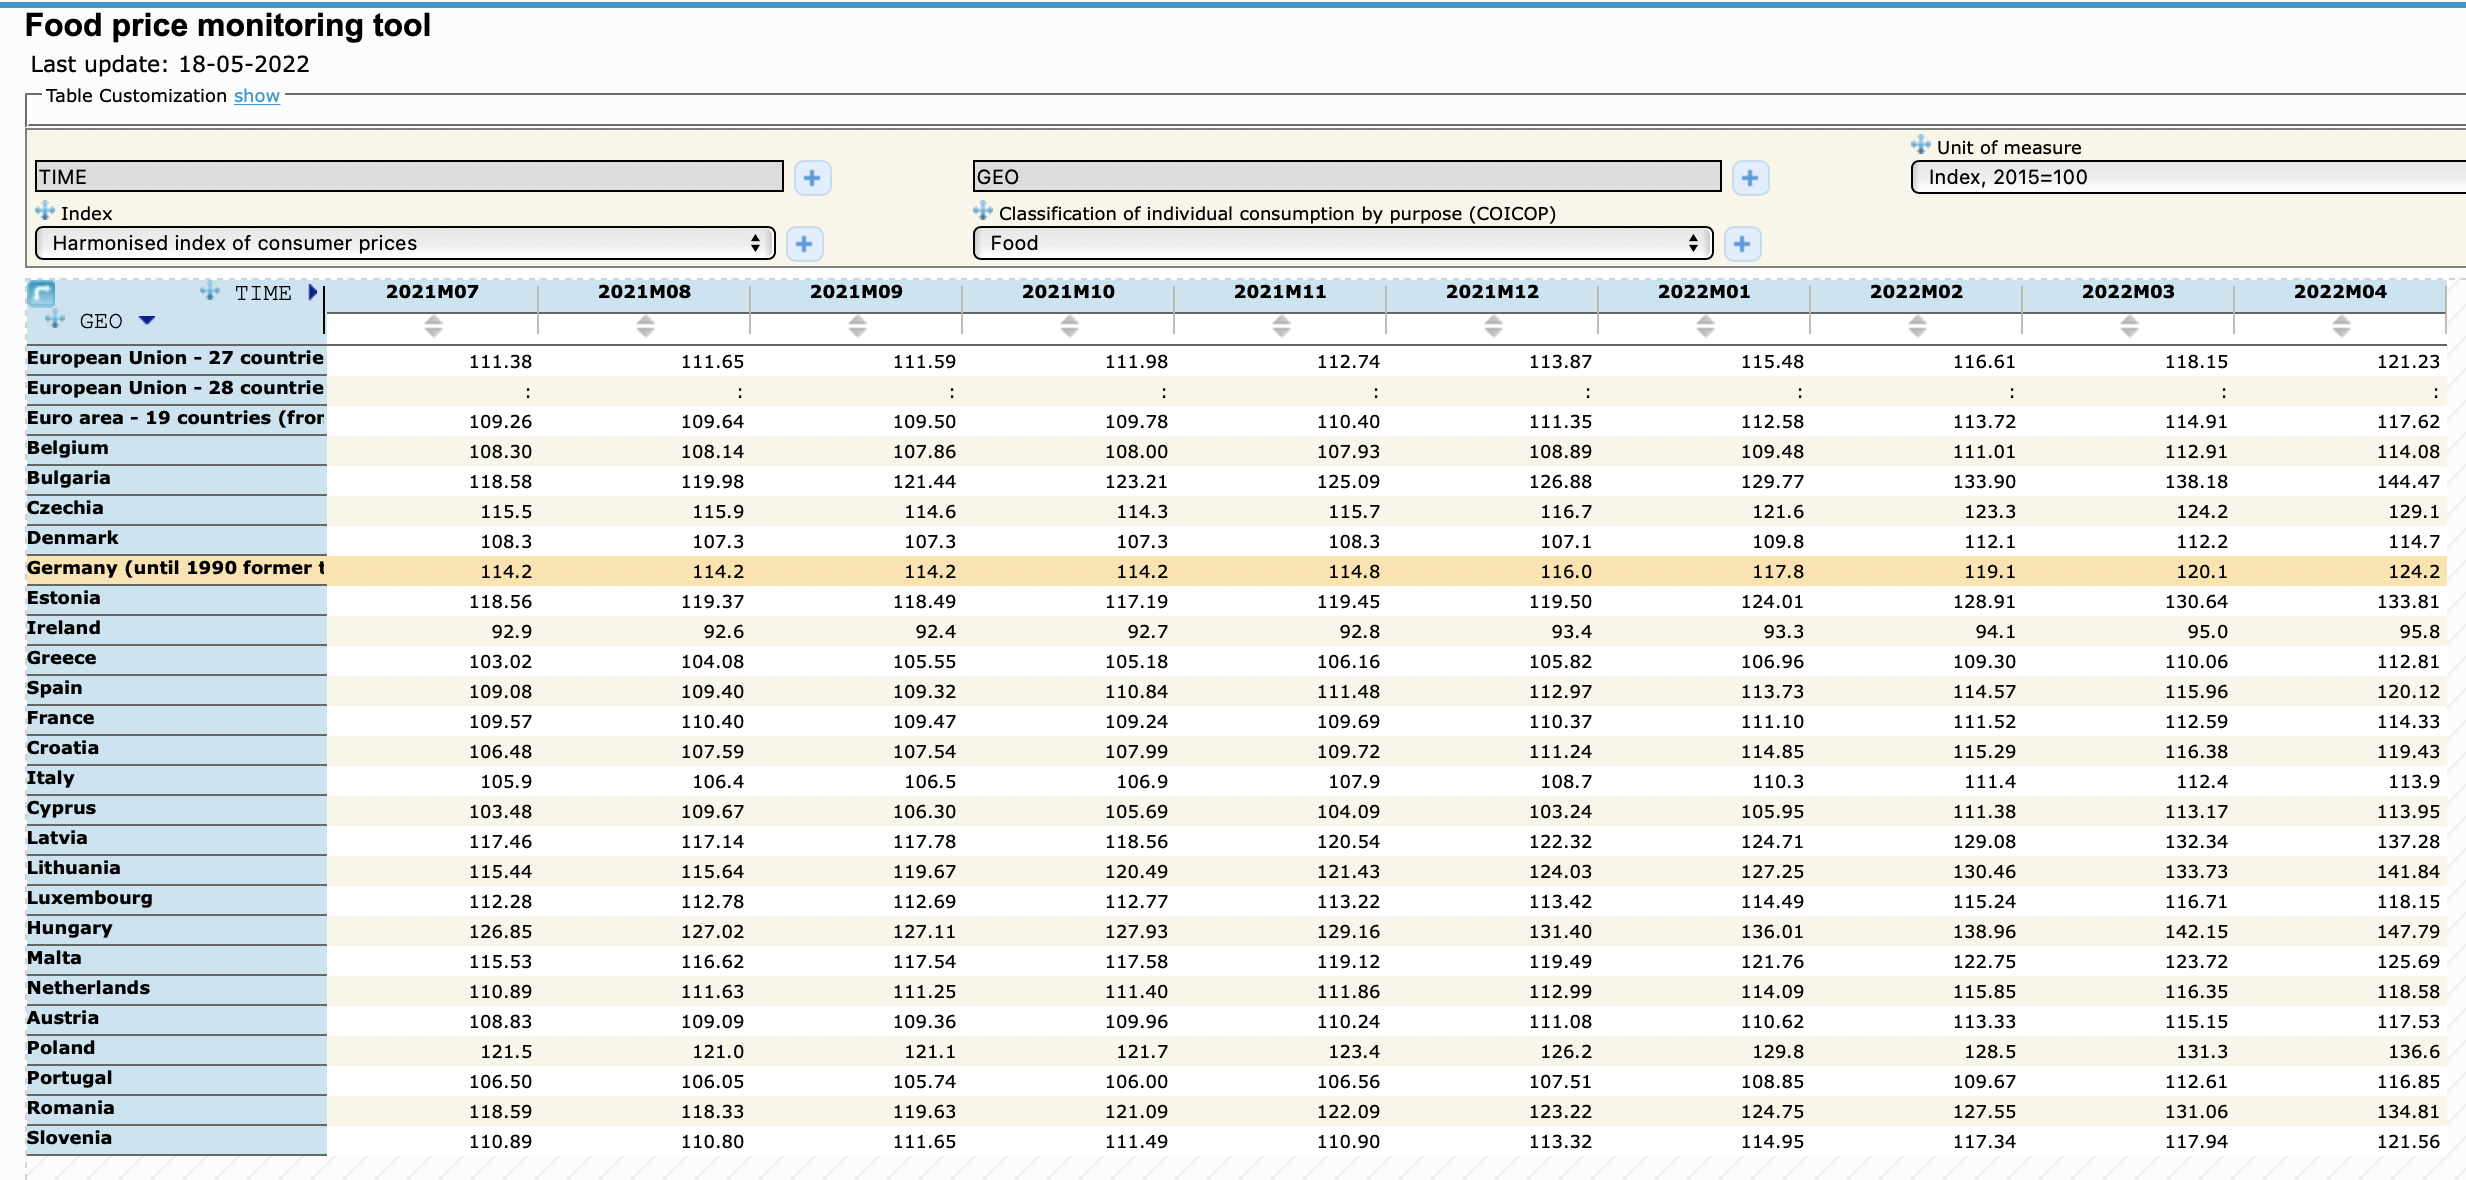
1. Show the data
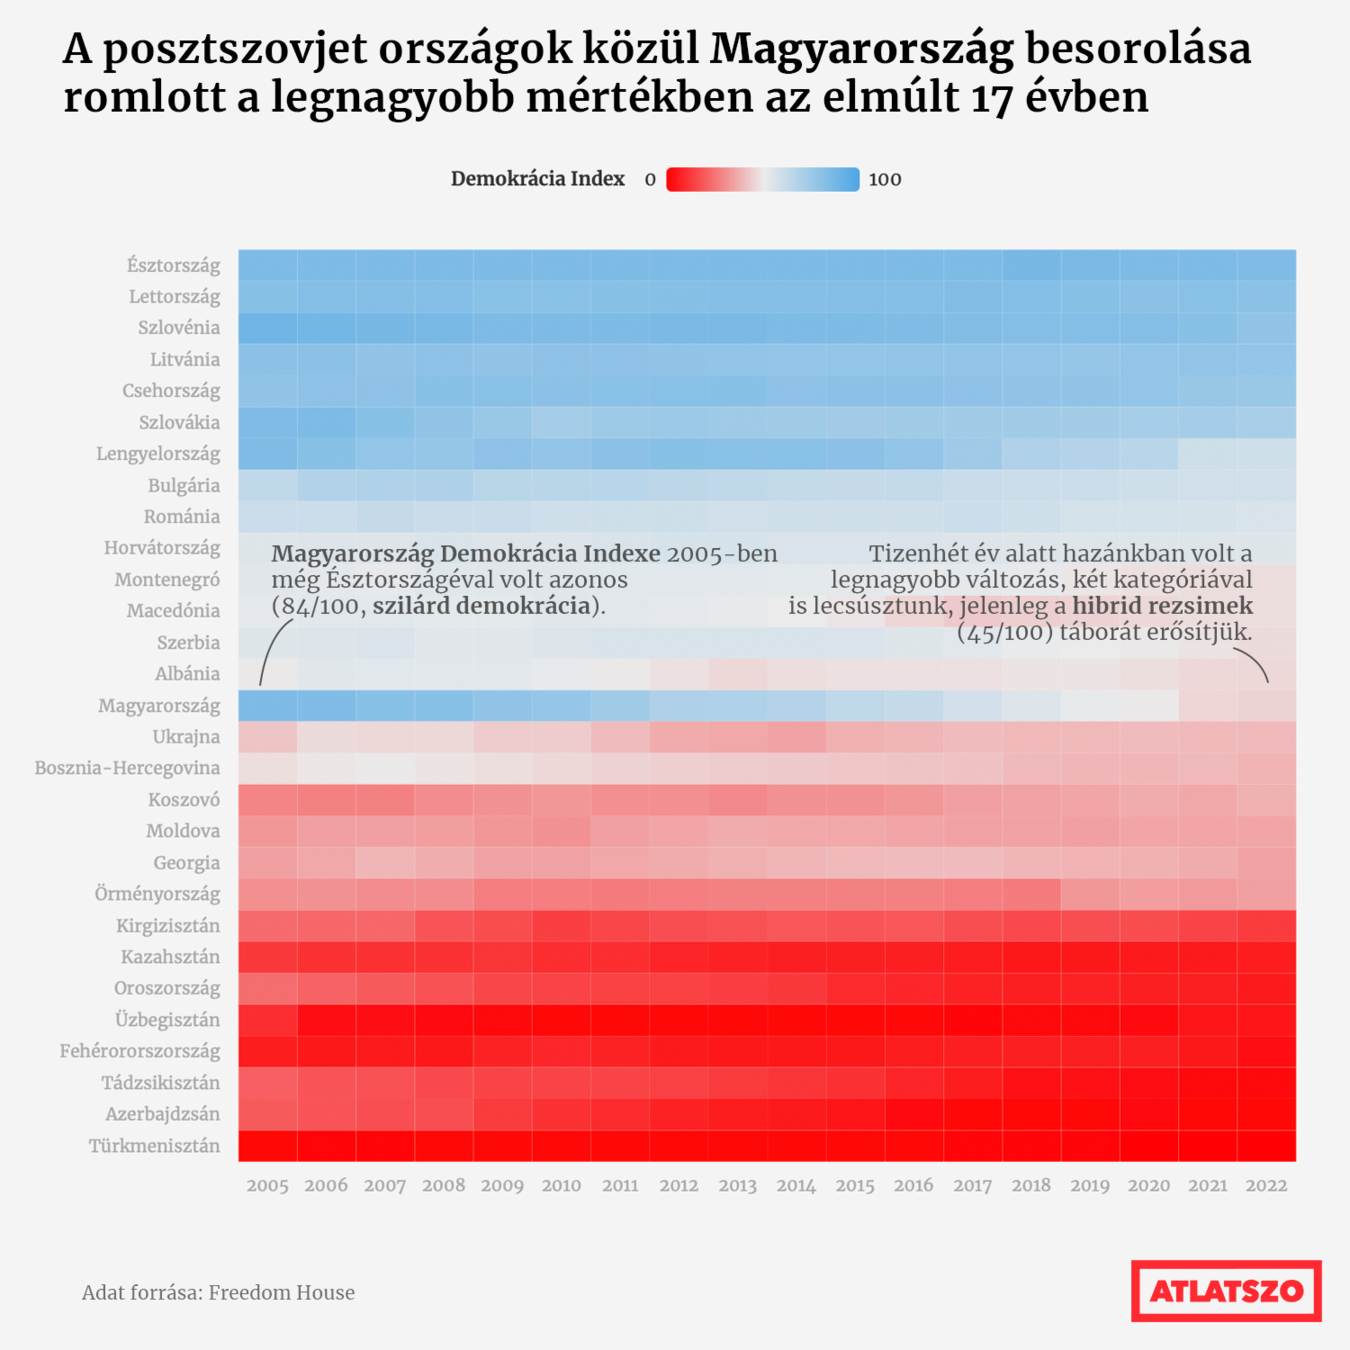
2. Reduce the clutter
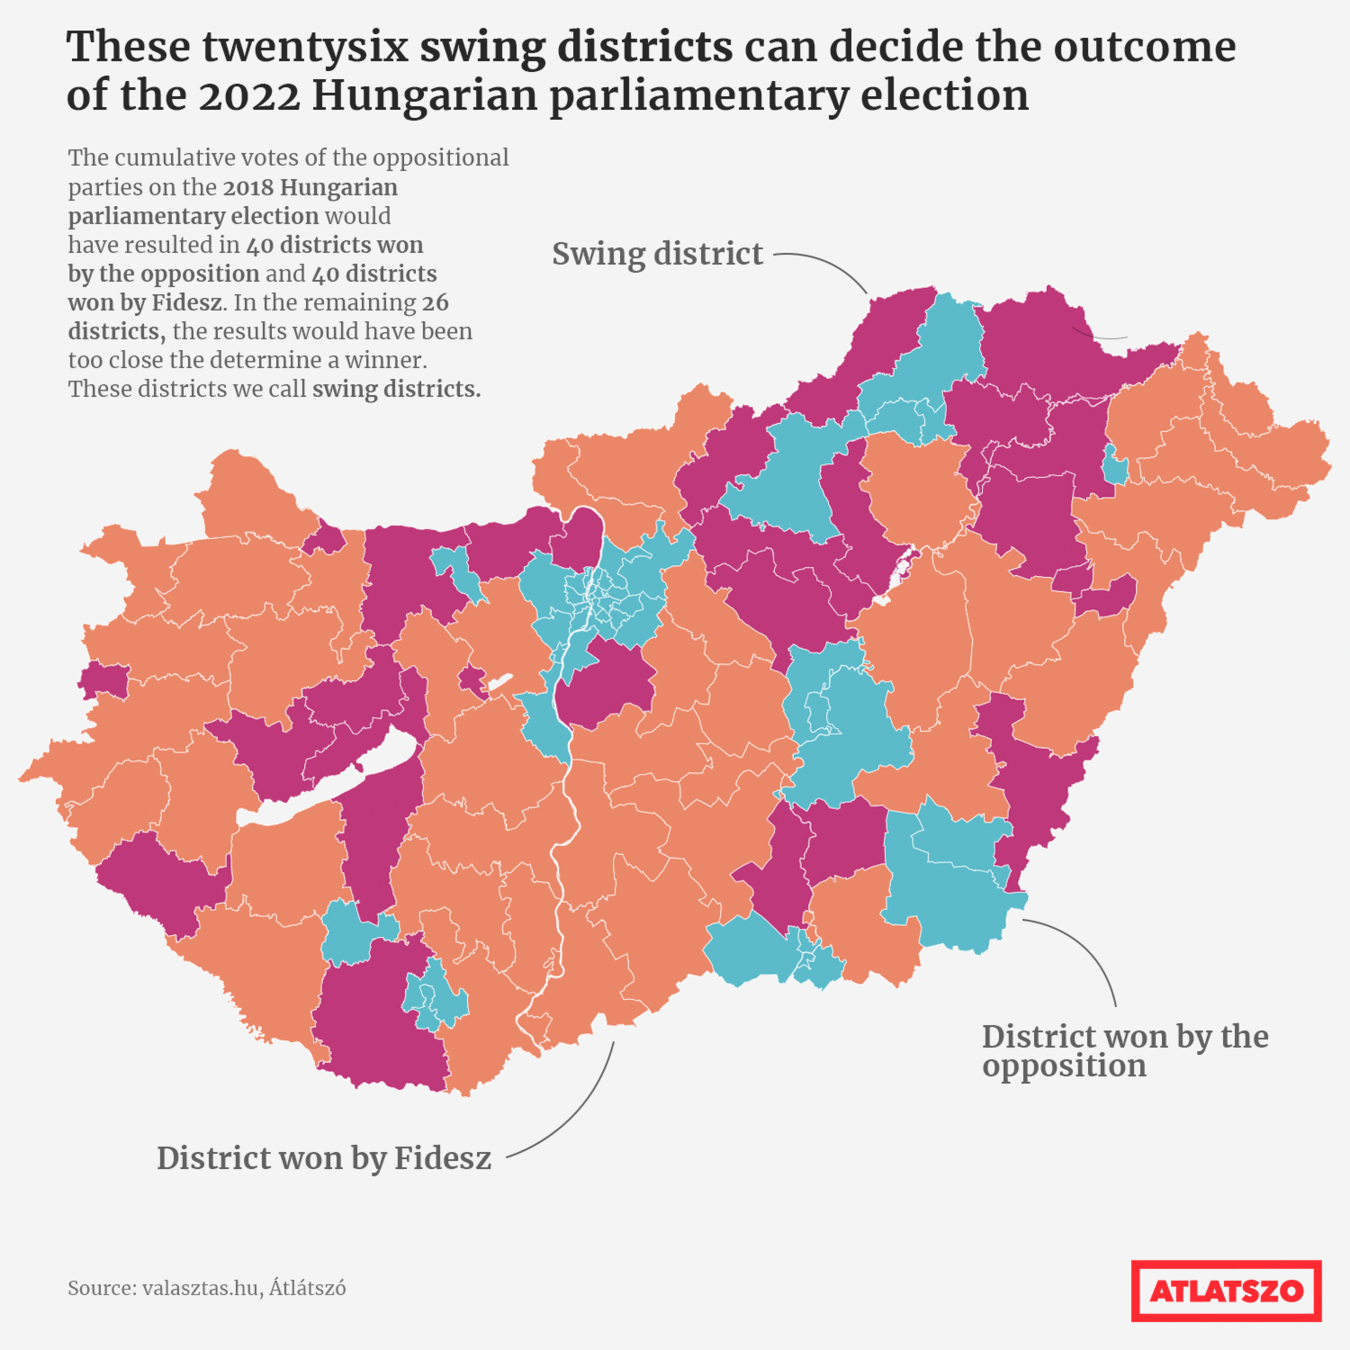
3. Integrate the graphics and text
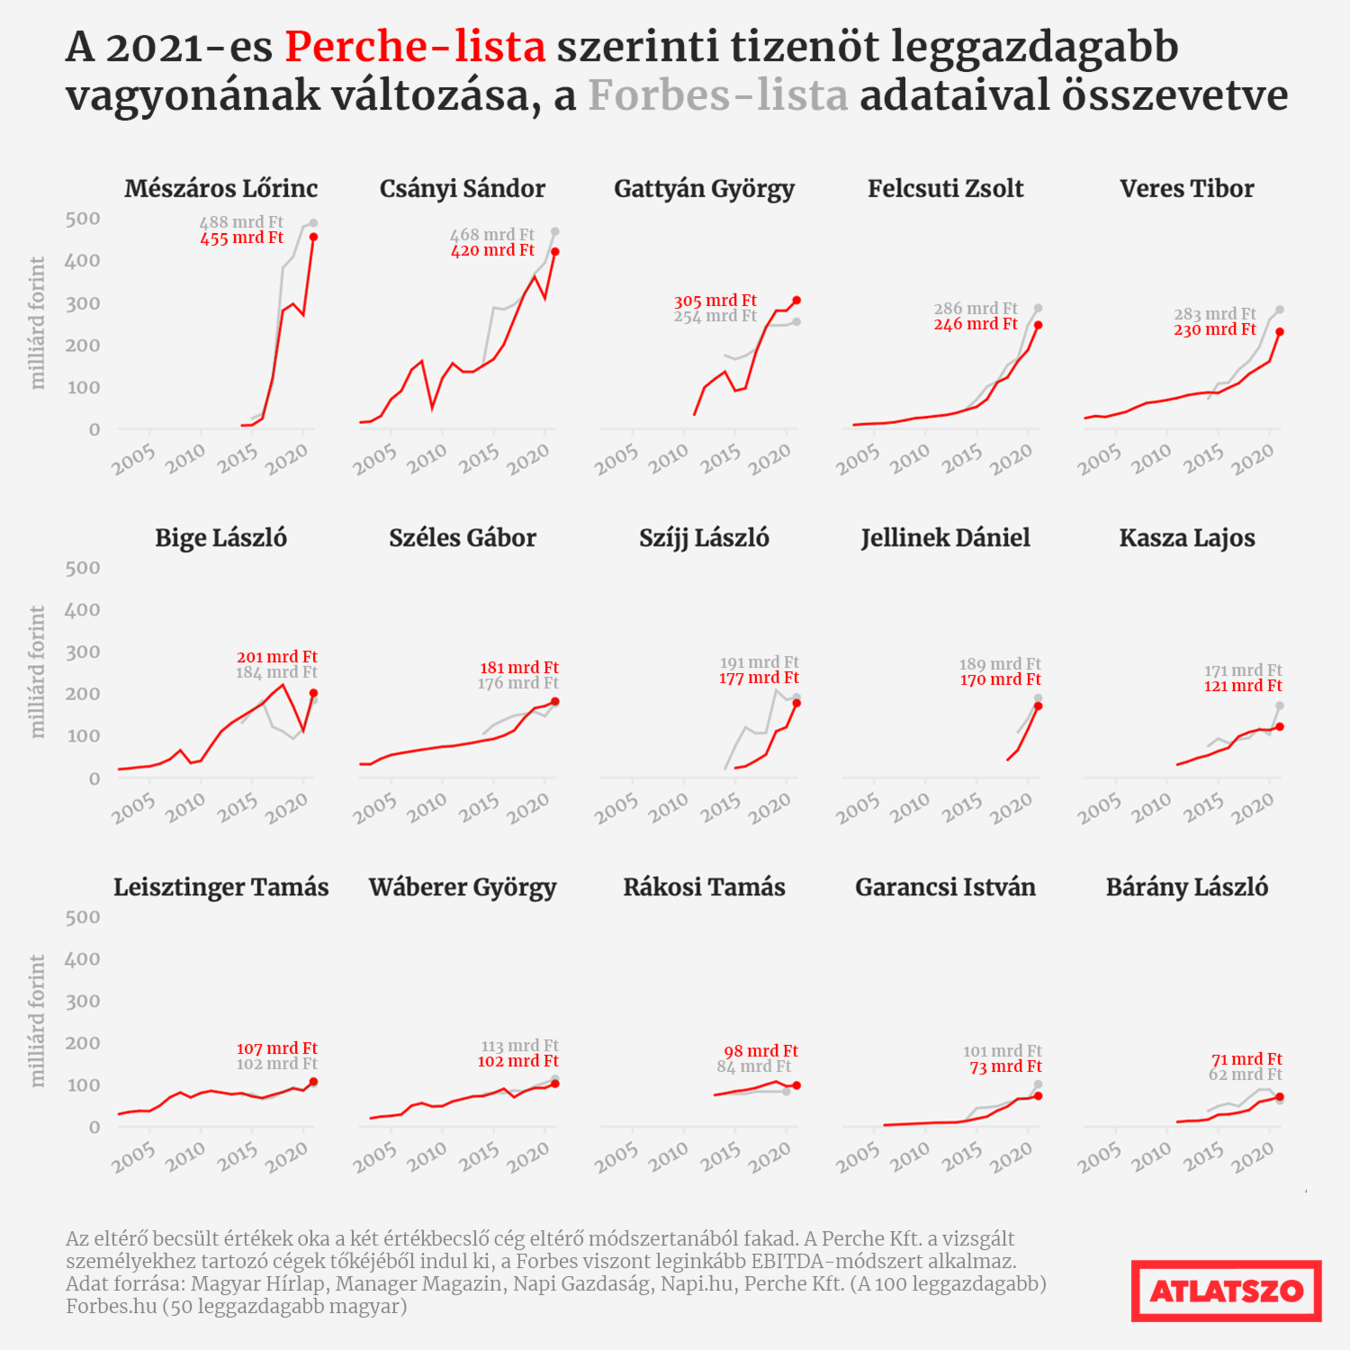
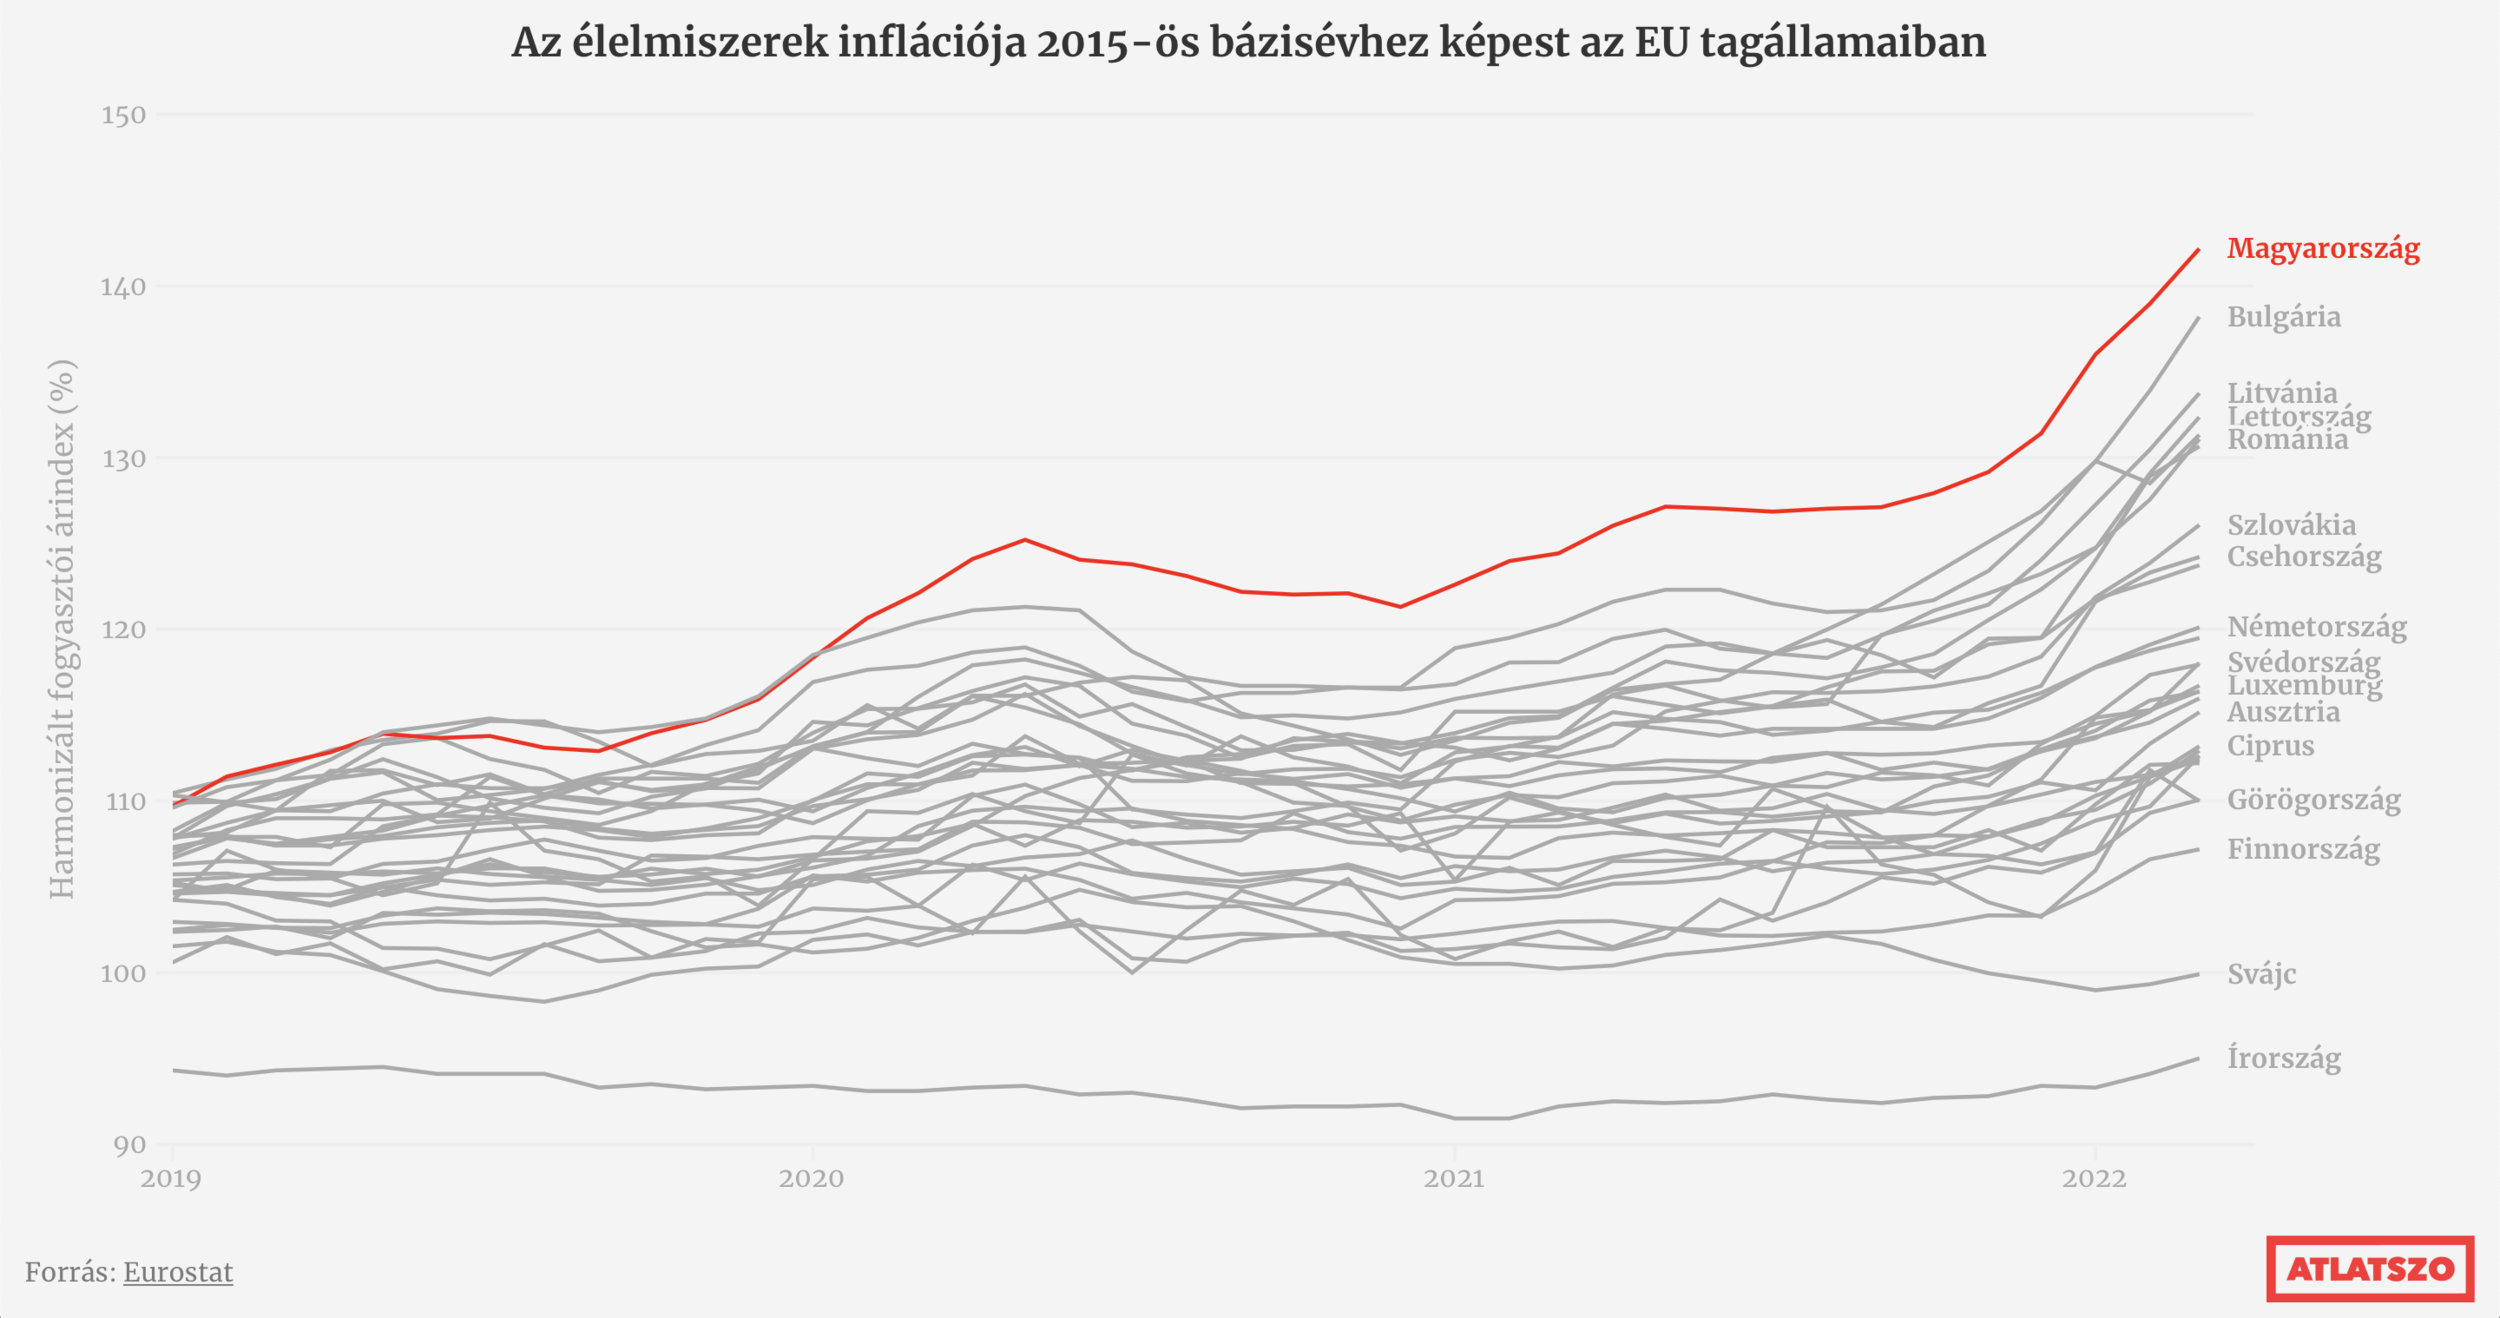
4. Avoid the spaghetti chart
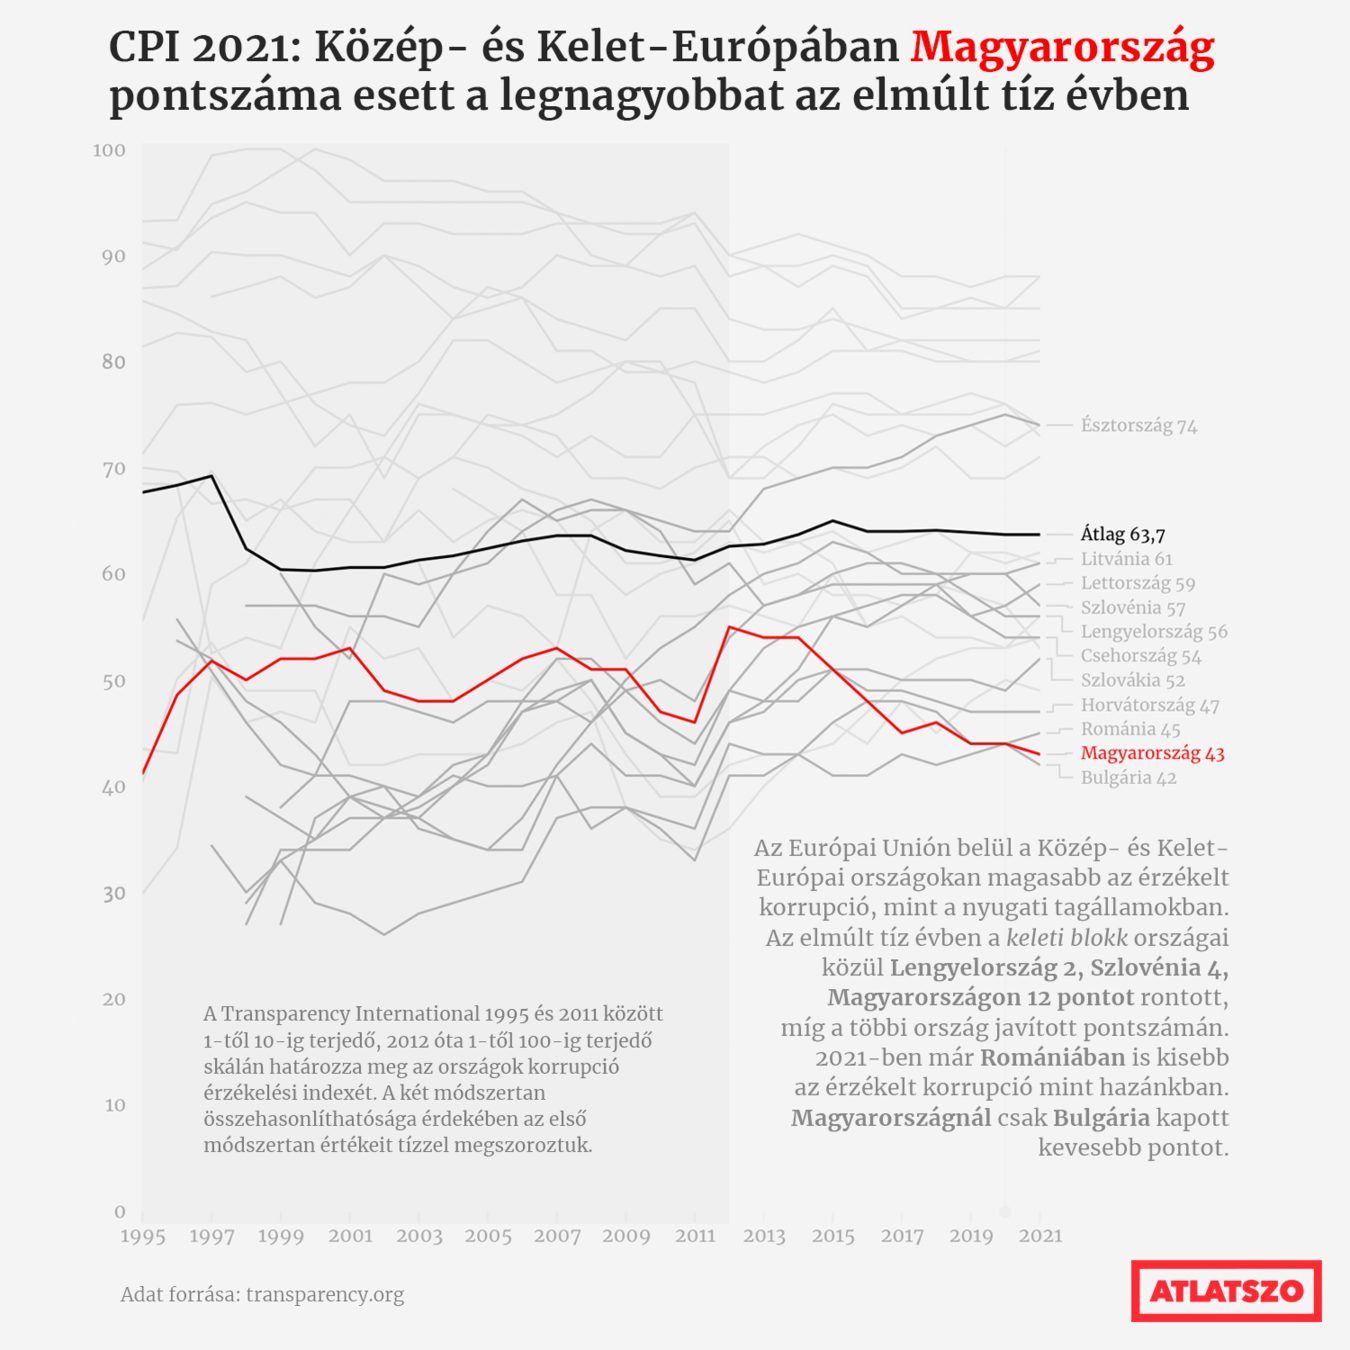
5. Start with gray

https://github.com/szkatlatszo/dataharvest