D3.js
Data-Driven Documents
So D3 is really about giving us an API that's well-suited for creating and updating the DOM based on our data - hence the name Data-Driven Documents.
- Low-level JavaScript visualization Library
- Uses HTML, CSS and SVG
- Works with modern browsers*
- Data-driven DOM manipulation
D3.js is a JavaScript library for manipulating documents based on data. D3 helps you bring data to life using HTML, SVG, and CSS. D3’s emphasis on web standards gives you the full capabilities of modern browsers without tying yourself to a proprietary framework, combining powerful visualization components and a data-driven approach to DOM manipulation.
*Backwards-compatibility for older browsers can be provided by Sizzle.
Examples
d3.select("body")
    .append("p")
    .text("New paragraph!");
Adding Elements
<body>

</body>
<body>
    <p>New paragraph!</p>
</body>
var dataset = [ 5, 10, 15, 20, 25 ];

d3.select("body").selectAll("p")
    .data(dataset)
    .enter()
    .append("p")
    .text(function(d) { return d; });
Data
<body>

</body>
<body>
    <p>5</p>
    <p>10</p>
    <p>15</p>
    <p>20</p>
    <p>25</p>
</body>
.text("someString")


.text(someFunction())


.text(function(d) {
    return d;
})
For example, text() can take either simply a static string of text as an argument.
…or the result of a function.
…or an anonymous function itself can be the argument.
var dataset = [ 5, 10, 15, 20, 25 ];

d3.select("body").selectAll("div")
    .data(dataset)
    .enter()
    .append("div")
    .attr("class", "bar")
    .style("height", function(d) {
        var barHeight = d * 5;  //Scale up by factor of 5
        return barHeight + "px";
    });
<body>
<div class="bar" style="height: 25px;"></div>
<div class="bar" style="height: 50px;"></div>
<div class="bar" style="height: 75px;"></div>
<div class="bar" style="height: 100px;"></div>
<div class="bar" style="height: 125px;"></div>
</body>

// Update…
var p = d3.select("body").selectAll("p")
    .data([4, 8, 15, 16, 23, 42])
    .text(String);

// Enter…
p.enter().append("p")
    .text(String);

// Exit…
p.exit().remove();
SVG
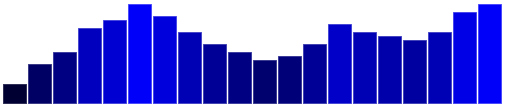
Using a SVG instead of native HTML elements is more reliable, visually consistent, and faster.
var w = 500;
var h = 100;
var barPadding = 1;

var dataset = [ 5, 10, 13, 19, 21, 25, 22, 18, 15, 13,
				11, 12, 15, 20, 18, 17, 16, 18, 23, 25 ];

//Create SVG element
var svg = d3.select("body")
	    .append("svg")
	    .attr("width", w)
    	    .attr("height", h);

svg.selectAll("rect")
   .data(dataset)
   .enter()
   .append("rect")
   .attr("x", function(d, i) {
   		return i * (w / dataset.length);
   })
   .attr("y", function(d) {
   		return h - (d * 4);
   })
   .attr("width", w / dataset.length - barPadding)
   .attr("height", function(d) {
   		return d * 4;
   })
   .attr("fill", function(d) {
		return "rgb(0, 0, " + (d * 10) + ")";
   });
Maps
function draw(geo_data) {
  "use strict";
  var width = 750,
      height = 600,
      scale = 6500,
      translateX = -240,
      translateY = 7260;

  var projection = d3.geo.mercator()
      .scale(scale)
      .translate( [translateX, translateY]);

  var path = d3.geo.path().projection(projection);

  var svg = d3.select("#chart")
      .append("svg")
        .attr("width", width)
        .attr("height", height)
        .attr("class", "map");

  var map = svg.selectAll("path")
      .data(geo_data.features)
      .enter()
      .append("path")
        .attr("d", path)
        .style("fill", "lightBlue")
        .style("stroke", "black")
        .style("stroke-width", 0.5);
};

d3.json("provinces.geojson", draw);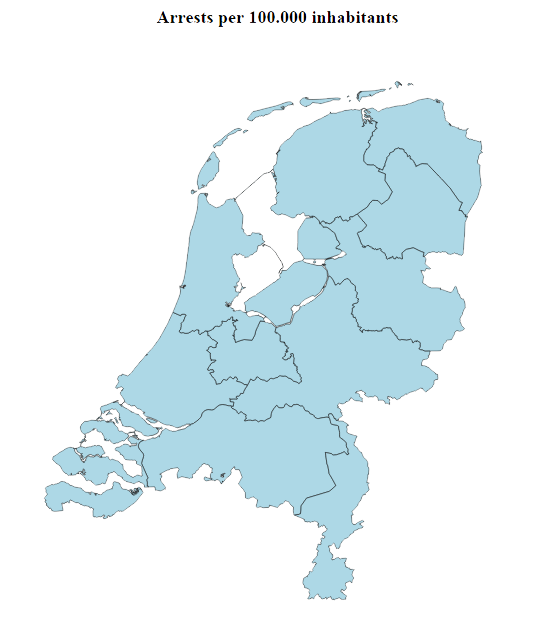
Resources
Pros
- Low level library => very customizable
- Free
- No dependencies
- Build upon web standards of HTML, CSS, JS and SVG
Cons
- Documentation not very detailed
- No prebuilded charts or maps added
- Steep learning curve