
Dress up your Data: an Introduction to D3.js

6:00 - 6:20 Food & Networking
6:20 - 7:20 Presentation
WIFI: Kenzan Guest
p: welcometokenzan
Dress up your Data: an Introduction to D3.js
Tim Mendoza
Front End Developer
What is D3.js?
- Data-driven documents
- A collection of JavaScript modules
- Modify document (DOM) attributes based on data

- Expressive
- Large diversity of possible visualizations
What's cool about D3.js
- It sits on top of web standards
- Declarative API
- Transparent, easy to debug
What's not so cool about D3.js
- Requires good working knowledge of HTML, CSS, SVG, and JavaScript (but learning about this is cool!)
- Steeper learning curve
- Takes more time to implement
SVG Basics
<svg width="400" height="250">
  <g transform="translate(10, -5)">
    <line x1="50" y1="75" x2="150" y2="200" stroke="red"></line>
    <rect x="175" y="30" width="40" height="125" fill="green" stroke="black" stroke-width="1"></rect>
    <rect x="250" y="30" width="40" height="125" fill="green" stroke="black" stroke-width="20"></rect>
    <circle cx="150" cy="130" r="45" fill="transparent" stroke="blue" stroke-width="15"></circle>
    <path
      d="M10 80 C 40 10, 65 10, 95 80 S 150 150, 180 80"
      stroke="orange"
      fill="transparent"
      transform="translate(170, 50)"
    />
    <text x="240" y="200">Text!!</text>
    <foreignObject x="180" y="180">
      <span>Span!!</span>
    </foreignObject>
  </g>
</svg>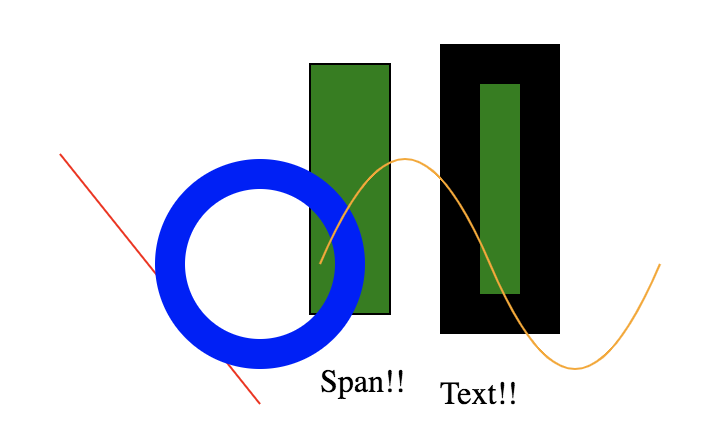
SVG Coordinates
<svg width="600" height="300">
</svg>
(0, 0)
(600, 0)
(0, 300)
(0, 0)
<g transform="translate(300, 150)">
</g>
+
+
<svg>
  <rect></rect>
  <rect></rect>
  <rect></rect>
  <rect></rect>
  <rect></rect>
</svg>
var rects = document.querySelectorAll('rect')

rects.forEach((rect, i) => {
  rect.setAttribute('x', 0)
  rect.setAttribute('y', i * 20)
  rect.setAttribute('width', (i + 1) * 30)
  rect.setAttribute('height', 20)
  rect.setAttribute('stroke', 'white')
})
$('rect')
.attr('x', 0)
.attr('y', i => i * 20)
.attr('width', i => (i + 1) * 30)
.attr('height', 20)
.attr('stroke', 'white')d3.selectAll('rect')
.attr('x', 0)
.attr('y', (d, i) => i * 20)
.attr('width', (d, i) => (i + 1) * 30)
.attr('height', 20)
.attr('stroke', 'white')Vanilla:
jQuery:
d3.js:
DOM Manipulation
DOM Manipulation - with data!
// Select first matching element
d3.select('.mySelector');

// Select all matching elements
d3.selectAll('.mySelectors');
selection.selectAll('.newSelector');
selection.select('.newSelector');
selection.data(someArray);
selection.filter(d => d.value > 100);
selection.merge(otherSelection);
selection.attr('x', d => d.value);
selection.style('opacity', d => d.confidence);
selection.text(d => d.name);
selection.classed('isVisible', d => d.isVisible);
selection.on('click', function(d) { ... });
selection.property('checked', d => d.checked);
selection.html('<span></span>')
selection.append('rect')
selection.remove()
d3-selection
Selections
Operators
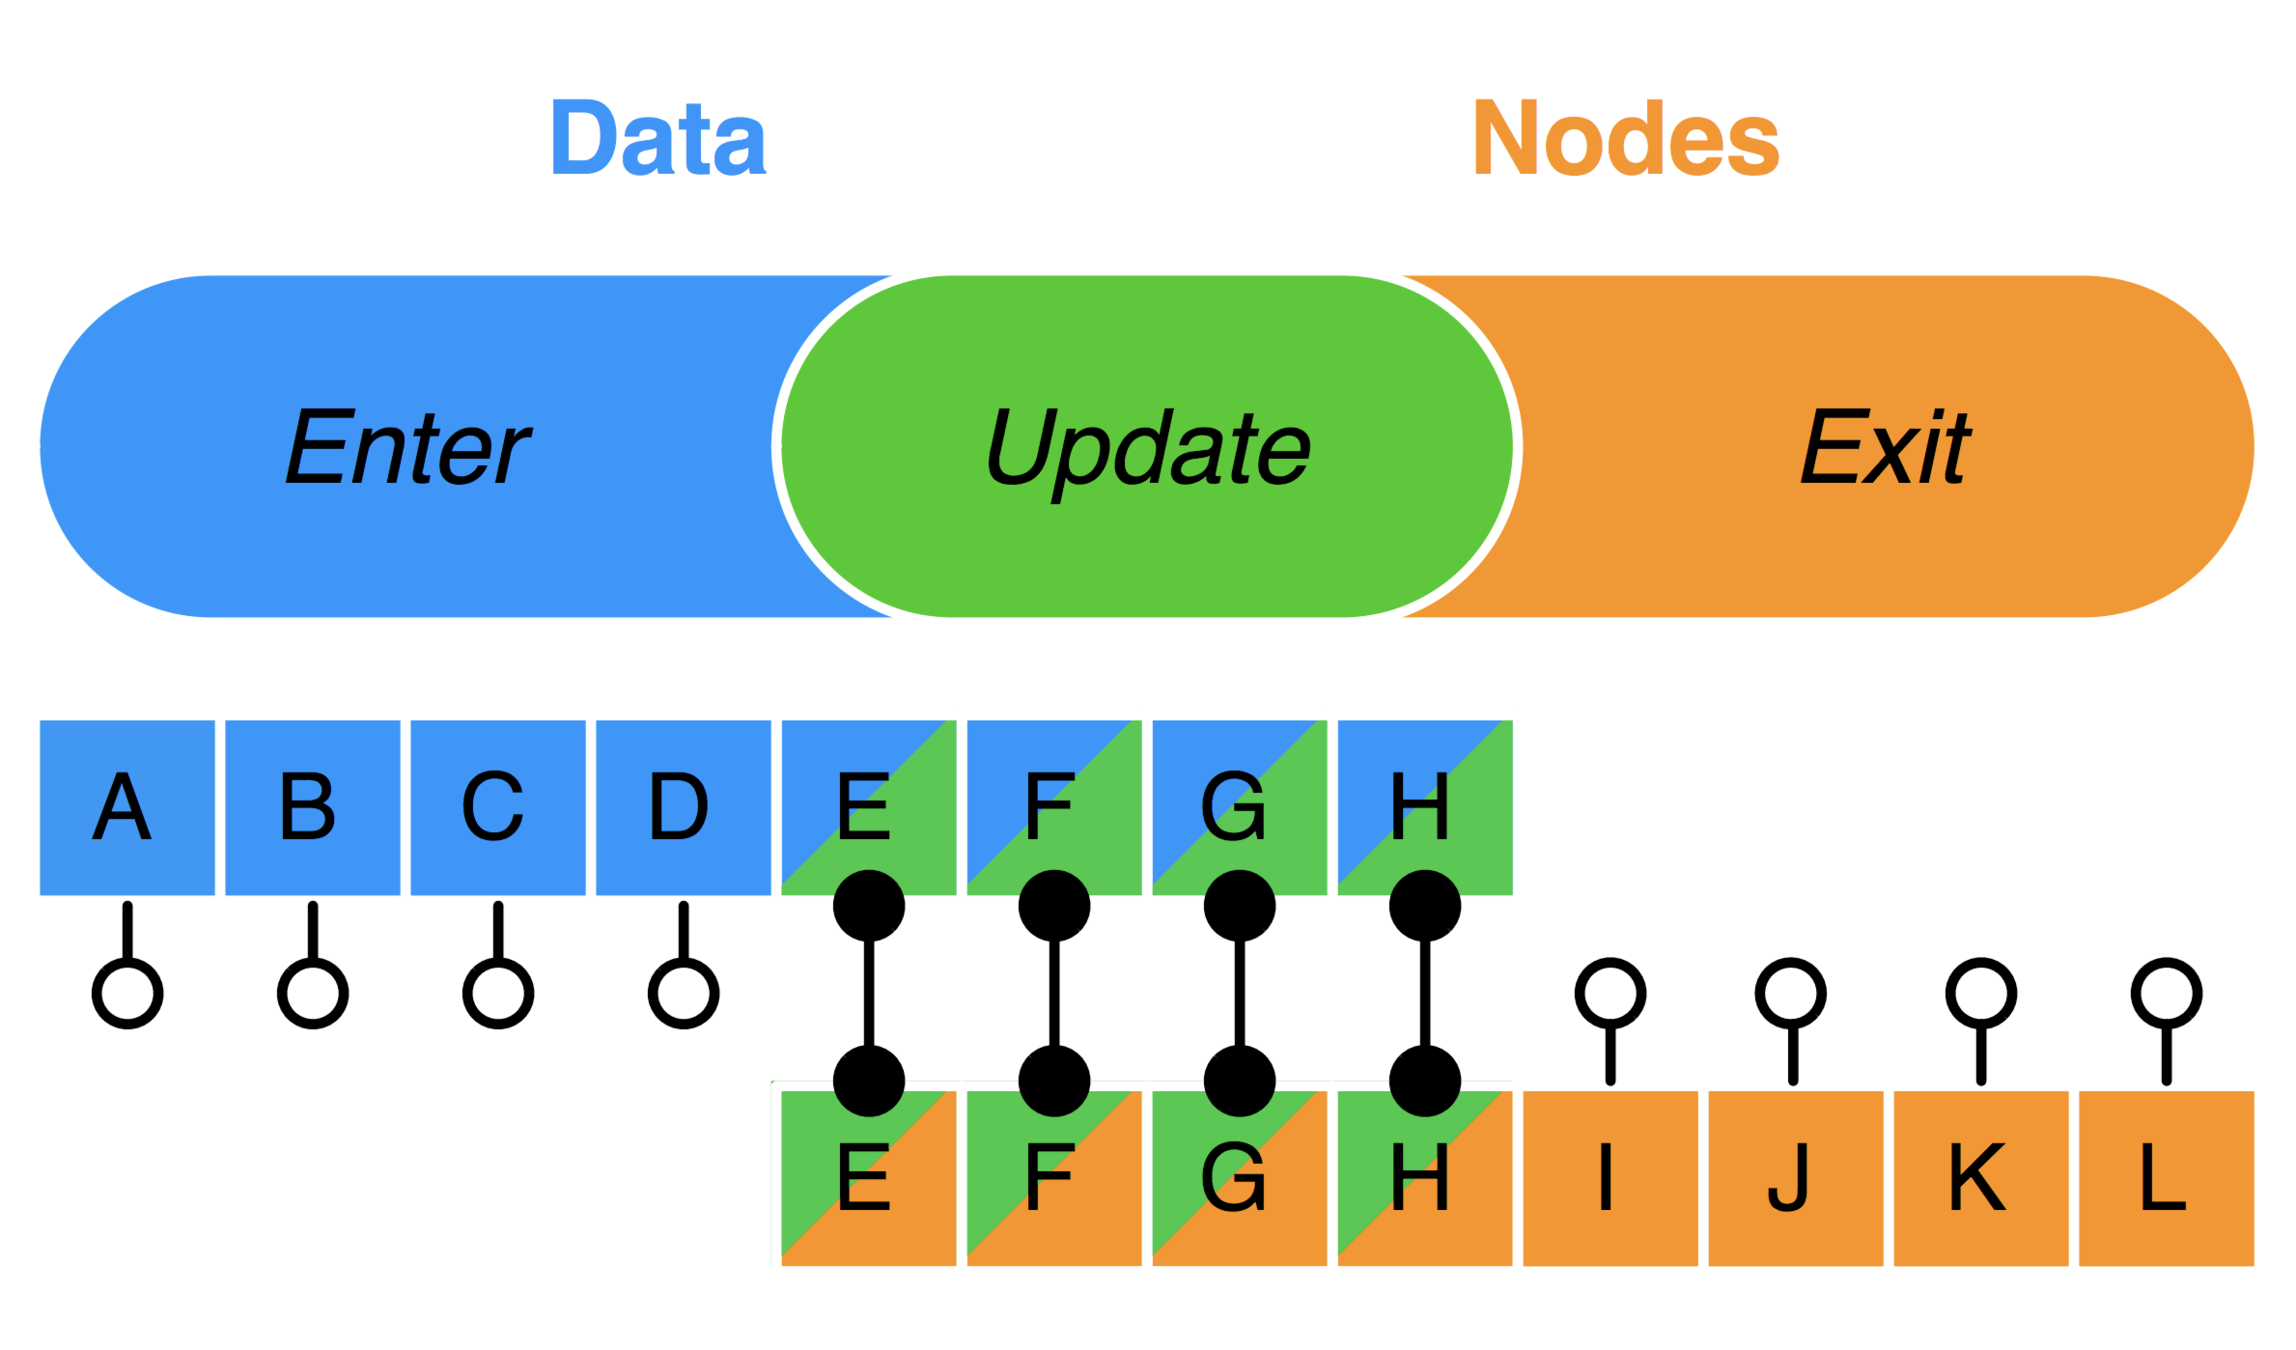
The Data Join
const rects = d3.selectAll('rect').data([1, 2, 3]);

// Update
rects

// Enter
rects.enter()

// Exit
rects.exit()
const circles = d3.selectAll('circle').data(data);
// Update
circles
.attr('r', d => d.radius)
// Enter
circles
.enter()
.append('circle')
.attr('r', d => d.radius)
.attr('cx', d => d.x)
.attr('cy', d => d.y);
// Exit
circles
.exit()
.remove()General Update Pattern
d3 Module Ecosystem
d3-array
d3-axis
d3-brush
d3-chord
d3-collection
d3-color
d3-contour
d3-dispatch
d3-drag
d3-dsv
d3-ease
d3-fetch
d3-force
d3-format
d3-geo
d3-geo-polygon
d3-geo-projection
d3-hierarchy
d3-interpolate
d3-path
d3-polygon
d3-quadtree
d3-random
d3-sankey
d3-scale
d3-scale-chromatic
d3-selection
d3-shape
d3-time
d3-time-format
d3-timer
d3-transition
d3-voronoi
d3-zoom
d3-scale
32ºF
90ºF
600px
0px
let xScale = d3.scaleLinear()
               .domain([32, 90])
               .range([0, 600]);
xScale(32) // 0
xScale(60) // 289.65
xScale.invert(600) // 90
xScale.invert(450) // 75.5
d3-axis
d3-axis + d3-zoom
How to build a bar chart
Start Simple
Add data
Add scale
Apply general update pattern
Add axes
Add transitions
Connect to real data
d3-force
Forces are additive
Forces can display trees
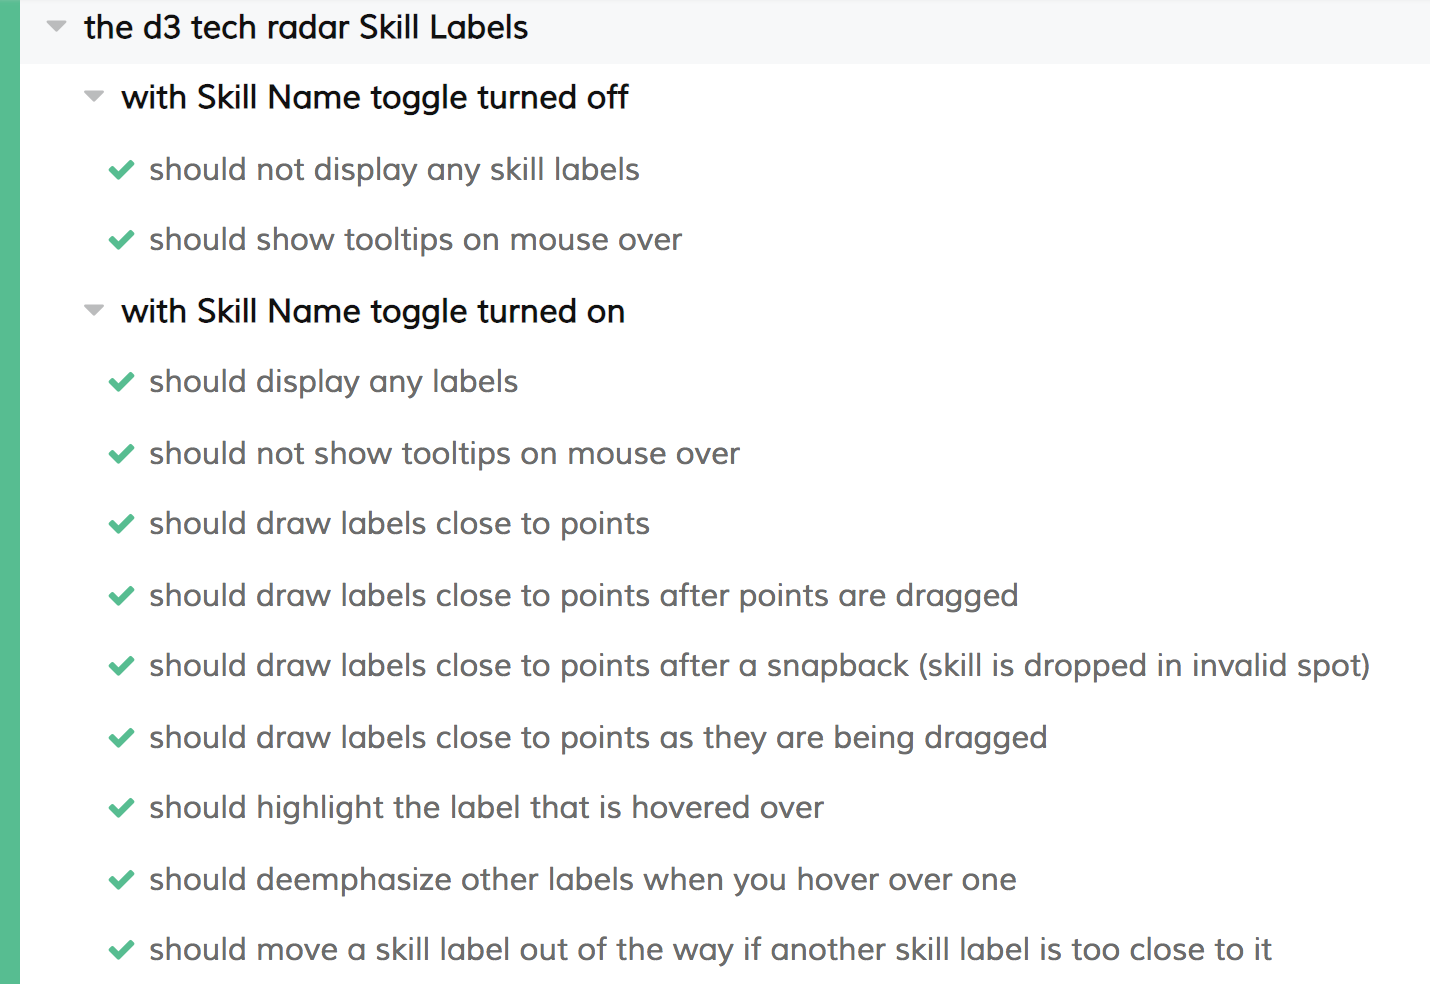
Testing
- Unit tests
- Jest snapshots with JSDOM
- Behavior testing with Cypress
- Manual testing
Jest snapshots
exports[`the d3 drawAngleGrid function should render the grid for the angle axis 1`] = `
<g>
  <line
    transform="translate(0, 0)"
    x2="375"
    y2="0"
  />
  <line
    transform="translate(0, 0)"
    x2="2.2962127484012872e-14"
    y2="375"
  />
  <line
    transform="translate(0, 0)"
    x2="-375"
    y2="4.5924254968025744e-14"
  />
  <line
    transform="translate(0, 0)"
    x2="-6.888638245203861e-14"
    y2="-375"
  />
</g>
`;
Jest snapshots
The good:
- Easy to verify many values at once
The bad:
- Tests fail if snapshots change
- Failing tests provide valuable diffs
- Have to manually verify on first run
- Cumbersome to verify large snapshots
- Must structure code to render small snapshots
- Can't test user interactions
- 'SVGElement' is not implemented in JSDOM
Cypress
The good:
- Very easy to write tests
The bad:
- Can see tests run in Chrome (good for visualizations)
- Mock API calls
- Chrome only (more browsers on the way soon!)
- Assert against outgoing network calls
- Can run tests in CLI or CI/CD
- Have direct access to DOM in tests
- Immediate feedback
Cypress
- Test behaviors, not code
How to actually use D3.js
- Google stuff!
- Look at examples
- https://bl.ocks.org/mbostock
- “Immature poets imitate; mature poets steal" -T.S. Elliot

- D3.js documentation
- Source code
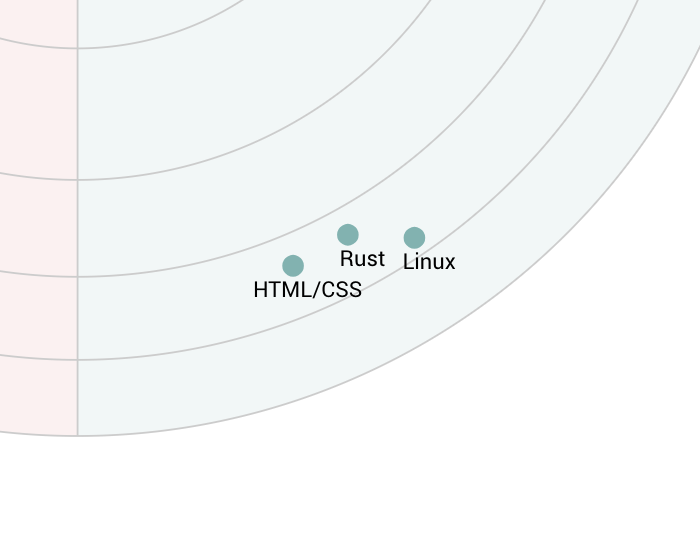
How to gain insight from your data?

Thank you!
Useful links (take a picture)
timmydoza@gmail.com -email me!
-Mike Bostock's d3 examples
-Mike Bostock's blog
-These slides
-Spotify demo
-SVG Tutorial