1.5 McCulloch Pitts Neuron
Your first model
Recap: Six jars
What we saw in the previous chapter?
(c) One Fourth Labs
Linear Algebra
Probability
Calculus


Data
Model
Loss
Learning
Task
Evaluation


Artificial Neuron
What is the fundamental building block of Deep Learning ?
(c) One Fourth Labs

f
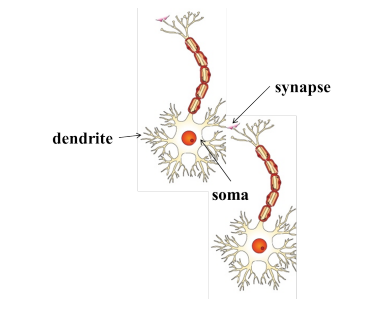
Recall Biological Neuron
Where does the inspiration come from ?
(c) One Fourth Labs
The Model
When and who proposed this model ?
(c) One Fourth Labs
The early model of an artificial neuron is introduced by Warren McCulloch and Walter Pitts in 1943. The McCulloch-Pitts neural model is also known as linear threshold gate.
Walter Pitts, a logician proposed the first mathematical model of a neural network. The unit of this model, a simple formalized neuron, is still the standard of reference in the field of neural networks. It is often called a McCulloch–Pitts neuron.
Warren McCulloch was a neuroscientist who created computational models based on threshold logic which split the inquiry into two distinct approaches, focused on biological processes in the brain and application of neural networks to artificial intelligence.


* Images adapted from https://www.i-programmer.info/babbages-bag/325-mcculloch-pitts-neural-networks.html
The Model
How are we going to approach this ?
(c) One Fourth Labs
Data
Model
Loss
Learning
Task
Evaluation
Numpy basics?
The Model
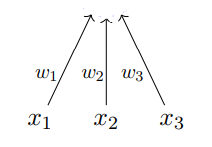
What is the mathematical model ?
(c) One Fourth Labs
One parameter, b
f
g
McCulloch and Pitts proposed a highly simplified computational model of the neuron.
The inputs can be excitatory or inhibitory
g aggregates the inputs and the function f takes a decision based on this aggregation.
if any
is inhibitory, else
Data and Task
What kind of data and tasks can MP neuron process ?
(c) One Fourth Labs
LHS diagram with boolean input and outputs
RHS data x (3 lbw variables: pitch, impact, missing stumps, show lbw DRS photo) and y (summation function to show lbw or not)
// threshold >= 3
Data and Task
What kind of data and tasks can MP neuron process ?
(c) One Fourth Labs
A model of MP Neuron with these input features
Use b instead of \theta to be consistent with perceptron, sigmoid etc
Real world example with a recommender system
Purchase of smartphone: Have several (~ 10) boolean conditions such as screen size > 5 inch, etc. We have labelled data of the preference (yes/no) of a user across several (~ 100 smartphones).
Ananya has collected this data
Boolean inputs
Boolean output
Loss Function
Ho do we compute the loss ?
(c) One Fourth Labs
Same data matrix from before
Animation:
- Feed one input from the matrix to the model
- Highlight the true output y and predicted output y_hat (just variables, not actual values)
- Show simple equation y - \hat_y [I will explain while talking what this equation means]
- Now add summation over all i y_i - \hat_y_i
- Now add square
Same model diagram from before.
Show loss function here
Loss Function
Why do we use the square of the error ?
(c) One Fourth Labs
Same data matrix from before
Animation:
- Remove the square
- Now add column for \hat_y such that there are equal number of positive and negative errors
- Now compute the loss function without the square
- now show what happens when you add the square
Same model diagram from before.
Show loss function here
Learning Algorithm
How do we train our model?
(c) One Fourth Labs
Same data matrix from before
Animation:
- Show the search logo first
- Now show the tick mark and the brute force message
- Now show the plot
- The y_hat column will change as you change the value of b
Same model equations here
Show loss function here
Show search logo here
show a plot here of b on the x-axis and loss on the y axis and one-by-one fill the points in the plot for b = 1 to 10
for b=1 and b=2 the y_hat column should get adjusted as you change the value of b (so that I can talk about how the loss was computed)
Only one parameter, can afford Brute Force search
Loss Function, Learning Algo
How do we train our model?
(c) One Fourth Labs
Demonstrate brute force search with a plot that varies \theta and plots loss function
* I think this slide will not be needed as we should be able to fit everything on the previous slide
Evaluation
How does MP perform?
(c) One Fourth Labs
Same train matrix from before (you can compress it -its ok even if it is not fully visible
Animation: (the parts in red will already be seen on the slide
- Show new test matrix below (with 4 rows)
- Show accuracy formula
- Go over each row and compute the model output. Show tick or cross in the space shown on RHS
- SHow the final accuracy number
Same model equations here with the value of b as learned from before
Show accuracy formula here
tick or cross here
some test matrix here
Geometric Interpretation
How to interpret the model of MP neuron gemoetrically?
(c) One Fourth Labs
- We will now consider the phone like/no_like problem again but with only two features: screen size > 5 in and battery life > 24 hours
- Show many phones but each of them can only belong to one of the 4 points {0,0} {0,1} {1,0} and {1,1}
- Now plot these points on the x1, x2 plane. There will be many points clustered at each of the 4 corners 0,0} {0,1} {1,0} and {1,1}
- Now show the model equations
Show the plot here
Model equations here
- Now consider the line with be = 1
- Shade the area above this line as green and the area below this line as red
Now consider the line b = 0 and shade the area above this line as green and below as red
repeat for line b= 2
Geometric Interpretation
Is this really a simple model ?
(c) One Fourth Labs
- Everything from the previous slide
- Now show what if the true data (i.e., all the points clustered around the 4 points
{0,0} {0,1} {1,0} and {1,1} was actually like the XOR gate
- adjust the line by changing b=0. b1=1 and b=2 and show that there is no way you could have separated those points
Show the plot here
Model equations here
Linear
Fixed Slope
Few possible intercepts (b's)
Take-aways
So will you use MP neuron?
(c) One Fourth Labs
Show the 6 jars at the top (again can be small)
\( \{0, 1\} \)
Boolean
show the line plot with XOR issue from the previous slide
show squared error loss
show search logo
show accuracy formula
Assignment
So will you use MP neuron?
(c) One Fourth Labs
Background of MP neuron
Understood model
Understood implications for data+task and loss function, learning algo
Understood the geometric interpretation to see that MP neuron cannot model complex relations
In the real world, data is not binary and relations are more complex
Hence this course continues
Will a binary search algorithm work?