D3.js Tutorial
Wenbin He
Intro to D3.js
What is D3.js
- Visualizing data with web standards (HTML/SVG/CSS)
- Binding data to web elements
- Applying data-driven transformations to web elements
Web Standards
- HTML (HyperText Markup Language)
- Basic building block of the Web
- Defining the content of a webpage
- CSS (Cascading Style Sheets)
- Describing the presentation of a html document
- SVG (Scalable Vector Graphics)
- A vector image format for two-dimensional graphics
SVG Examples
D3.js Pipeline
Data
D3.js
HTML
SVG
CSS
.data()
.enter()
...
.select()
.selectAll()
...
.attr()
.style()
...
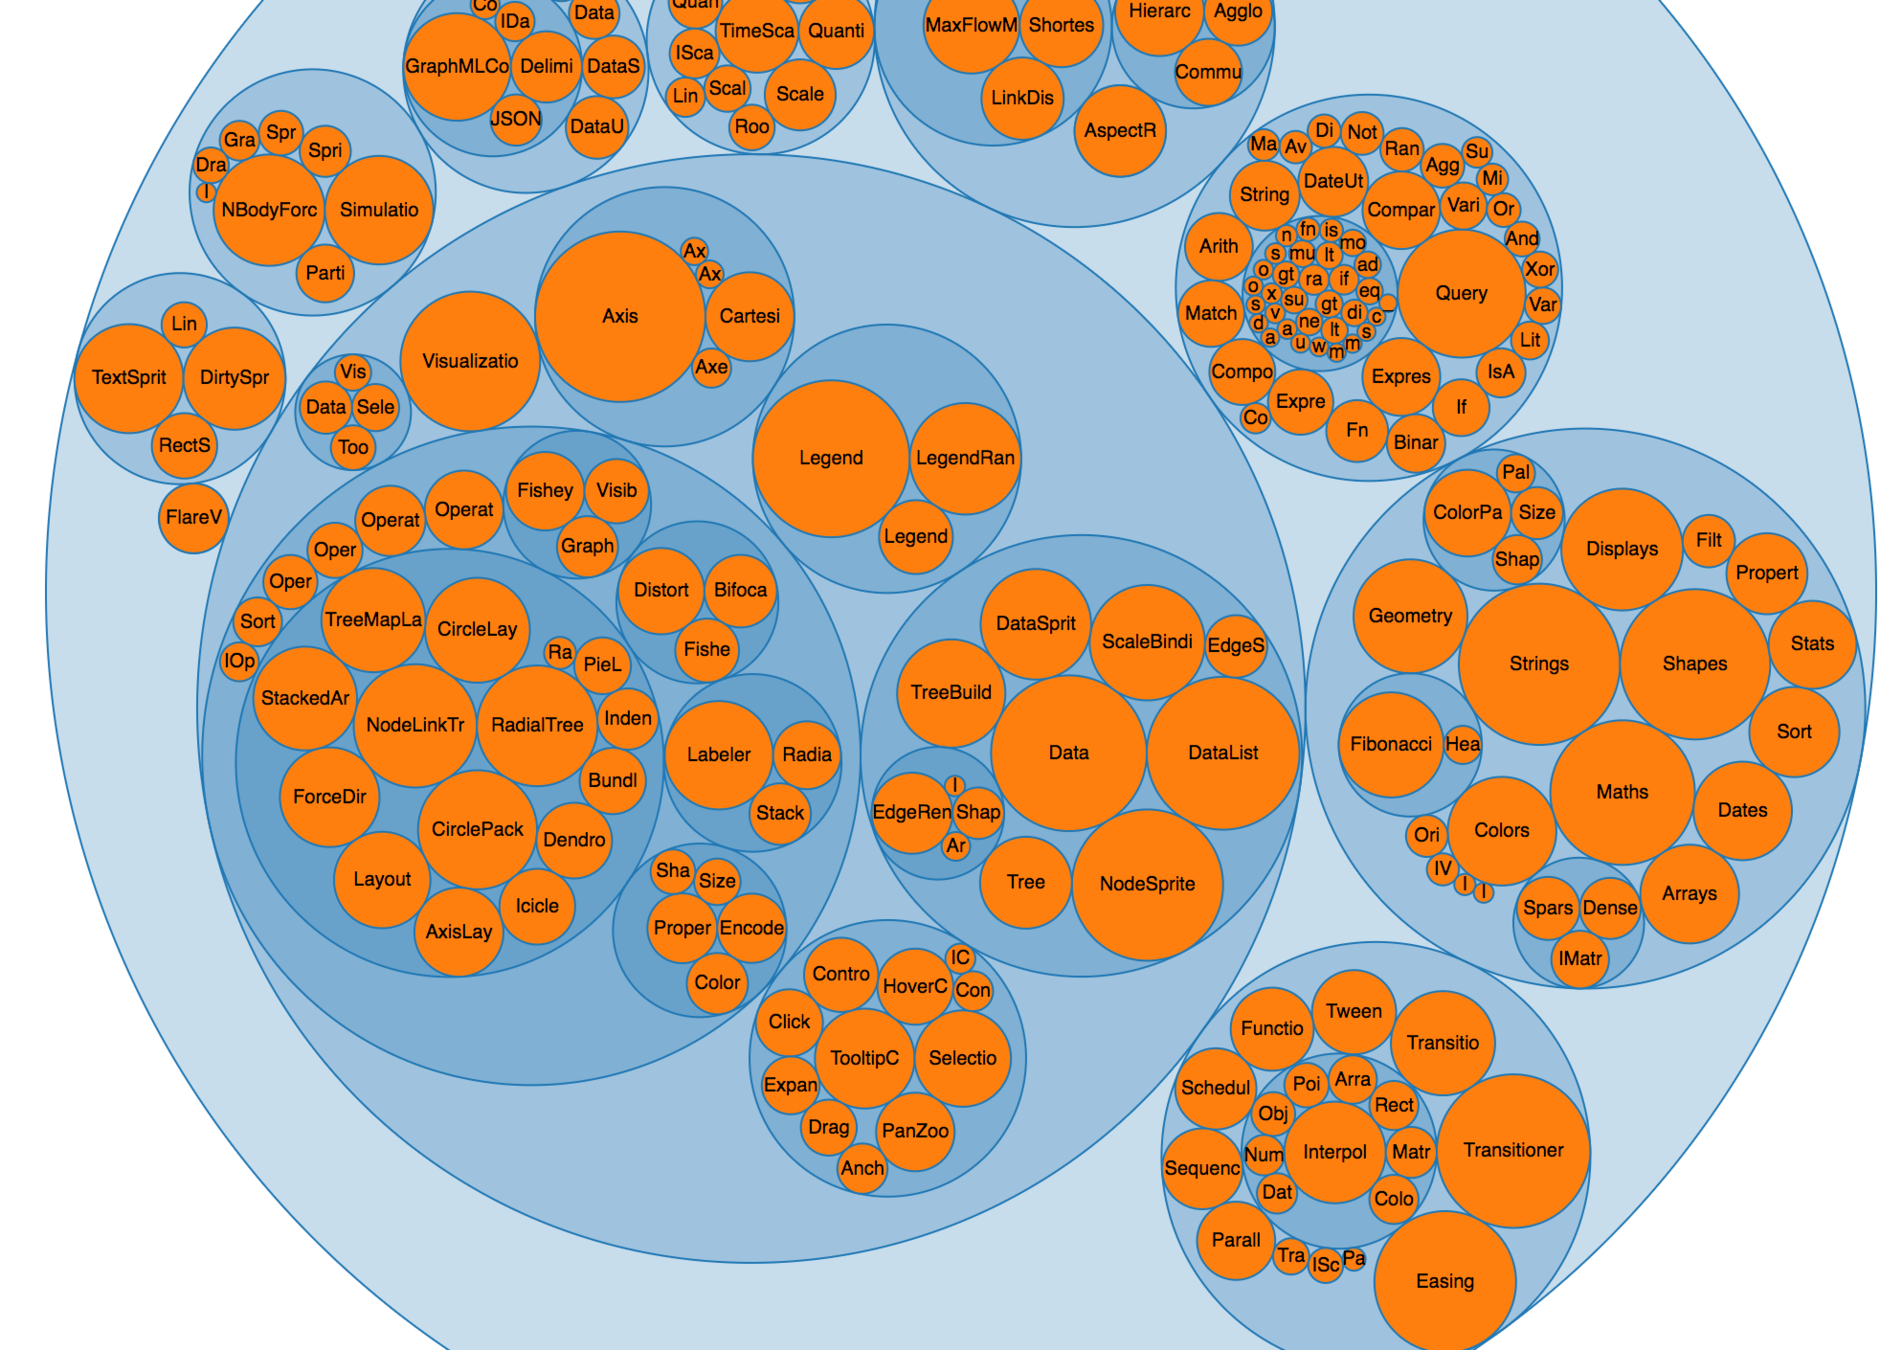
D3.js Examples
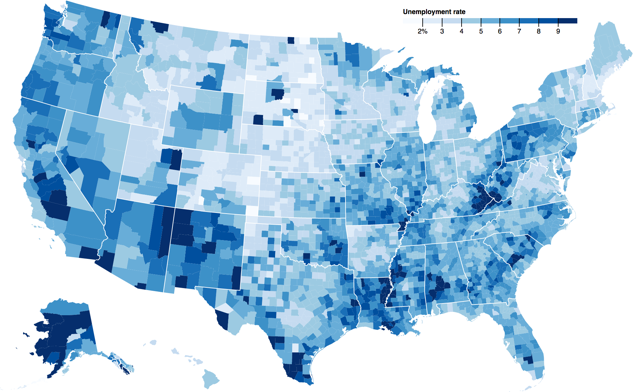
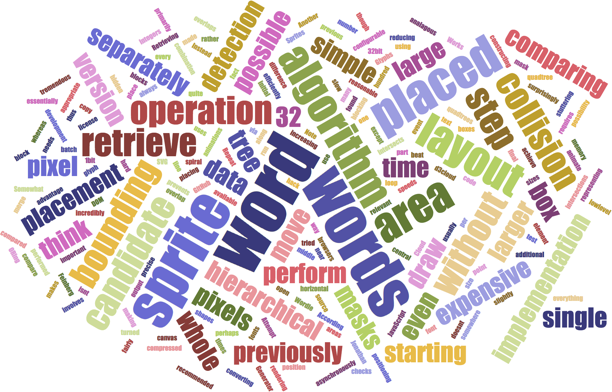
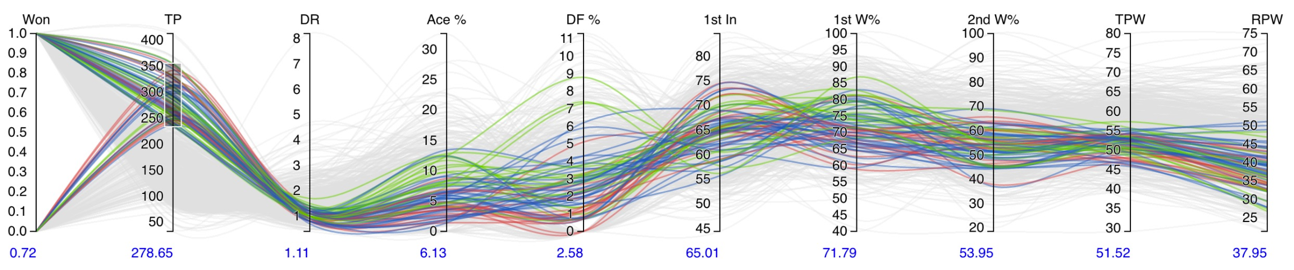
More examples can be found at: https://github.com/d3/d3/wiki/Gallery
Let’s Make a Bar Chart!
Environment Setup
Selections
D3 uses CSS Selectors
.select() and .selectAll()
What if we want to select multiple elements at the same time?
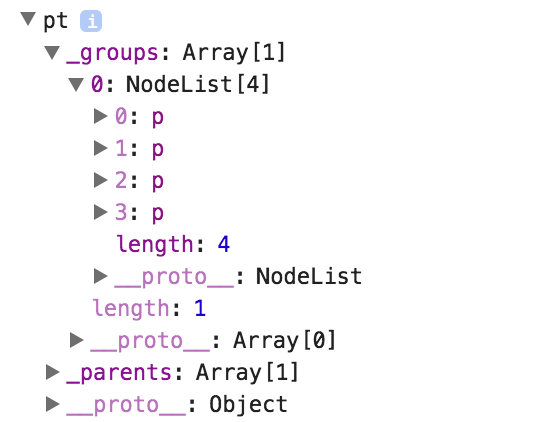
What a Selection Object Looks Like
.attr() and .style()
- .attr() - get or set a HTML attribute
- position
- size
- ...
- .style() - get or set a CSS style property
- color
- fill
- stroke
- ...
.attr() and .style() cont'd
Map Data with Elements
.data()
- Using D3’s selection.data() method to bind data to elements
- .data() accepts practically any array of numbers, strings, or objects
- If .data() is called, a __data__ property will be created for each element, which contains the data mapped to that element
.data() cont'd
.attr() and .style() again
What if number of data doesn't match number of items selected?
If the value given to .attr() or .style() is a function, it is evaluated for each selected element, in order, being passed the current datum (d), the current index (i), and the current DOM element (this)
enter, update, and exit
- Calling .data() creates three selections:
- enter - data missing elements
- update - join elements to data
- .data() returns the update selection
- exit - elements missing data
.enter()
.exit()
Scale
Scales are functions that map from an input domain to an output range
Continuous Scales
- input domain - continuous, quantitative
- output range - continuous
- linear scale - map input and output linearly

var scale = d3.scaleLinear()
              .domain([100, 500])
              .range([10, 350]);

// note: use d3.scale().linear() for d3 version 3.x

scale(100);  // returns 10
scale(300);  // returns 180
scale(500);  // returns 350
Other Continuouse Scales
d3.scaleLog(), d3.scalePow(), d3.scaleTime()
var x = d3.scaleTime()
          .domain([new Date(2000, 0, 1), new Date(2000, 0, 2)])
          .range([0, 960]);

x(new Date(2000, 0, 1,  5)); // 200
x(new Date(2000, 0, 1, 16)); // 640
Ordinal Scales
- input domain - discrete
- output range - discrete (Note: could be numeric)
- Including band scales, point scales, and category scales
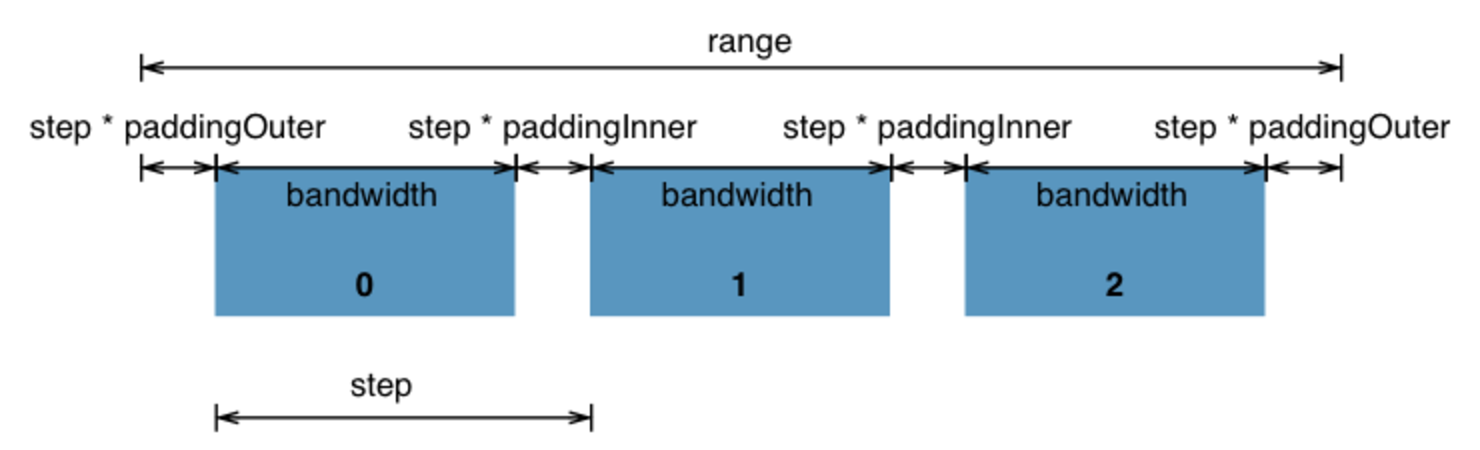
Band Scales
- d3.scaleBand()
- Output range is continuous and numeric
- Output values are automatically computed by dividing the continuous range into uniform bands
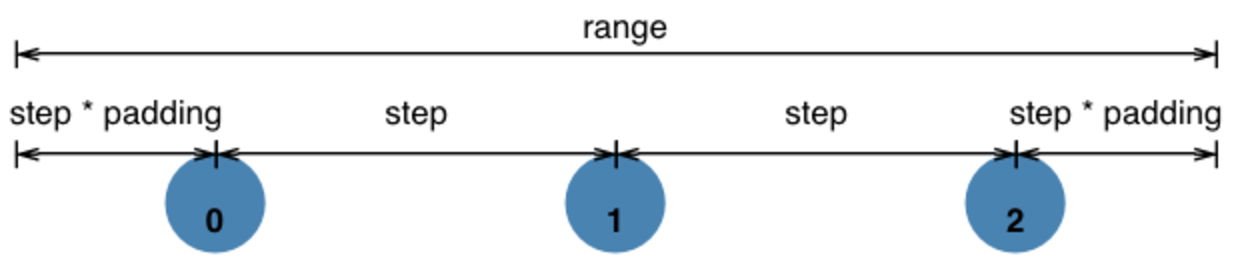
Point Scales
- d3.scalePoint()
- A variant of band scales with the bandwidth fixed to zero
Category Scales
- Designed to work with d3.scaleOrdinal. For example:
var color = d3.scaleOrdinal(d3.schemeCategory10);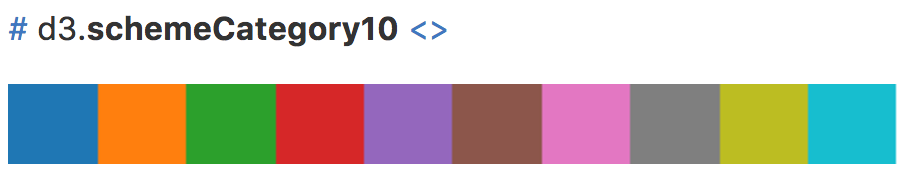


Scale methods
- .nice() - round domain to nicer numbers
- .rangeRound() - output range in integers – better for positioning marks on the screen
- .invert() - map output range to input domain
- .ticks() - return uniformly spaced ticks for your axes.
- .clamp() - limit output to range if an input outside the domain is provided
Scale Example
Axes
D3’s axes are functions generating visual elements of an axis, including lines, labels, and ticks
Setting up an Axis
- Create a new axis function
- d3.axisTop()
- d3.axisRight()
- d3.axisBottom()
- d3.axisLeft()
-
Tell each axis what scale to operate on
- .scale()
var scale = d3.scaleLinear()
              .domain([100, 500])
              .range([10, 350]);

var axis = d3.svg.axisBottom()
                 .scale(scale);

// Note: use d3.axis().orient("bottom")
//       for d3 version 3.x
Plotting an Axis
- .call() - call a axis function to generate the axis
.ticks()
- .ticks() - customize how ticks are generated and formatted
Put Together with Bars
Transitions
.transition() and .duration()
.delay()
.ease()
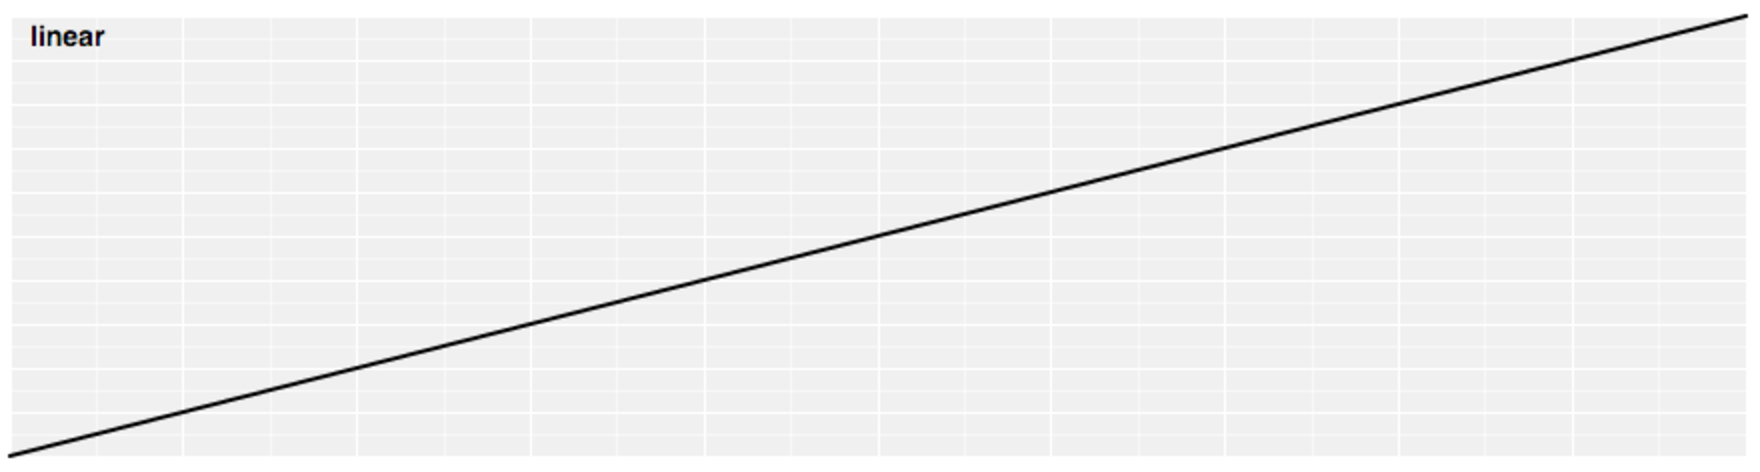
Linear Easing
- The identity function
- Linear(t) returns t
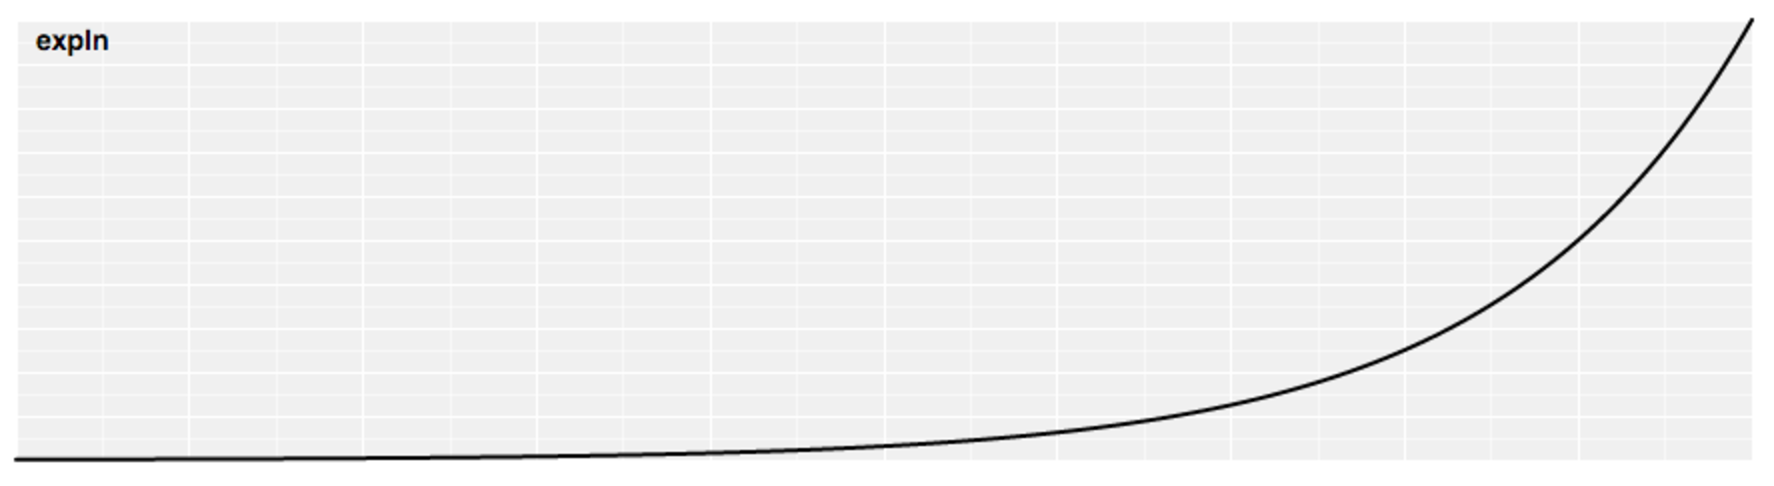
Exponential Easing
- Raises 2 to the exponent 10 * (t - 1)
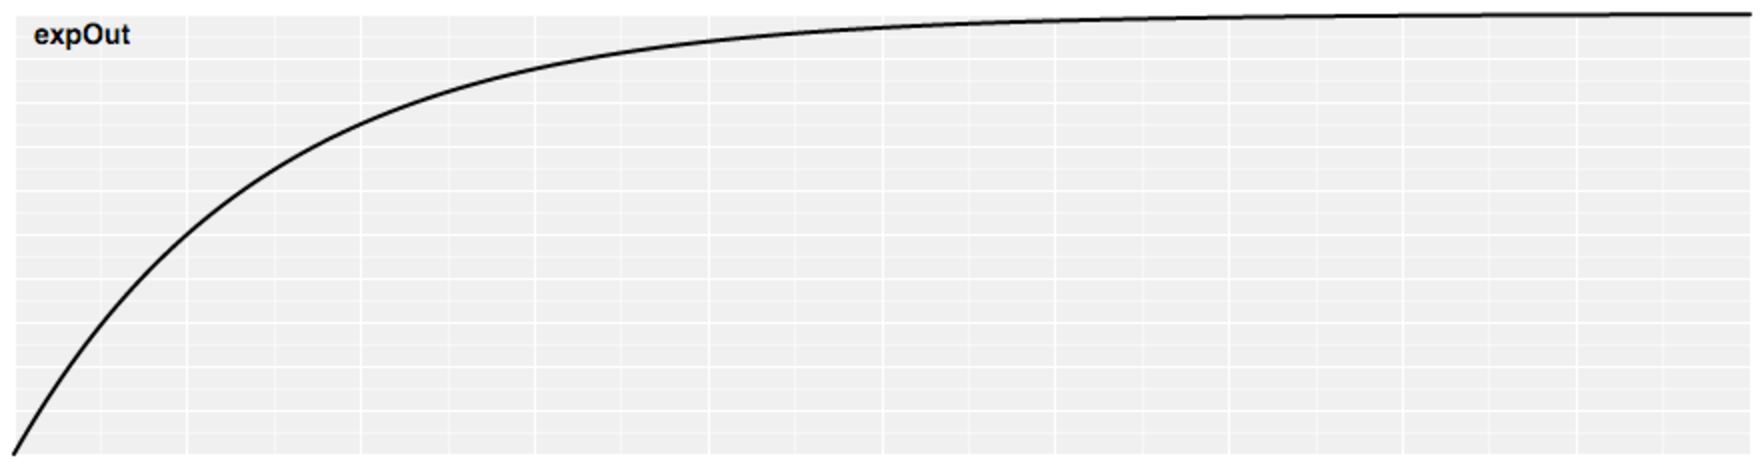
Reverse Exponential Easing
- Equivalent to 1 - expIn(1 - t)
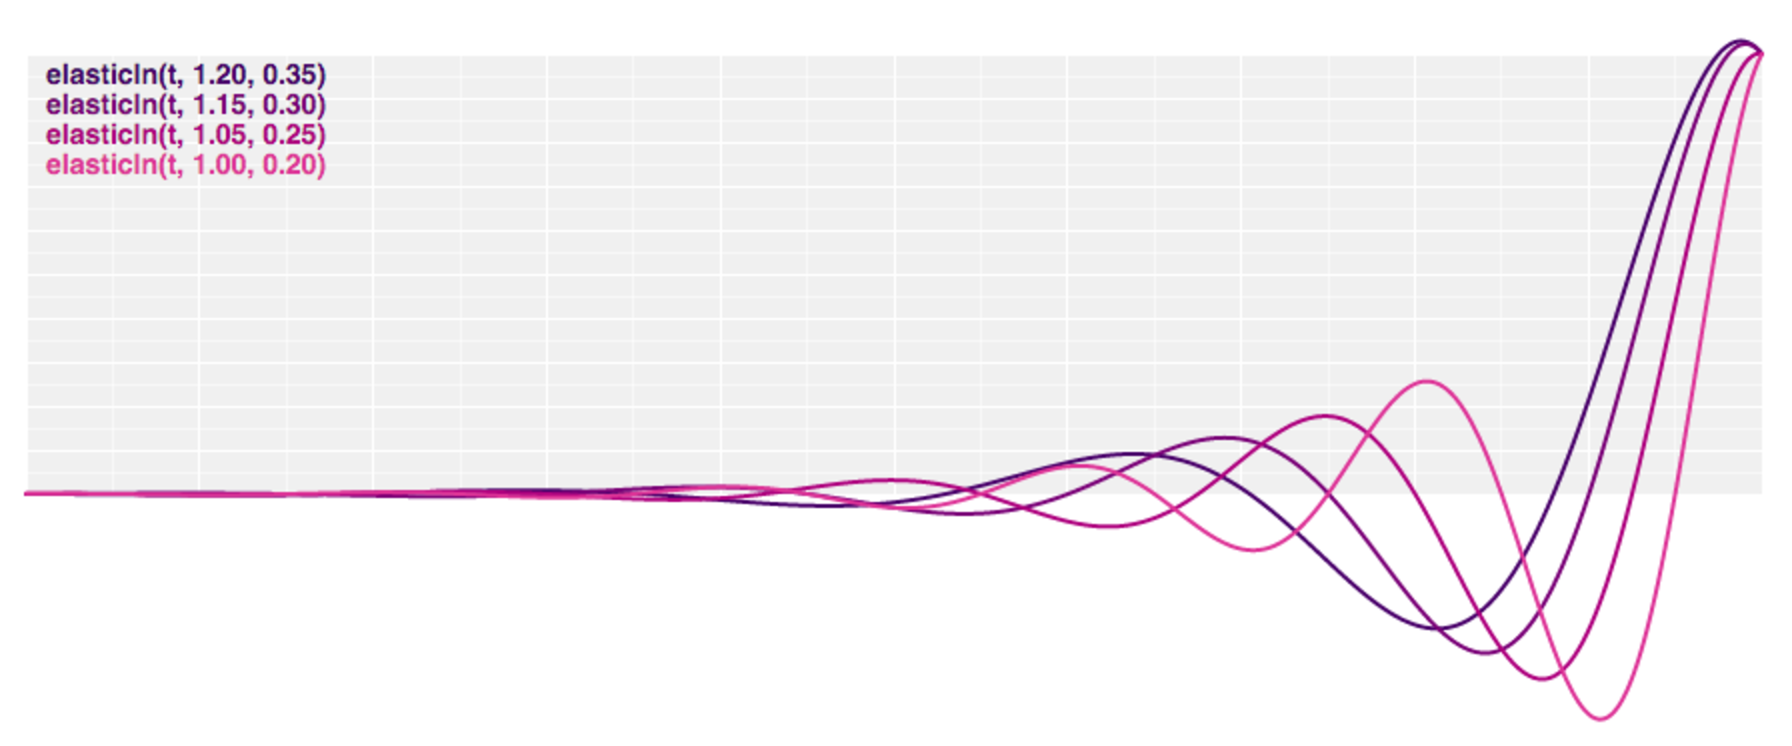
Elastic Easing
- Like a rubber band
- The amplitude and period of the oscillation are configurable (default to 1 and 0.3)
More ease functions can be found at: https://github.com/d3/d3-ease
Sort the Bars
Interactions
.on("event", ...)
More event types can be found at: https://developer.mozilla.org/en-US/docs/Web/Events#Standard_events
Put All Together
Load Data
.csv(), .tsv(), and .json()
- Implemented Using XMLHttpRequest
- All these functions are asynchronous functions
- d3.csv/tsv(url, row, callback)
- d3.json(url, callback)
var data;

d3.csv("filename.csv", function(d) {
  d.someattribute = somevalue;
  return d;
}, function(error, rows) {
  data = rows;
  console.log(data);  // returns rows
});

console.log(data);  // returns undefined
Layouts
Layouts
- Provide a variety of layout generators for users' convenience
- Do not lay anything out for you on the screen
- Take data and transform it, thereby generating new data that is more convenient for a specific visual task
Layouts List
- Pie
- Pack
- Stack
- Tree
- And many more
Pie
- d3.pie() - using for creating pie charts
var data = [1, 1, 2, 3, 5, 8, 13, 21];

d3.pie()(data)
// returns
[
  {"data":  1, "value":  1, "startAngle": 6.05, "endAngle": 6.17, "padAngle": 0},
  {"data":  1, "value":  1, "startAngle": 6.17, "endAngle": 6.28, "padAngle": 0},
  {"data":  2, "value":  2, "startAngle": 5.82, "endAngle": 6.05, "padAngle": 0},
  {"data":  3, "value":  3, "startAngle": 5.47, "endAngle": 5.82, "padAngle": 0},
  {"data":  5, "value":  5, "startAngle": 4.89, "endAngle": 5.47, "padAngle": 0},
  {"data":  8, "value":  8, "startAngle": 3.96, "endAngle": 4.89, "padAngle": 0},
  {"data": 13, "value": 13, "startAngle": 2.44, "endAngle": 3.96, "padAngle": 0},
  {"data": 21, "value": 21, "startAngle": 0.00, "endAngle": 2.44, "padAngle": 0}
]
Arc
- d3.arc() - constructs a new arc generator with the default settings
-
arc(arguments…) - generates an arc for the given arguments
var arc = d3.arc();

arc({
  innerRadius: 0,
  outerRadius: 100,
  startAngle: 0,
  endAngle: Math.PI / 2
}); // returns "M0,-100A100,100,0,0,1,100,0L0,0Z"

var arc = d3.arc()
    .innerRadius(0)
    .outerRadius(100)
    .startAngle(0)
    .endAngle(Math.PI / 2);

arc(); // returns "M0,-100A100,100,0,0,1,100,0L0,0Z"
This is for SVG Path:
- M = move to
- L = line to
- A = arc to
Arc Example
Pie Example
Other Shapes and Layouts

Tree
Pack
Stack