Math Lectures
Combine NLP with supervised and unsupervised learning to classify math lectures
Objective:
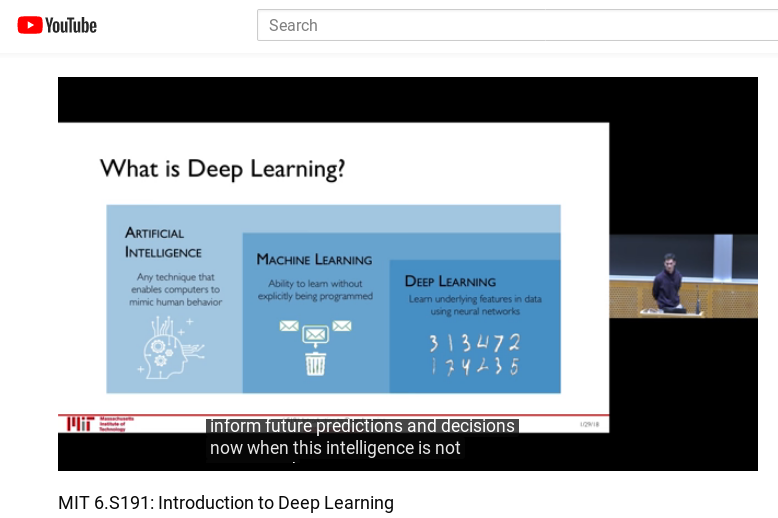
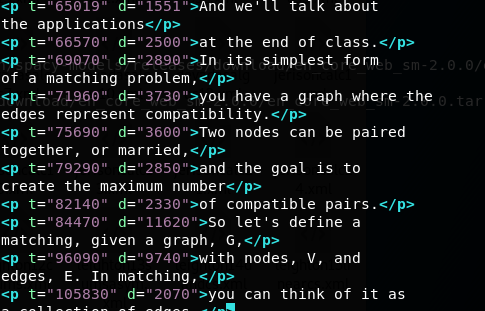
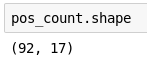
Use closed captioning from 92 lectures
Save XML file in a directory
Objective: Use supervised and unsupervised learning techniques to best classify math lectures.
(Clean the data)
- Train Doc2Vec Model
- Dimensionality Reduction for Visualization
Clustering and Similarity
- Clustering the data
- KMeans Silhouette Scores
- 9, 10, and 11 clusters
- Topic Extraction (NMF and LDA)
Modeling
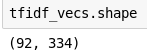
- Tf-idf vectorization
- Initial model
- Parameter Search
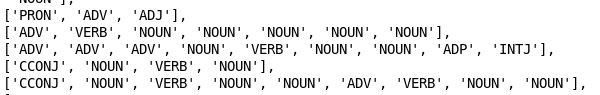
- Parts of Speech
- Final Model
Part 2
Part 1
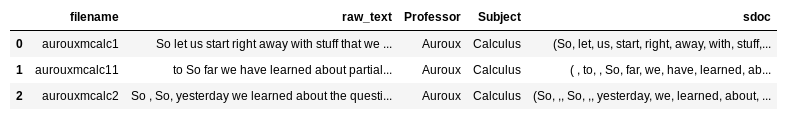
Clean and tokenize the text
lecture id
str
label
label
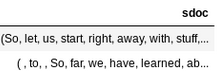
Spacy Doc
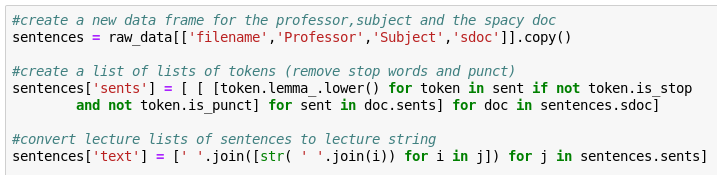
- extract lemmas, remove punctuation and stop words
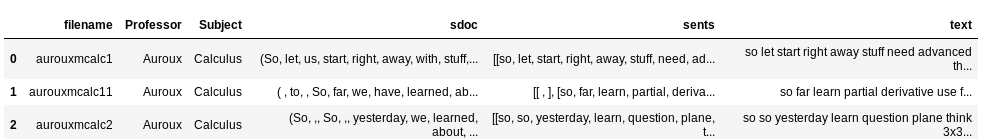
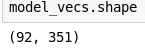
Use Doc2Vec to vectorize each lecture
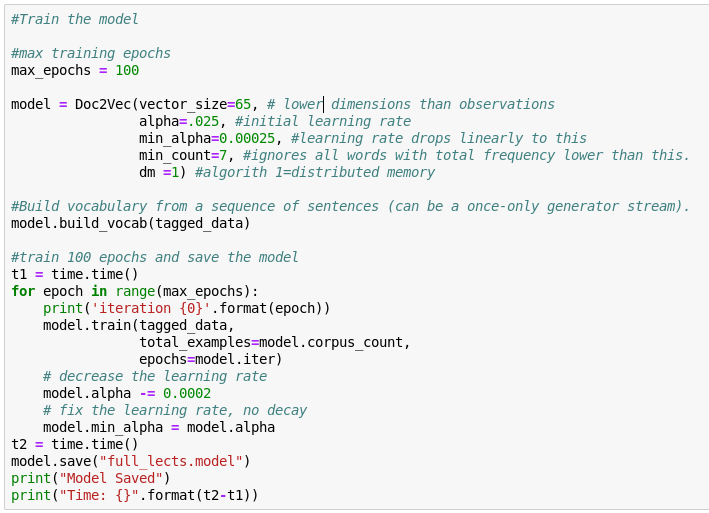
- Converts each lecture into a 65 dimensional vector

[ x 1, x 2 ... x 64, x 65 ]
Lecture
i
i
i
i
i
Epoch 1
Epoch 2
Epoch 3
Epoch 100
...
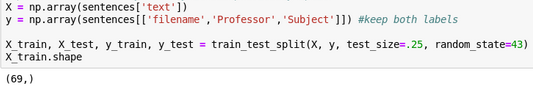
Extract the numerical representation for each lecture
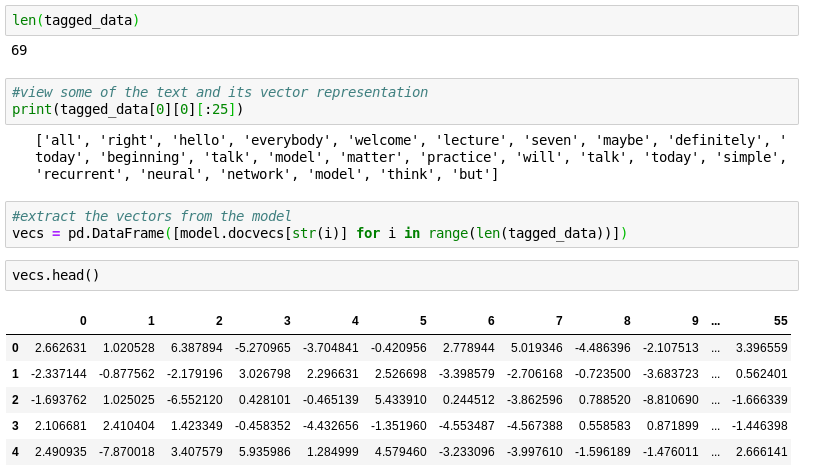
*tagged_data[0] = 1 full lecture
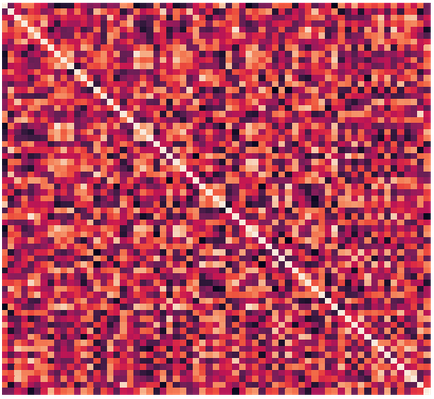
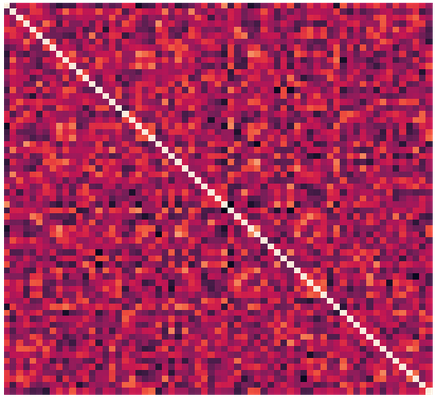
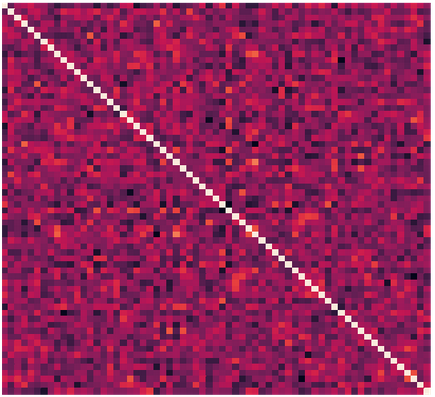
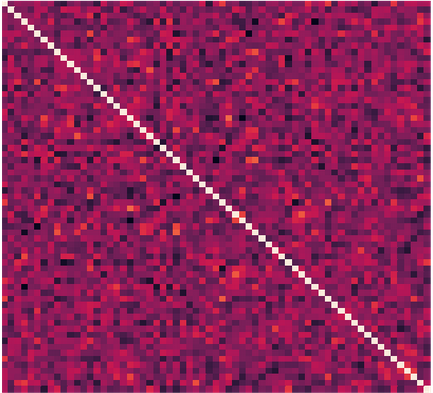
Calculate cosine similarity of lectures
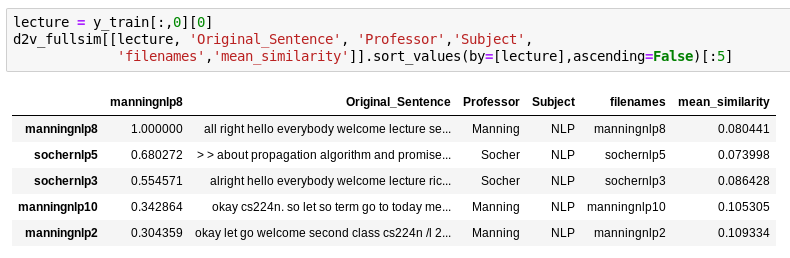
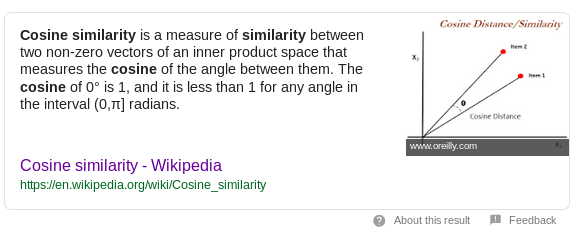
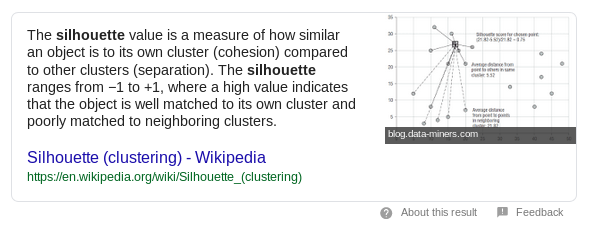
Metrics for clustering and determining similarity
Reducing the Dimensionality
for Visualization
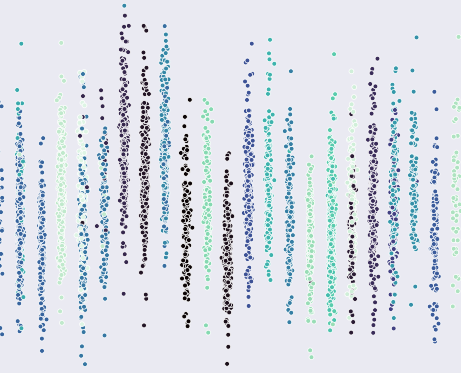
Using PCA
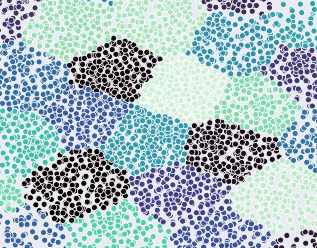
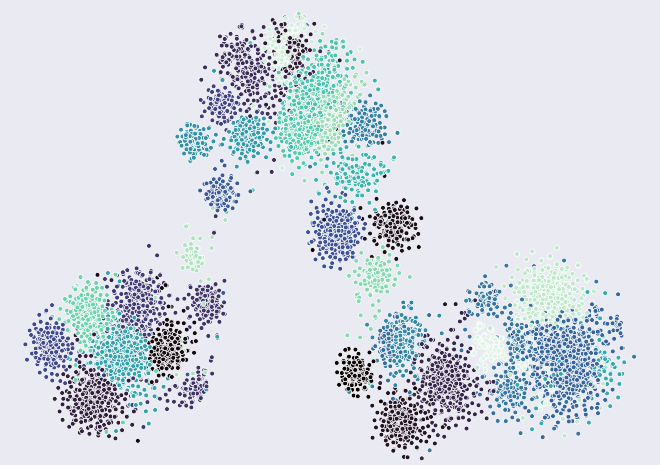
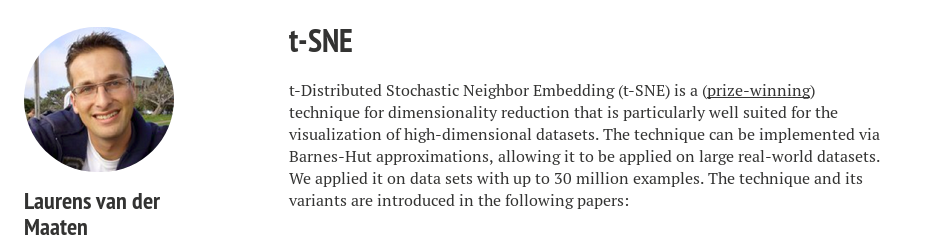
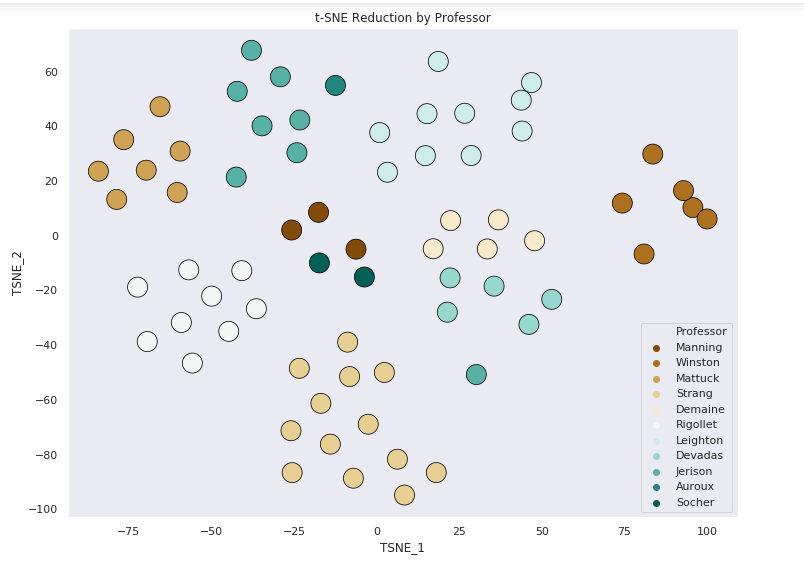
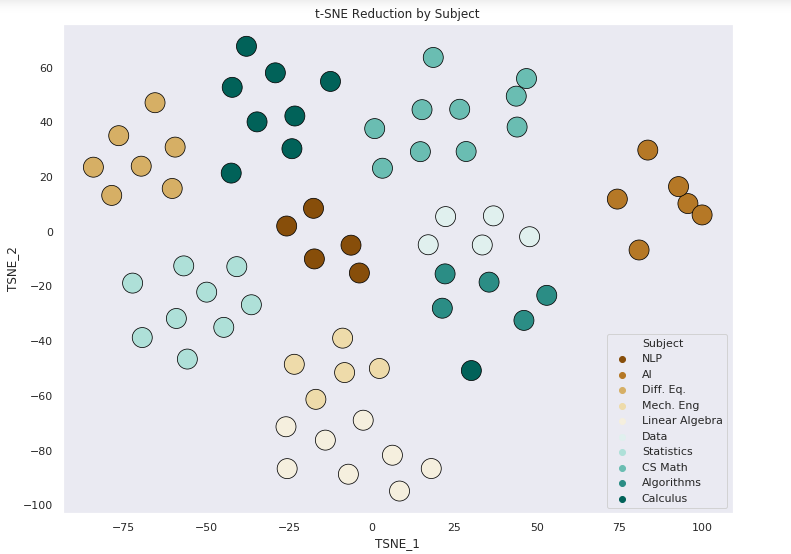
Using t-SNE
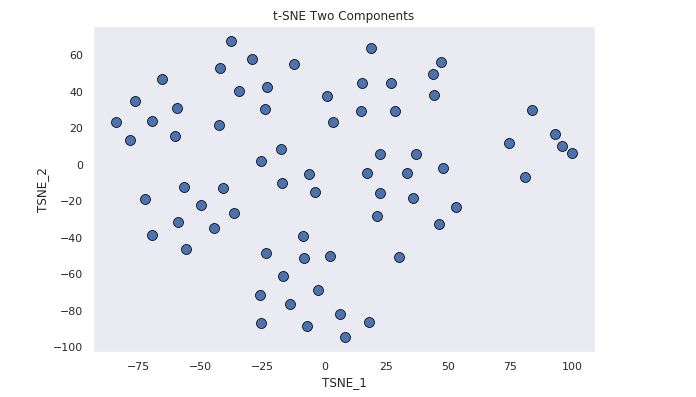
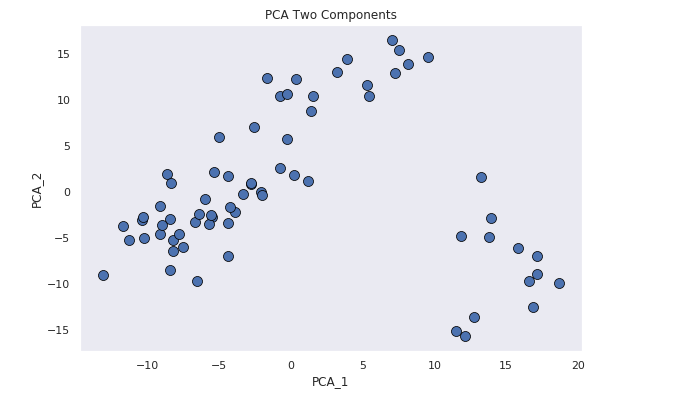
The scatter plot of the t-SNE components is much easier to interpret. For this reason t-SNE was chosen as the prefered method for reducing the dimensionality
Y = pca.fit_transform(vecs)
Yt = tsne.fit_transform(vecs)
Clustering the Data
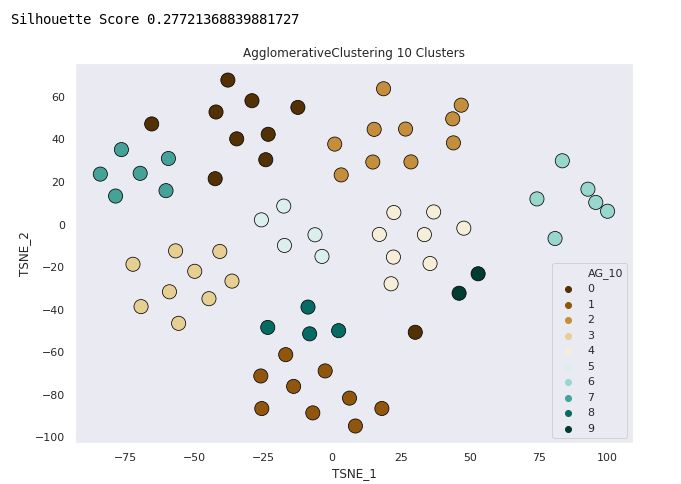
Agglomerative Clustering - 10 Clusters
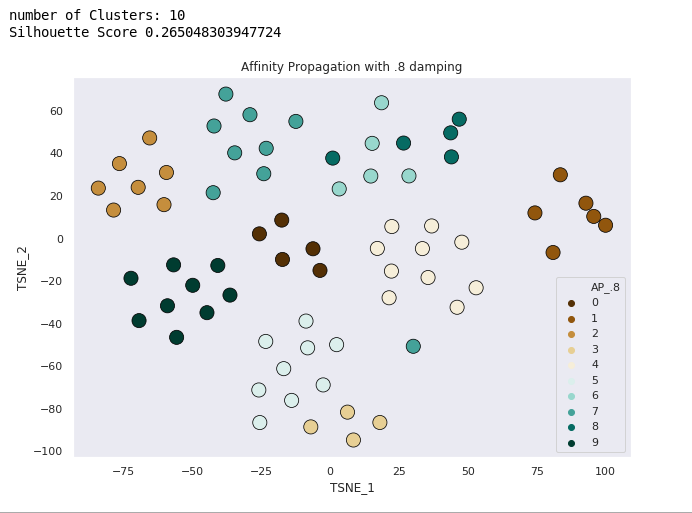
Spectral Clustering (damping .8)
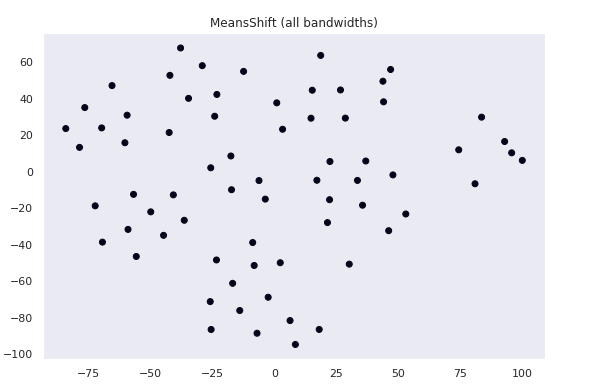
Mean Shift (all bandwidth)
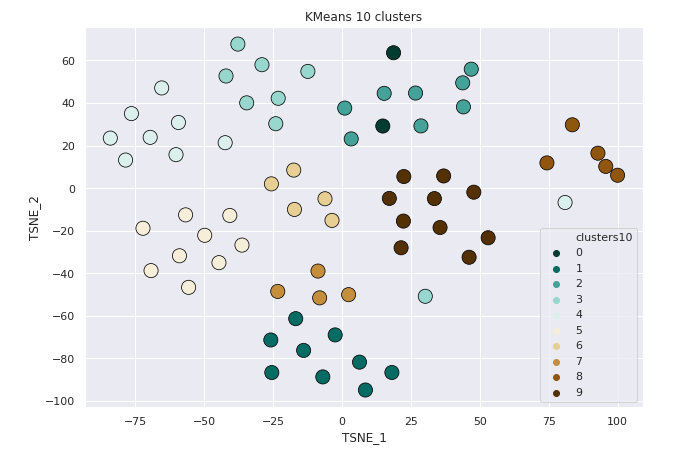
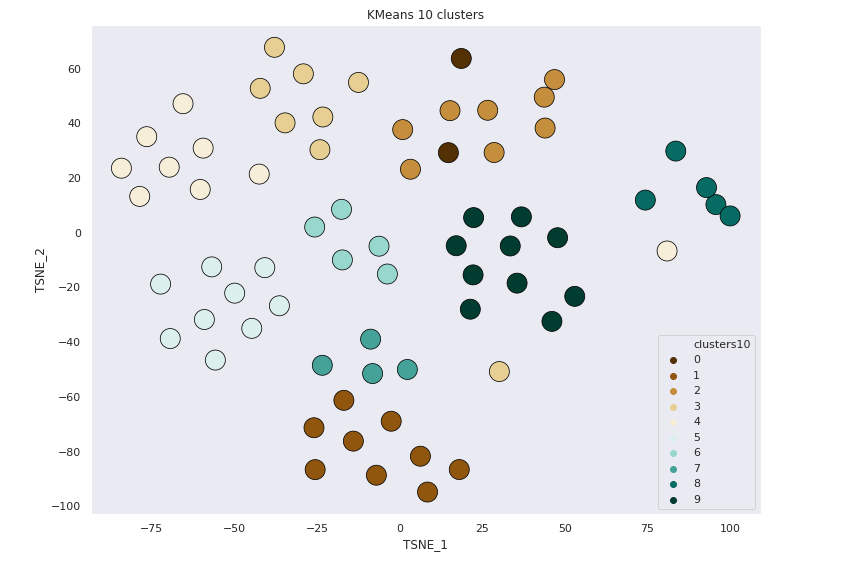
KMeans - 10 Clusters
Clustering the Data with KMeans

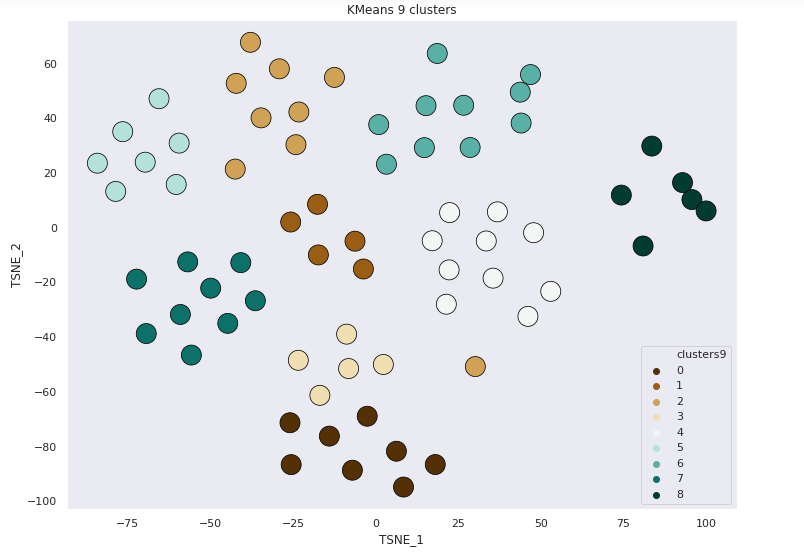
KMeans 9 Clusters
KMeans 10 clusters
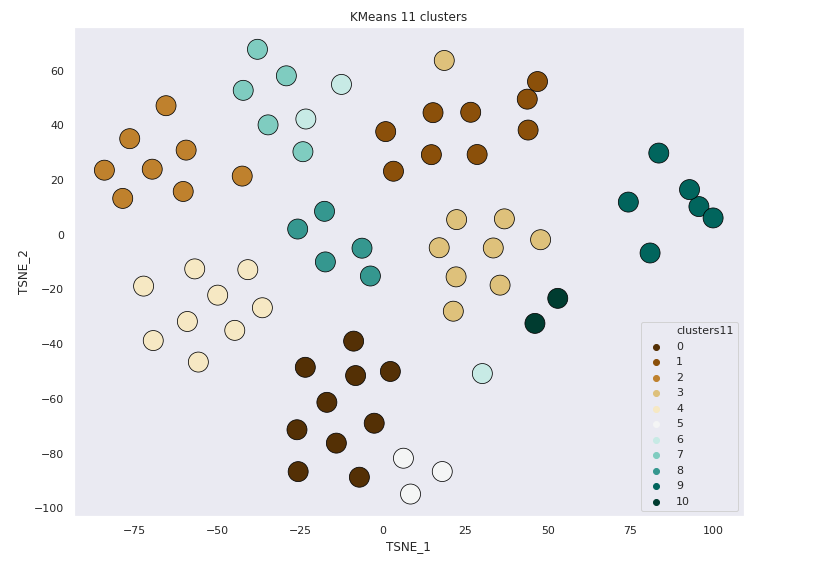
KMeans 11 Clusters
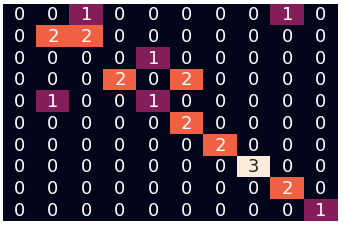
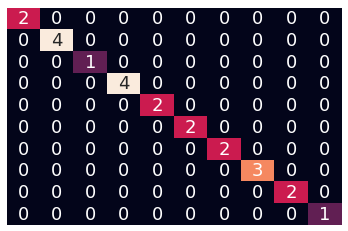
Actual labels
9 clusters by Subject
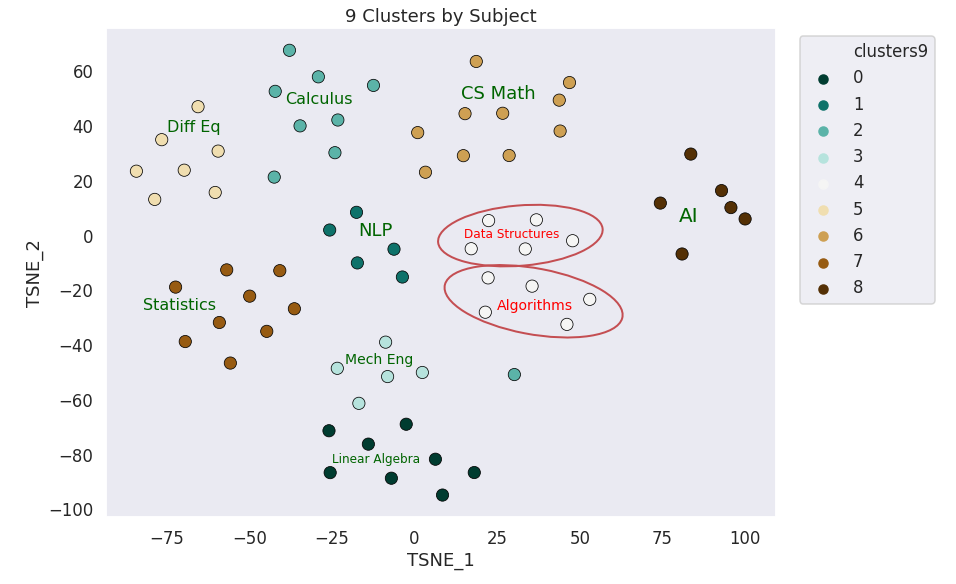
59/69 points correctly clustered
8/10 subjects correctly clustered
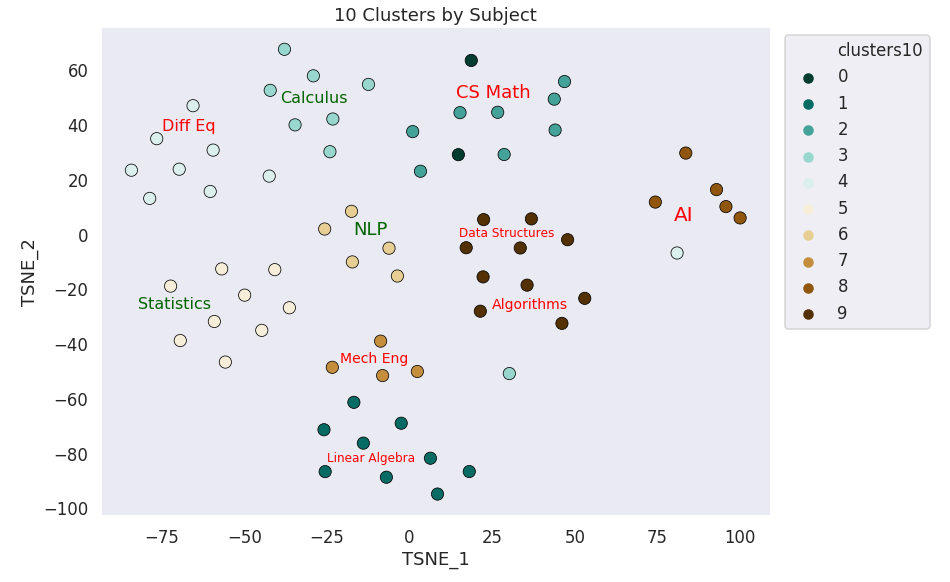
10 Clusters by Subject
22/69 points correctly clustered
3/10 Subjects correctly clustered
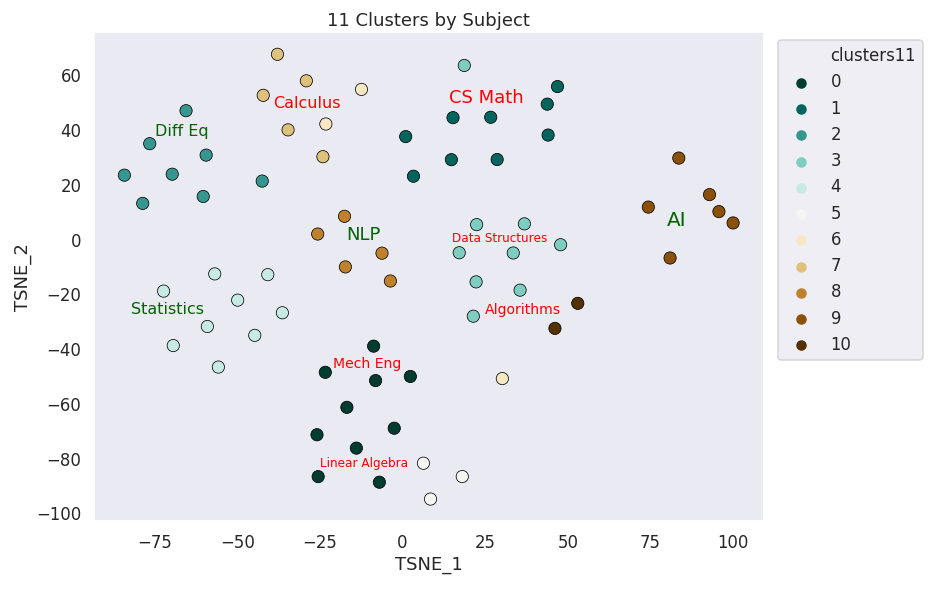
11 Clusters by Subject
27/69 points correctly clustered
4/10 Subjects correctly clustered
Results of Clustering
9 Clusters
10 Clusters
11 Clusters
By Subject
By Professor
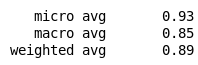
85.5%
31.88%
39.13%
46.37%
10.14%
33%
Score is based on cluster completeness. (Only lectures perfectly in their true label group are scored)
But wait...
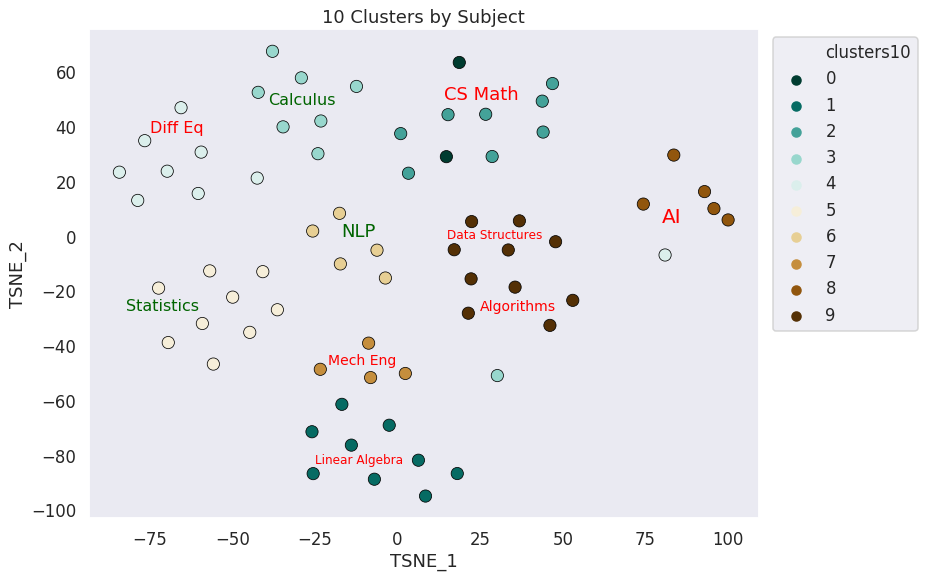
Calculus?
Why here?
?
?
This calculus lecture ended up far from its cluster during the t-SNE decomposition
Why can't the KMeans discern between data structures and algorithms?
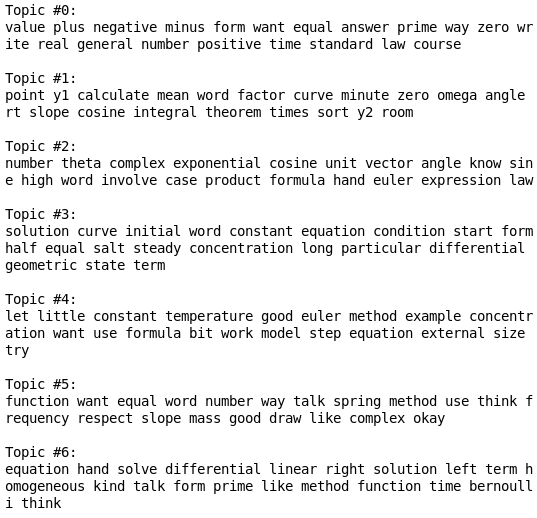
Why does this AI lecture get clustered to Differential Equations?
Calculus is very close to Differential Equations.
Math for Computer Science, Artificial Intelligence, Algorithms, Data Structures in this context are more closely related to one another than the others. This relationship is captured in coordinates of the lectures
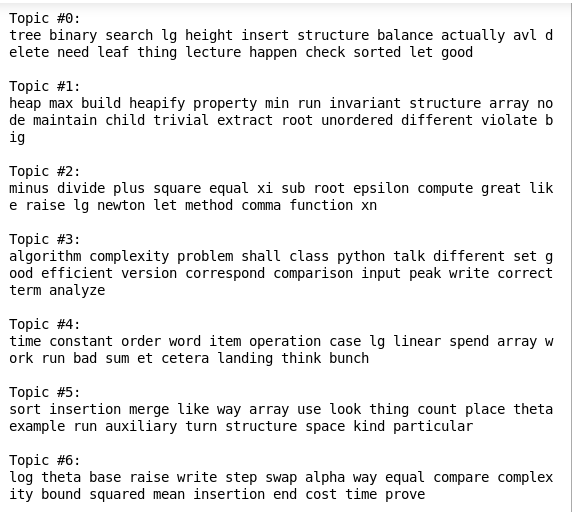
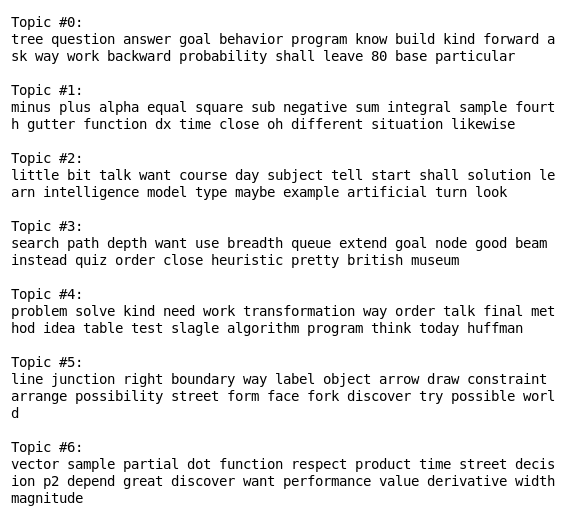
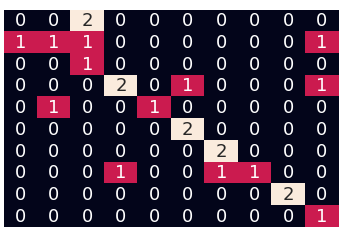
Topic Extraction using Non negative matrix factorization
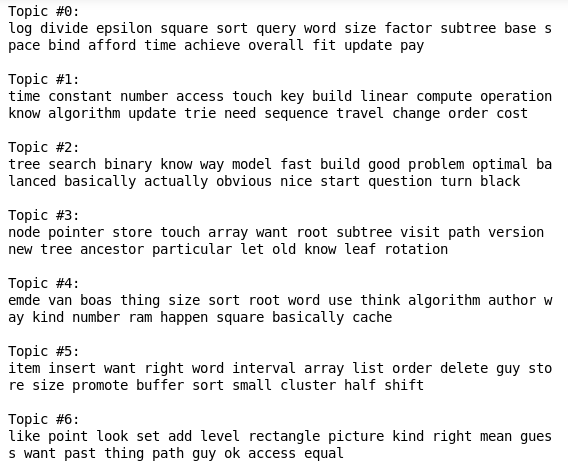
Data Structures
Algorithms
Do these look that different?
Topic Extraction using LDA
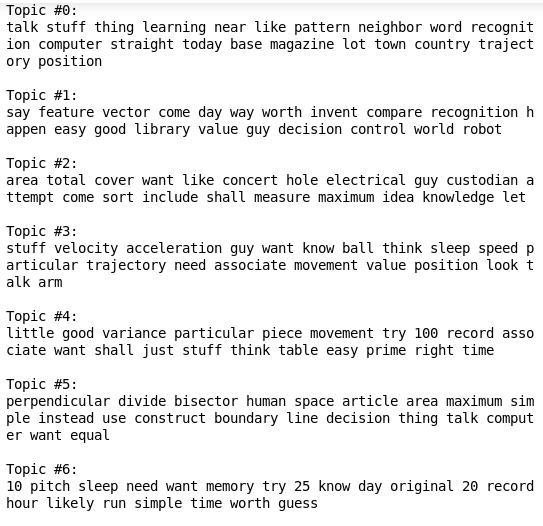
Winston AI 10
Differential Equations
(Latent Dirichlet Allocation)
AI
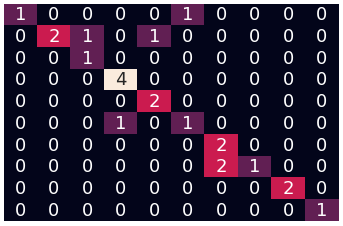
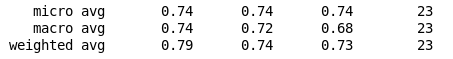
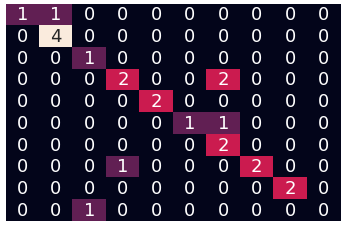
Modeling with TF-IDF vectorization
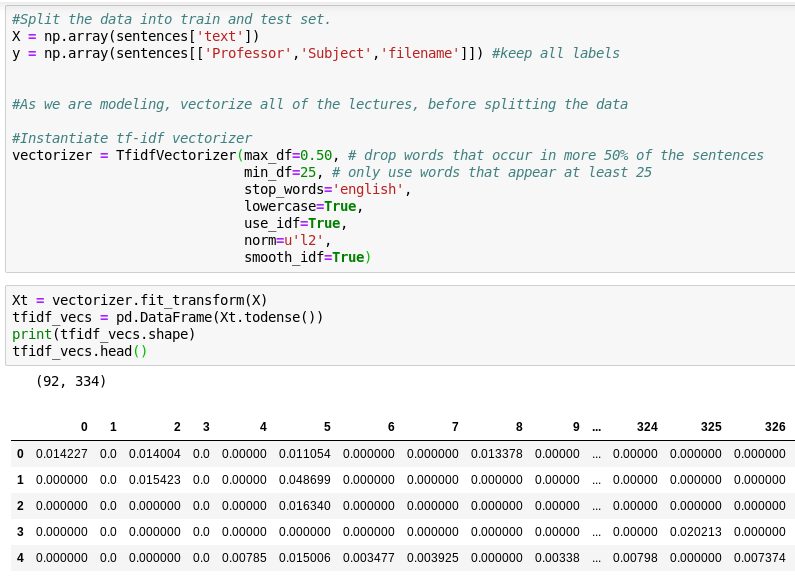
Initial Results with TF-IDF vectores
Logistic Regression
Multinomial NB
Random Forest
K Neighbors
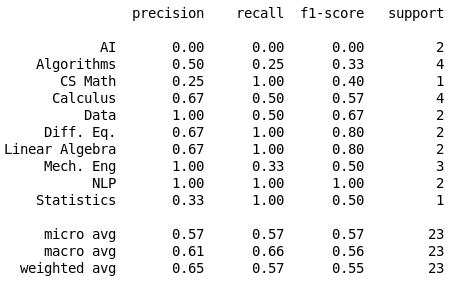
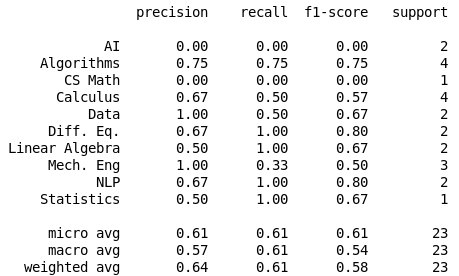
Logistic Regression
61%
Random Forest
80%
Multinomial NB
57%
KNN
63%
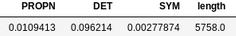
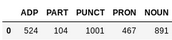
Other feature generation
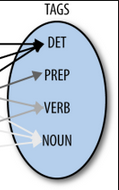
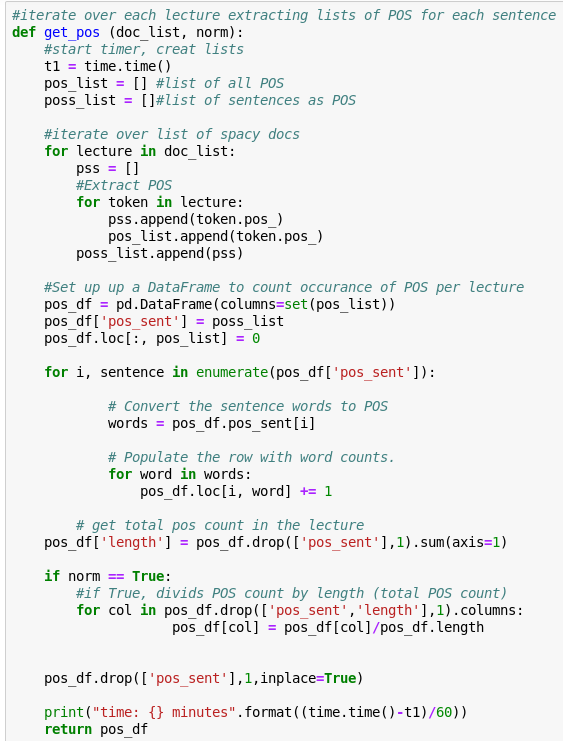

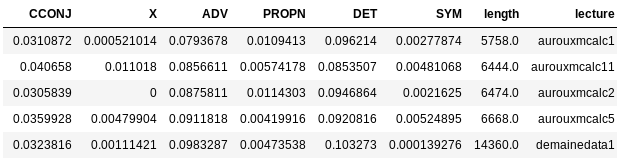
- Extract parts of speech (POS)
- Count occurrence of POS by lecture
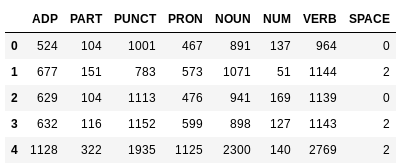
- Divide each POS by lecture length
List of Spacy Docs
True
False
norm=
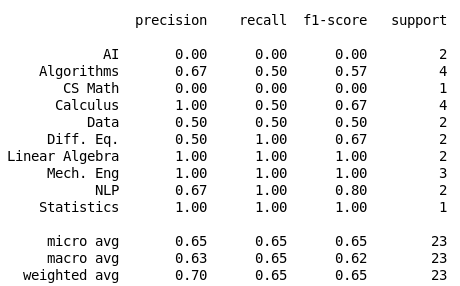
using POS only
Logistic Regression
Random Forest
90%
74%
using POS / len(total_lecture_pos)

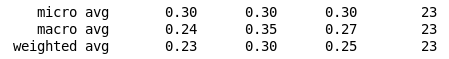
24%
92%
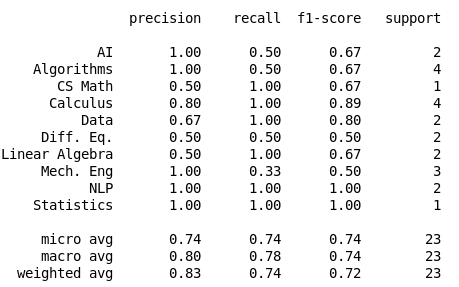
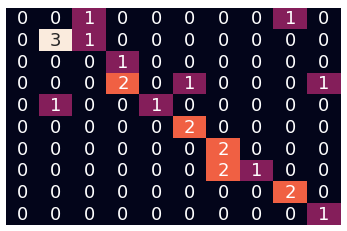
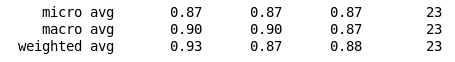
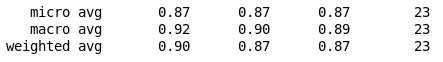
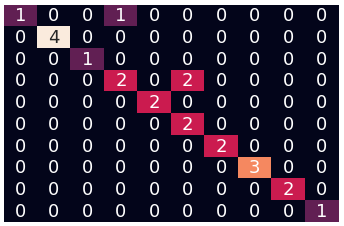
Parameter Search
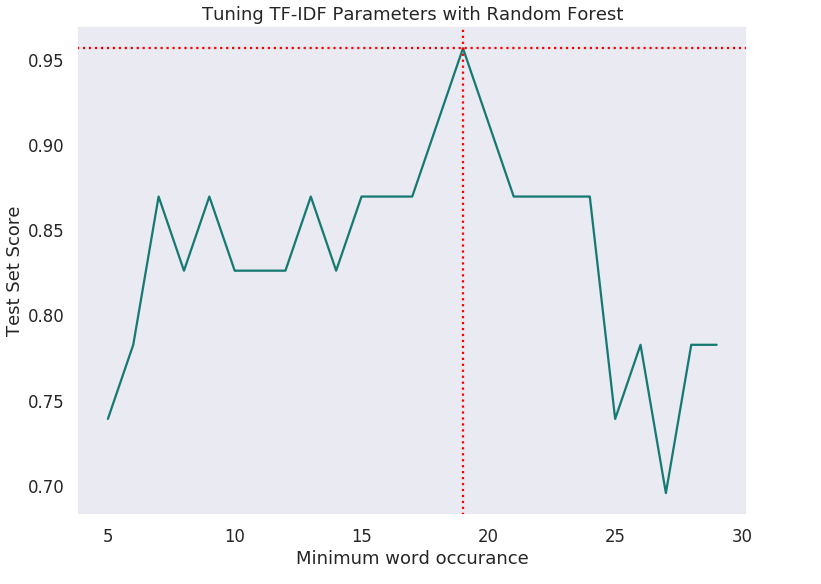
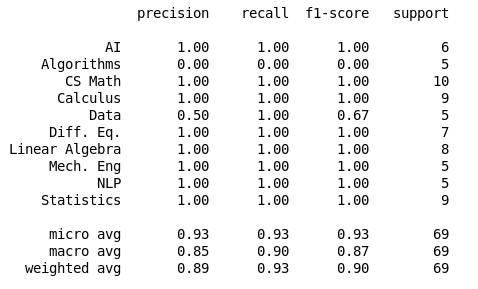
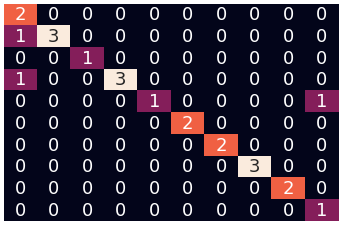
min_df = 19, score = 95.65%
tf-idf vectors
+
POS vectors
=
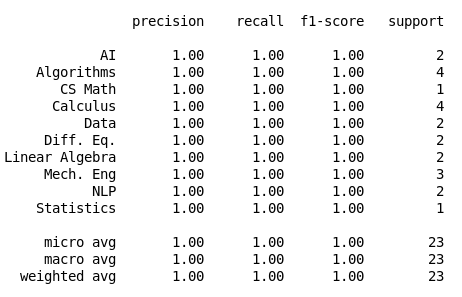
Random Forest (n_estimators=200, max_depth=4, min_samples_leaf=4, random_state=43, class_weight='balanced')
tf-idf df_min = 25
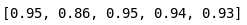

Cross Validation 5 folds
mean
New X
Modeling:
Clustering:
+ Able to identify similar subjects.
- Unable to decipher closely related subjects
- Unable to decipher professors
+ Very accurate
+ able to decipher professors
For further study
- Generate an overall rating of each lecture
- Youtube ratings, comments, view counts
- Predict the quality of newly posted content
- match most relevant new content for a given user
- Scale the data collection
- Programmatically obtain lecture subtitles from youtube's API
- Create new features based on sentiment analysis of comments