Yuriy Dadichin
Levi9 Senior FE Engineer
Performance issues detection using Chrome devtools
Page rendering processes
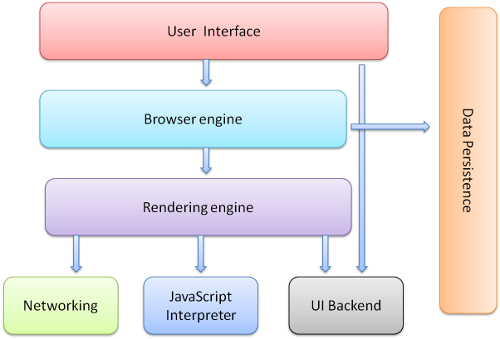
Browser components

Basic rendering flow

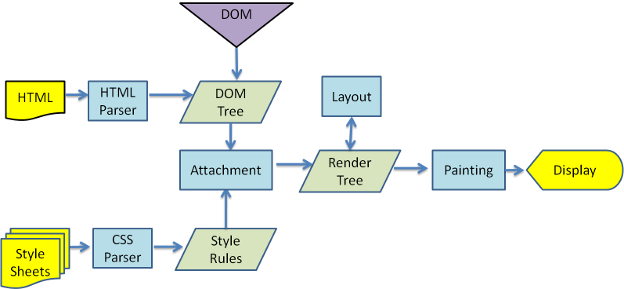
Webkit main flow

Performance issues
- Unpleasant scrolling
- To many/heavy paints
- Memory leaks
Timeline
-
Timeline diagram
-
Frames
-
CPU details
-
Call chains
-
Action time tree
-
GC
-
Zooms(just nice :))
Paint
- Summary
- Actions
- Draw actions
- Frames view
Memory
- JS Heap
- Documents
- Listeners
- Nodes
JS Stacks
- Events
- JS frames
- Animation frames
Rendering
Paint rectangles
- Avoid unnecessary paints
- Study painting behaviours
- Shows repainted areas for each frame making
Composited layer borders
- layers
- 3D or perspective transform CSS properties
- <video>
- <canvas> 3D (WebGL) or 2D context
- Composited plugins (i.e. Flash)
- Elements with CSS animation for their opacity
- Elements with accelerated CSS filters
- Element has a descendant that has a compositing layer
- Element has a sibling with a lower z-index which has a compositing layer
FPS meter
- GPU memory usage
- Low/Hi FPS
- FPS of last render cycle
Continuous page repainting
- Max/min repaint time
- Last repaint time
- Memory usage
Potential scroll bottlenecks
- Scroll repaints