Politics through the Lens of Economics
Lecture 6: Probabilitic Voting Model
Masayuki Kudamatsu
8 November, 2017
What evidence do we need to explain
whether the citizen-candidate model explains
the lack of tuition-free higher education
in Japan?
Discussion Time
Background information #1
Source: OECD (2017)
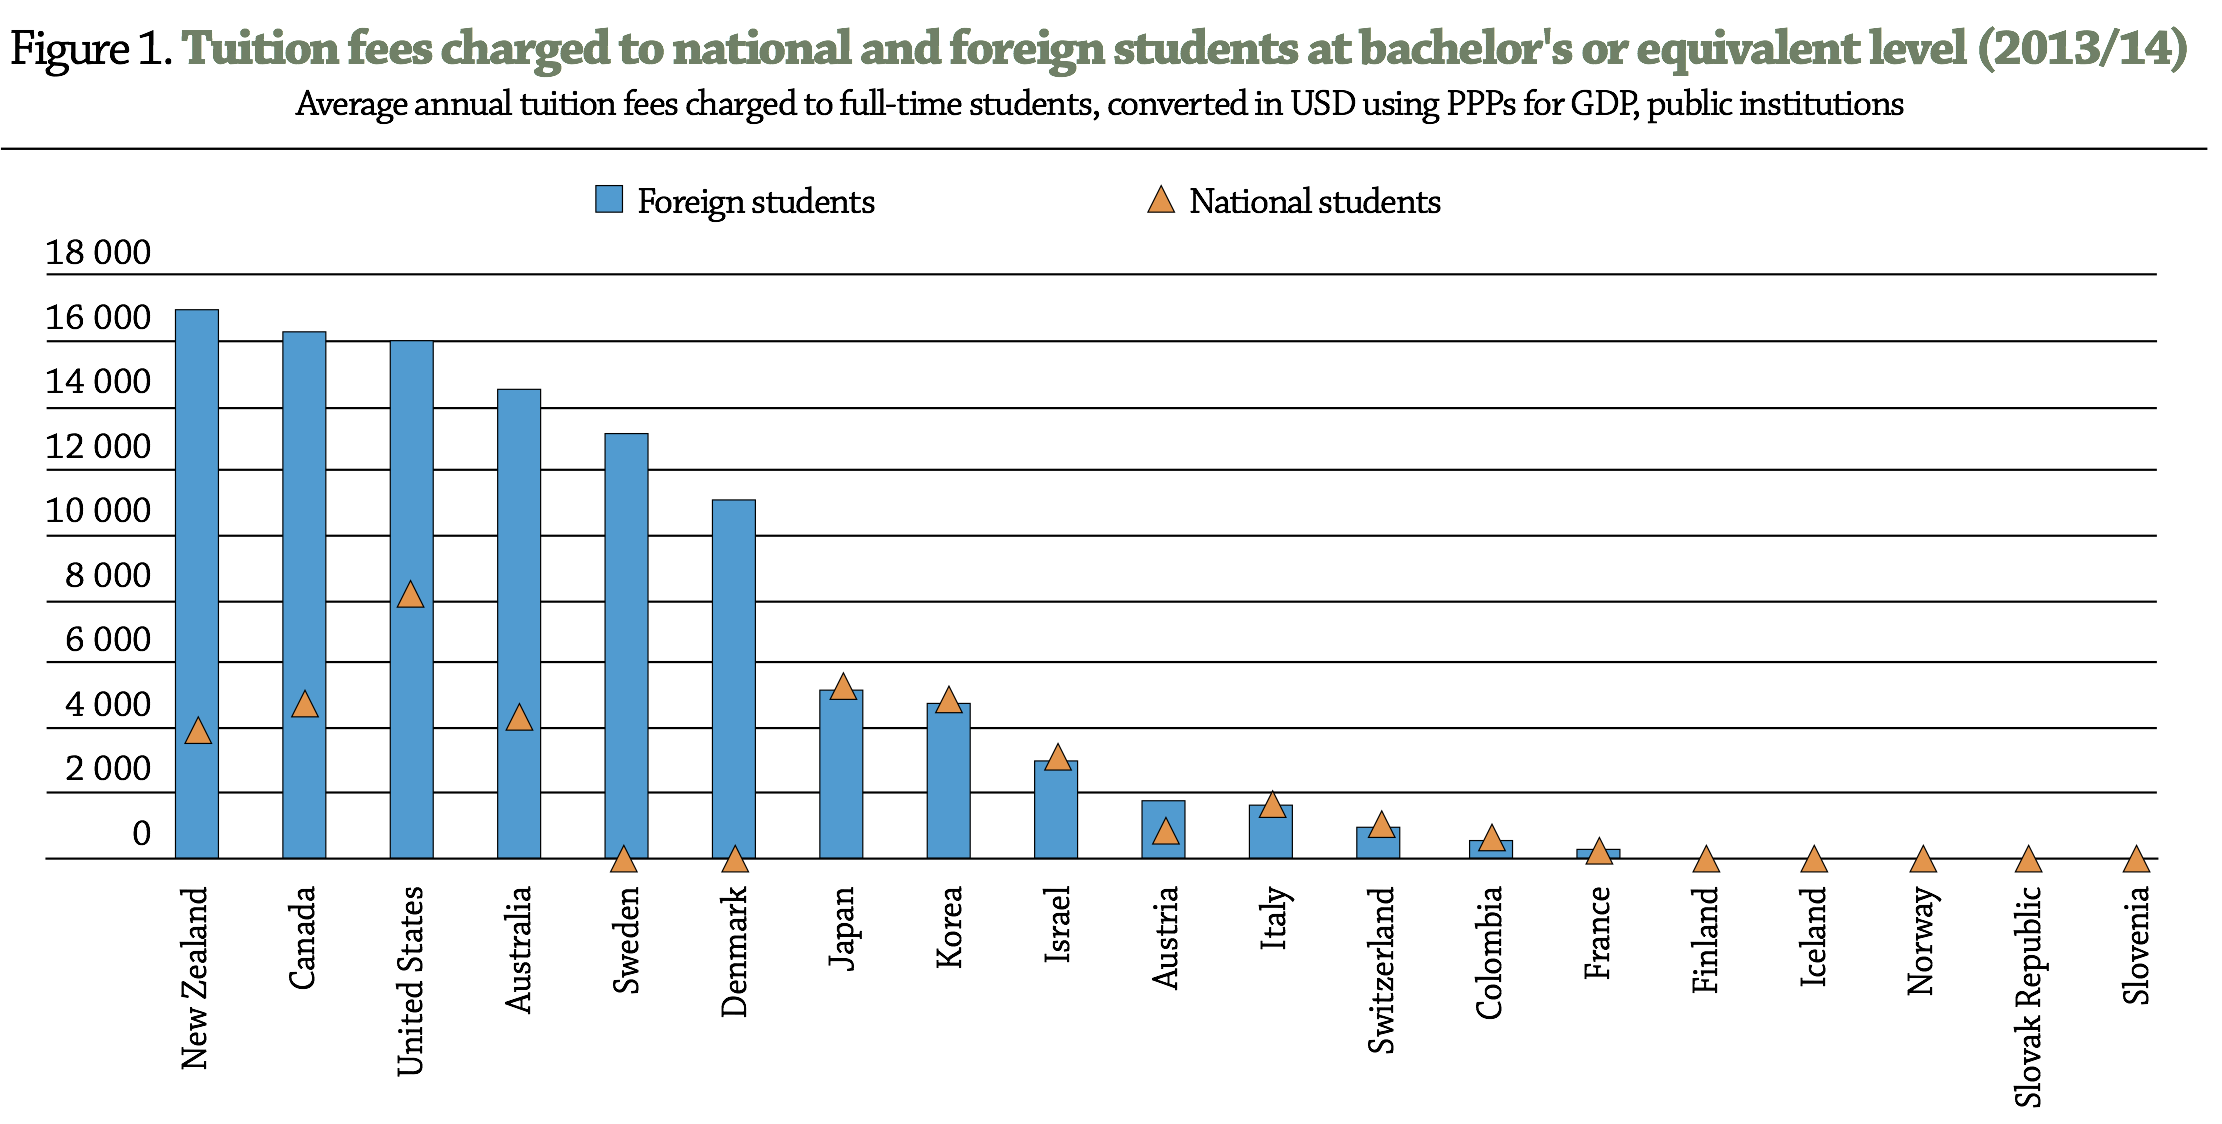
Nordic countries offer tuition-free higher education
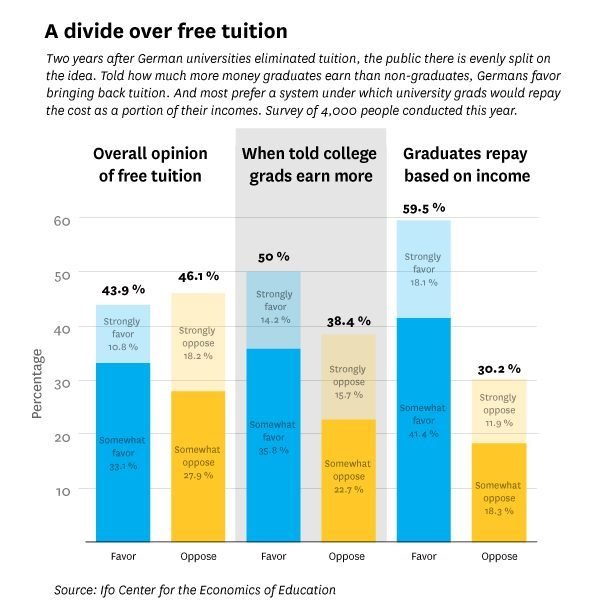
Background information #2
Germany eliminated
tuition for higher education
in 2015
But the public opinion is divided
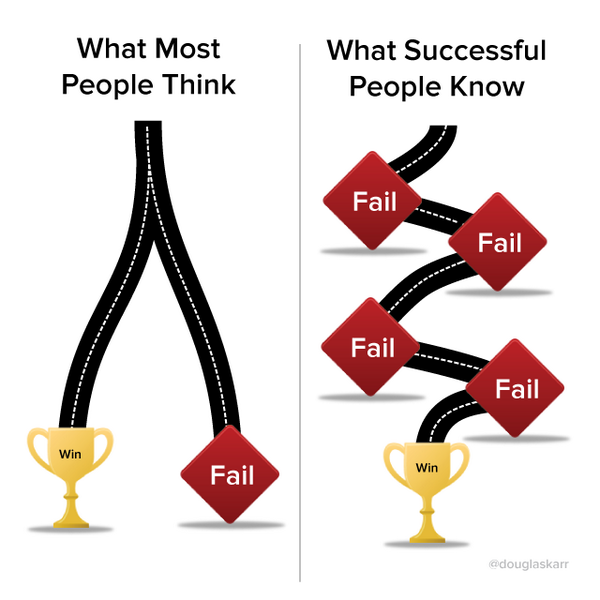
Aim to come up with a wrong answer
What evidence do we need to explain
whether the citizen-candidate model explains
the lack of tuition-free higher education
in Japan?
Discussion Time
Today's Road Map

Probabilistic Voting Model
Testing the Swing Voter Hypothesis
Motivation
There doesn't always exist the "median policy"
Median policy beats any other policies in majority voting
Median
policy
More than 50%
Vote for median policy
Other
policy
Motivation
Most important example:
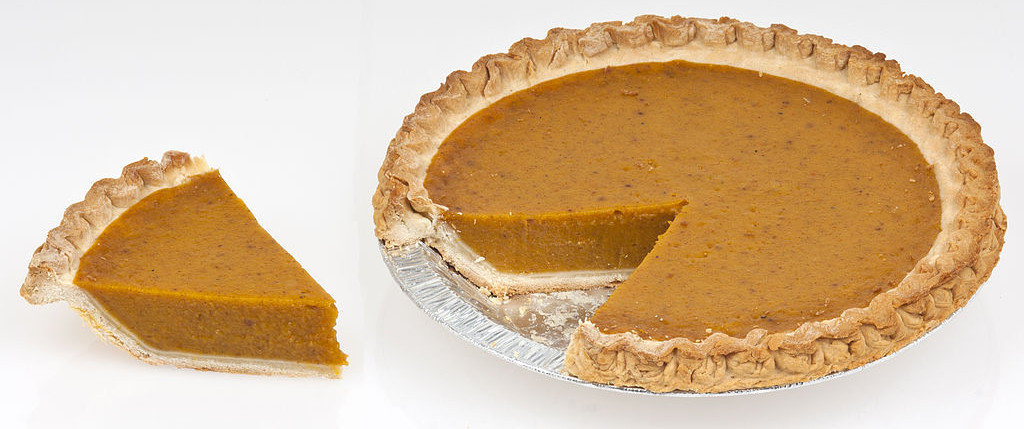
Division of a pie
There doesn't always exist the "median policy"
An example of the division-of-a-pie problem
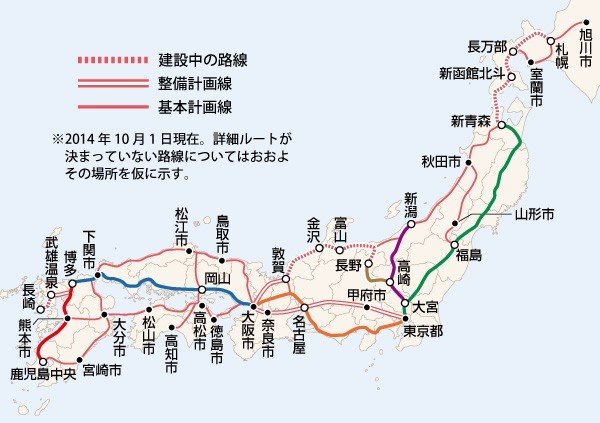
Image source: trafficnews.jp/post/36474/
A fixed budget for building shinkansen
Which prefecture gets shinkansen stations?
In the "division-of-a-pie" problem
No policy wins the majority against any policy
Consider 3 districts with equal # of voters
Once fixing
the shares
of two districts
e.g.
The 3rd district's share is automatically determined
the "division-of-a-pie" problem with three groups of voters
District 2's share
District 1's share
(0,0)
(0,100)
(100,0)
So a two-dimensional diagram can represent
District 3 gets all
the "division-of-a-pie" problem with three groups of voters
District 2's share
District 1's share
(0,0)
(0,100)
(100,0)
(50, 50)
So a two-dimensional diagram can represent
District 3 gets nothing
the "division-of-a-pie" problem with three groups of voters
District 2's share
District 1's share
(0,0)
(0,100)
(100,0)
(50, 50)
(1/3,1/3)
So a two-dimensional diagram can represent
District 3 gets 1/3
District 2's share
District 1's share
(0,0)
(50,50)
(0,0) is defeated by, say, (50,50)
In the "division-of-a-pie" problem
No policy wins the majority against any policy
District 2's share
District 1's share
(50,50)
(50,50) is defeated by, say, (55,0)
(55,0)
In the "division-of-a-pie" problem
No policy wins the majority against any policy
District 2's share
District 1's share
(0,50)
(55,0) is defeated by, say, (0,50)
(55,0)
In the "division-of-a-pie" problem
No policy wins the majority against any policy
District 2's share
District 1's share
(0,50)
(0,50) is defeated by, say, (45,55)
(45,55)
and so on...
In the "division-of-a-pie" problem
No policy wins the majority against any policy
District 2's share
District 1's share
How can we analyze this type of policy issues?
Two approaches
Probabilistic Voting Model
Legislative Bargaining Model
(This lecture)
(Lecture 12)
Probabilistic Voting Model
Step 1. Two parties offer how to divide a pie across groups of voters
By promising
how to divide a pie
By selecting a candidate
whose ideal policy is
the proposed way of
dividing a pie
OR
This model doesn't rely on the commitment assumption
Probabilistic Voting Model
Step 2. Voters choose which party to vote based on 2 considerations
i. Amount of a pie allocated to their group
ii. Which party wins the election
Examples of voter group
Probabilistic Voting Model: Assumption 1
Voters care about the share of a pie to their group
District
Occupation
Class / Ethnicity


All voters in the same group equally benefit from a given share
Probabilistic Voting Model: Assumption 1
Voters care about the share of a pie to their group
Probabilistic Voting Model: Assumption 2
Voters also care about which party wins the election
e.g.
Ideology
That is, parties cannot commit to the 2nd "policy"
Candidate's appearance
Probabilistic Voting Model: Assumption 2
Voters also care about which party wins the election
In this dimension, voters differ within the same group
How voters choose which party to vote
Ideological bias
to party B
0
Line up voters by their ideological bias to party B
For a group of voters
Each voter's optimization
How voters choose which party to vote
Ideological bias
to party B
0
If parties A and B offer the same division of a pie:
Vote for A
Vote for B
Each voter's optimization
Ideological bias
to party B
0
If party A offers more than party B does
Vote for A
Vote for B
Switch to A
How voters choose which party to vote
Each voter's optimization
Ideological bias
to party B
0
If party B offers more than party A does
Vote for A
Vote for B
Switch to B
Each voter's optimization
How voters choose which party to vote
Now for the ease of exposition, imagine:
Voters are grouped into different districts
Parties offer the provision of local public goods to each district
Everyone in the district benefits
but no one else in other districts
e.g. roads, railway stations, public schools, public hospitals
Consider a district
# citizens
Ideological bias
to party B
0
In the absence of local public goods:
# citizens
Ideological bias
to party B
0
Vote for A
# citizens
Ideological bias
to party B
0
Vote for B
In the absence of local public goods:
Now party A proposes local public good to this district
# citizens
Ideological bias
to party B
0
Vote for A
Benefit from
local public good
Now party A proposes local public good to this district
# citizens
Ideological bias
to party B
0
Still Vote for B
These party B supports "swing" to party A
in response to local public good offer
# citizens
Ideological bias
to party B
0
Now consider another district
# citizens
Ideological bias
to party B
0
Citizens are more heterogeneous in ideology
Now consider another district
# citizens
Ideological bias
to party B
0
Vote for A
In the absence of local public good
Now consider another district
# citizens
Ideological bias
to party B
0
Vote for B
In the absence of local public good
If party A proposes local public good to this district
# citizens
Ideological bias
to party B
0
Benefit from
local public good
These party B supporters "swing" to party A
Which district will party A target local public good provision?
# citizens
Ideological bias
to party B
0
Benefit from
local public good
Answer: the district with more "swing voters"
# citizens
Ideological bias
to party B
0
Benefit from
local public good
Now consider three districts ideologically different
# citizens
Ideological bias
to party B
0
1
2
3
District 1 citizens will vote for party A anyway
# citizens
Ideological bias
to party B
0
1
Party A doesn't need to offer local public good
District 3 citizens will vote for party B
# citizens
Ideological bias
to party B
0
3
unless a lot of local public good is provided by party A
District 2 citizens are cheapest to swing
# citizens
Ideological bias
to party B
0
2
Which district will party A target, then?
# citizens
Ideological bias
to party B
0
1
2
3
Answer: district 2
# citizens
Ideological bias
to party B
0
2
Vote for A
(even if it's less populous)
To summarize, party A targets its local public good provision to
1. Districts ideologically neutral
# citizens
Ideological bias
to party B
0
# citizens
Ideological bias
to party B
0
To summarize, party A targets its local public good provision to
2. Districts more homogenous (among those neutral)
Now we know which district is offered with local public goods
But how much?
# citizens
Ideological bias
to party B
0
How much of local public goods does Party A offer?
Consider two ideologically neutral districts
Ideological bias
to party B
0
0
Benefit (net of tax)
Tax burden
Citizens in both districts pay taxes to produce local public goods
Ideological bias
to party B
0
Some citizens in the other district swing to party B
0
Benefit (net of tax)
Tax burden
Loss of votes
Gain of votes
Now remember the law of diminishing marginal utility
Local
public goods
Extra benefit
Net income
Extra benefit
Local
public goods
Extra benefit
Net income
Extra benefit
First few units of local public goods
Large benefit
Small
cost
Ideological bias
to party B
0
0
Benefit (net of tax)
Tax burden
Loss of votes
Gain of votes
For first few units, gain of votes exceeds loss of votes
Local
public goods
Extra benefit
Net income
Extra benefit
More units of local public goods
Smaller benefit
Larger
cost
Ideological bias
to party B
0
0
Benefit (net of tax)
Tax burden
Extra loss
Extra gain
For more units, gain of votes becomes smaller than loss of votes
Ideological bias
to party B
0
0
Benefit (net of tax)
Extra loss = Extra gain
For party A's optimization (i.e. maximizing # of votes)
Tax burden
Ideological bias
to party B
0
0
Offer exactly the same policy to swing voters back
For party B's optimization
Ideological bias
to party B
0
0
At the cost of losing voters in the other district
For party B's optimization
Ideological bias
to party B
0
Equilibrium: both parties offer the same policy
Vote for A
Vote for B
Ideological bias
to party B
0
Neither party wants to deviate:
Vote for A
Vote for B
By increasing local public good, they lose votes
The equilibrium is more like a "fairy tale", not very realistic
Key lesson from the probabilistic voting model:
Politicians target
districts with more swing voters
known as the swing voter hypothesis
Today's Road Map
Probabilistic Voting Model
Testing the Swing Voter Hypothesis
Core vs Swing voter debate
Political scientists often argue:
Politicians target loyal voters, not swing voters
They propose (at least) two reasons for this claim
Politicians know better
how to please
their loyal supporters
Loyal supporters
more likely to turn out
in return for favour
(For economists, these claims are not "micro-founded".)
Core vs Swing voter debate
Evidence is inconclusive, because...
Voters' ideological bias is difficult to observe
Popular measure: incumbent's winning margin in previous election
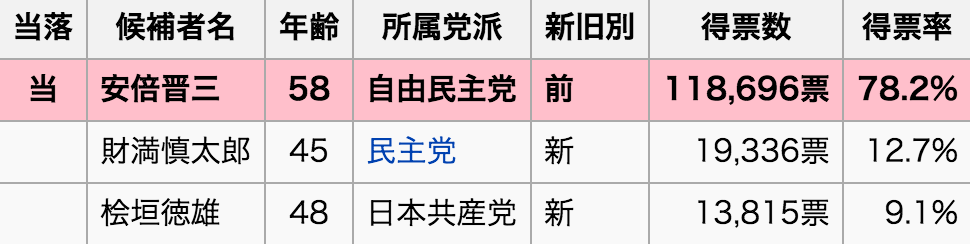
e.g. the 2012 Lower House Election in Japan (Yamaguchi 4th district)
Winning margin
78.2-12.7=65.5pt
Source: ja.wikipedia.org/wiki/%E5%B1%B1%E5%8F%A3%E7%9C%8C%E7%AC%AC4%E5%8C%BA
Core vs Swing voter debate
But the election outcome is
voters' response to previous policy
And policy is often sticky across periods
Winning margin
in previous election
Policy during
the previous period
Policy during
the current period
Core vs Swing voter debate
Large
winning margin
Receive transfer
the previous period
Receive transfer
the current period
If the swing voter hypothesis is correct,
we should see in the swing district:
Correlation
with
loyal voters
Core vs Swing voter debate
How can we obtain
a measure of voters' ideology
that's NOT a response to policy?
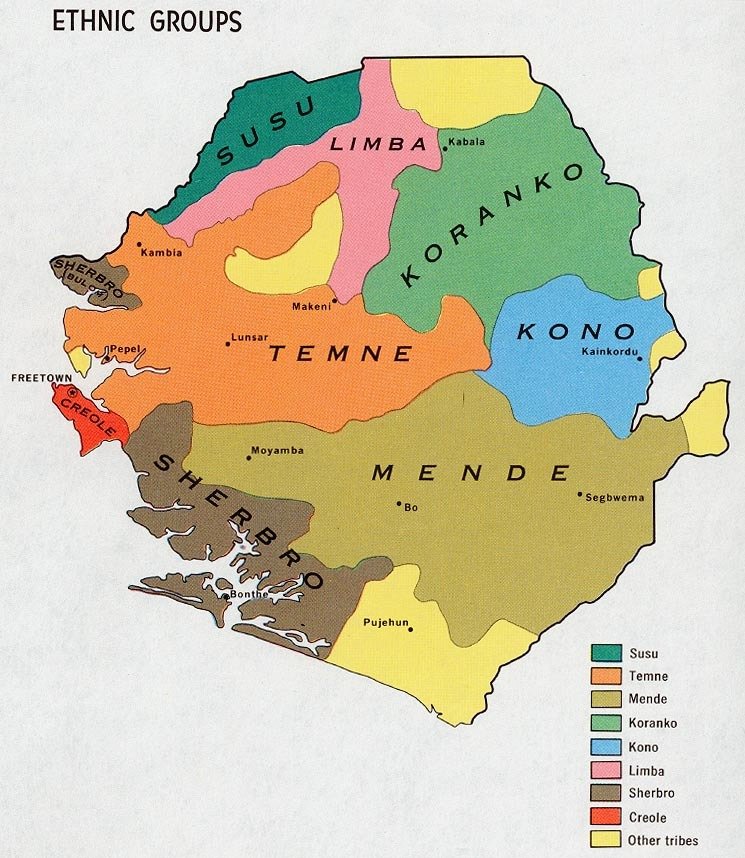
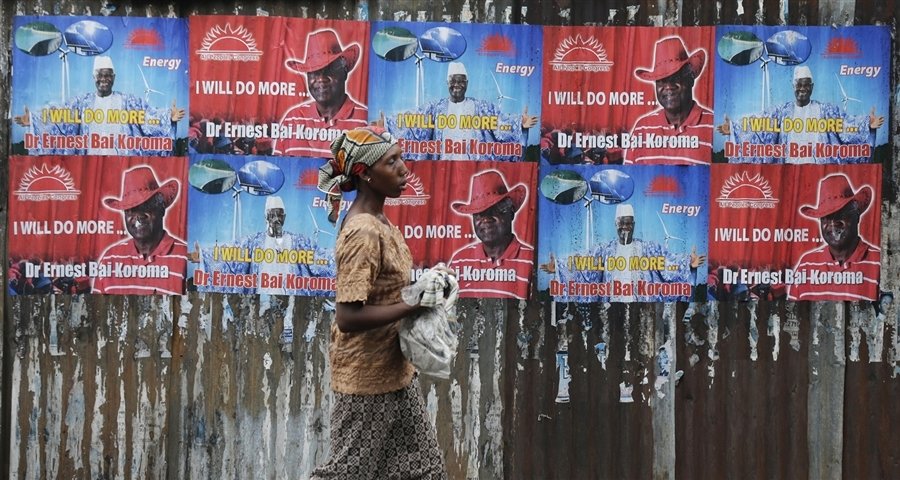
Sierra Leone as a testing ground
Image source: www.bbc.com/news/world-africa-14094194
Sierra Leone as a testing ground
Various ethnic groups live in different parts of the country
Sierra Leone as a testing ground
SLPP
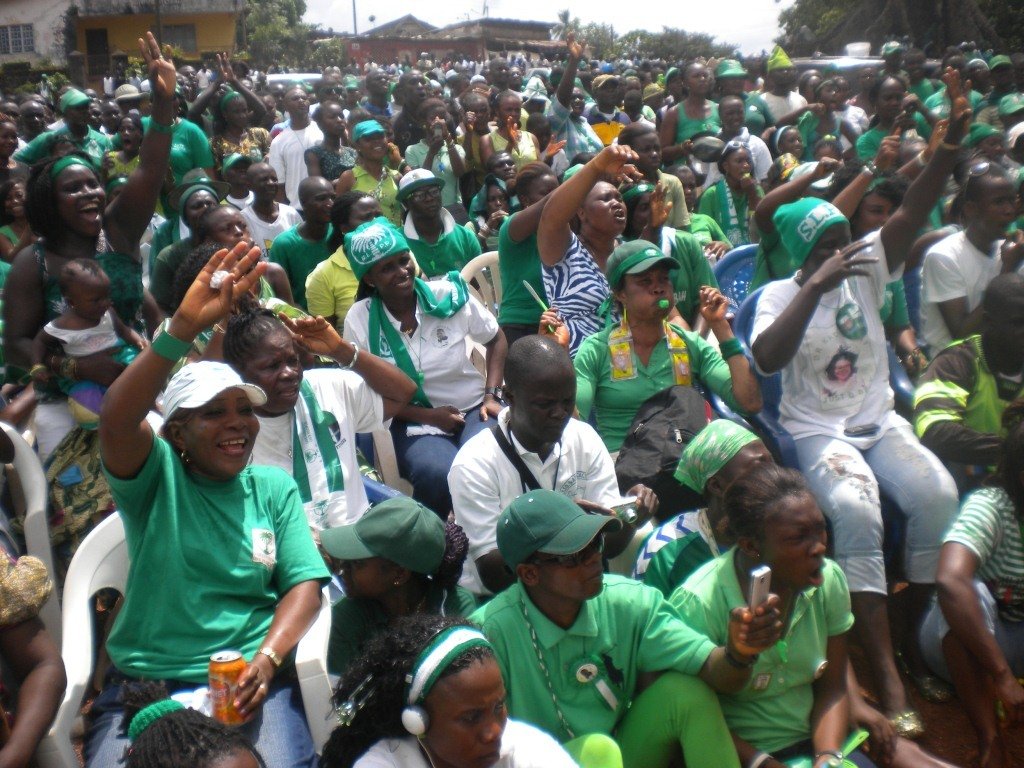
APC
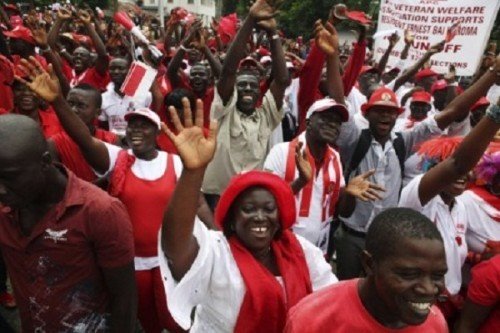
Two parties have dominated politics since independence in 1961
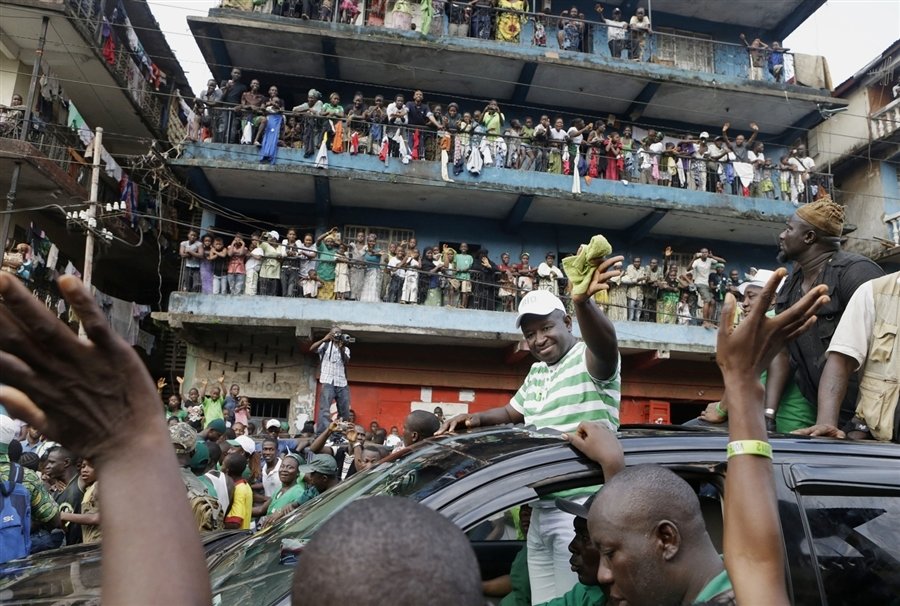
Sierra Leone as a testing ground
SLPP
APC
Anecdotally, ethnicity is known to predict which party to vote
Since ethnicity cannot be changed,
Ethnicity can be used as
a measure of voters' ideology
that's NOT a response to policy !
Measuring "swing" districts
Step 1: Calculate each ethnic group's bias towards APC by:
% of those
who voted for
APC
% of those
who voted for
SLPP
-
Based on the nation-wide voting data
(not the district-level, which is a response to district-targeting policy)
Table 1 of Casey (2015)
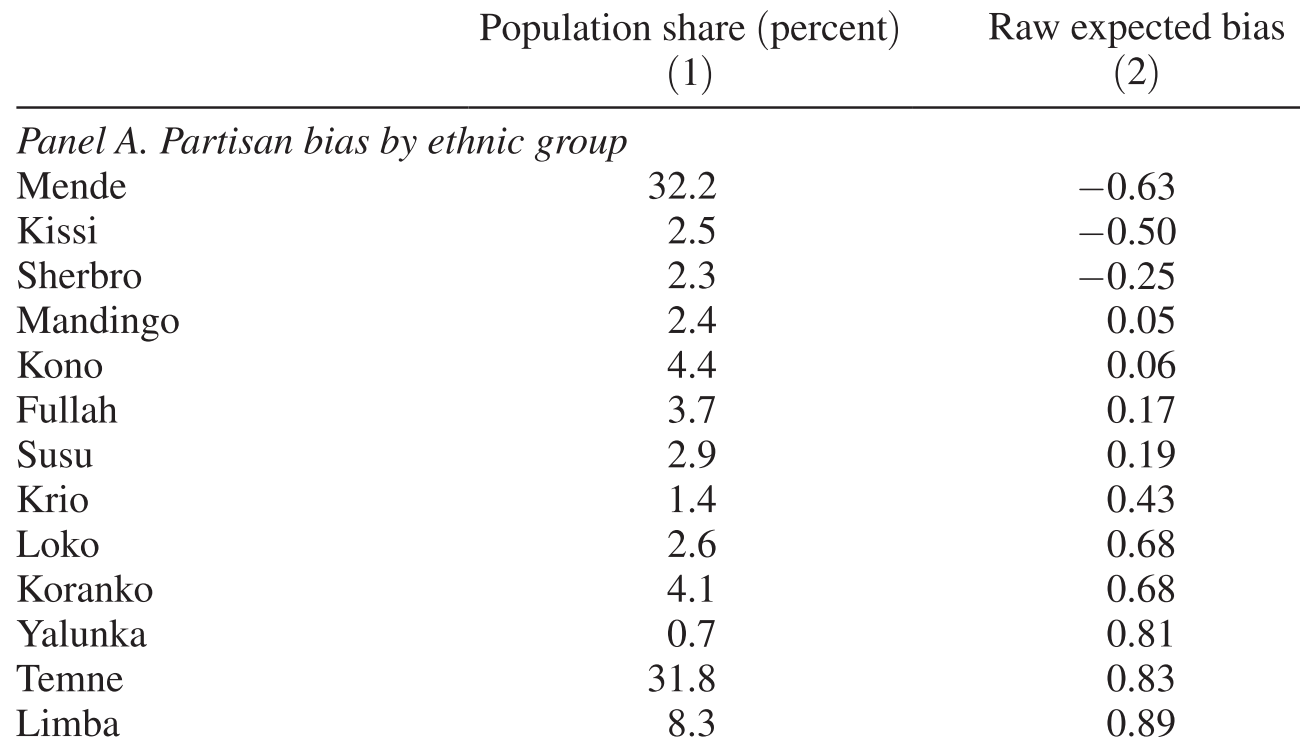
Ethnicity
Population share (%)
Bias to APC
Loyal to APC
Loyal to SLPP
Swing voters
For each district of Sierra Leone, calculate:
population-weighted average
of bias to APC across ethnic groups
e.g.
60% Temne (bias 0.83) and 40% Limba (bias 0.89)
0.83 x 0.6 + 0.89 x 0.4 = 0.854
Measuring "swing" districts
Step 2:
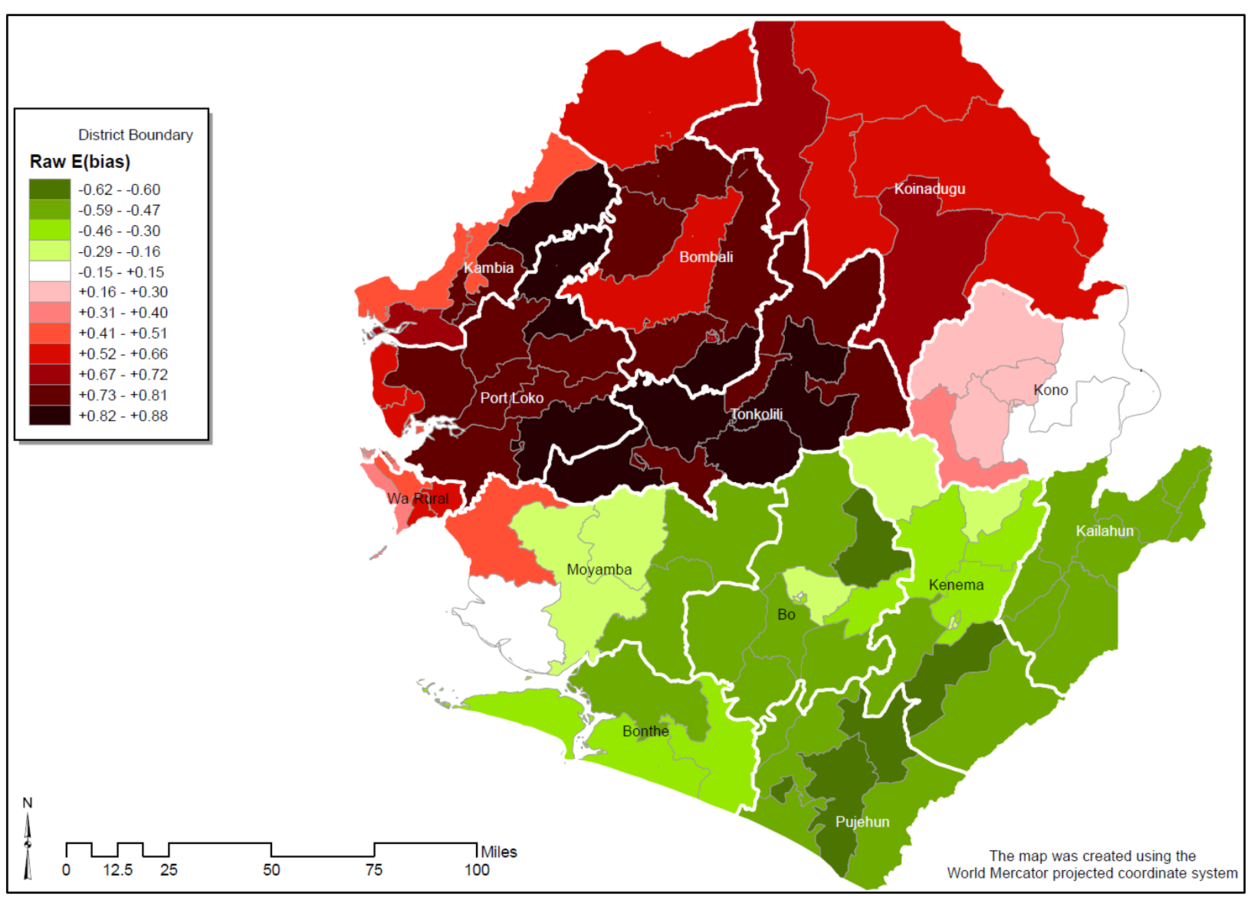
Appendix Figure 1 of Casey (2015)
Light-coloured areas: swing districts
Measure of government policy #1
Electoral campaign spendings during the national elections
in 2007
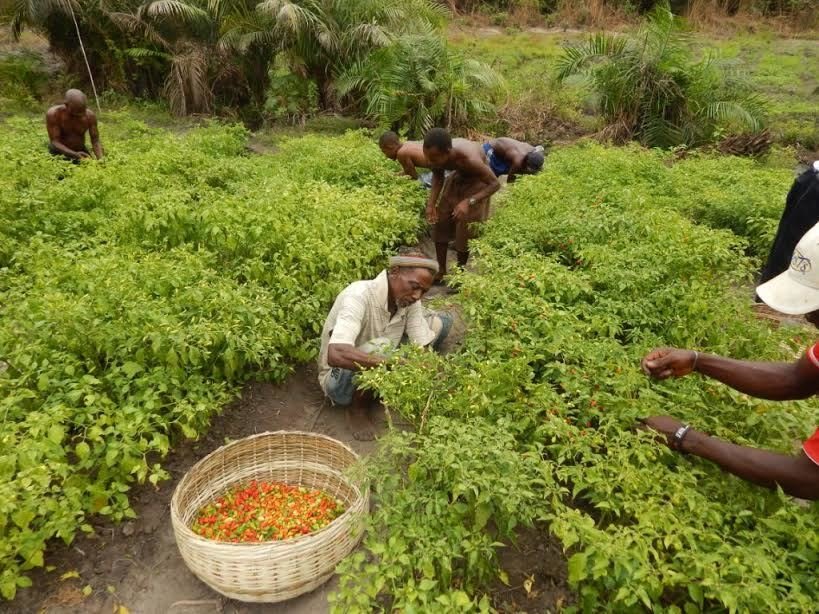
Local Government Development Grants (LGDG) during 2004-2007
Fiscal transfer from central to local governments
Spent on roads, agriculture, etc.

Measure of government policy #2
Appendix Figure 4 of Casey (2015)
Swing districts attract campaign spendings
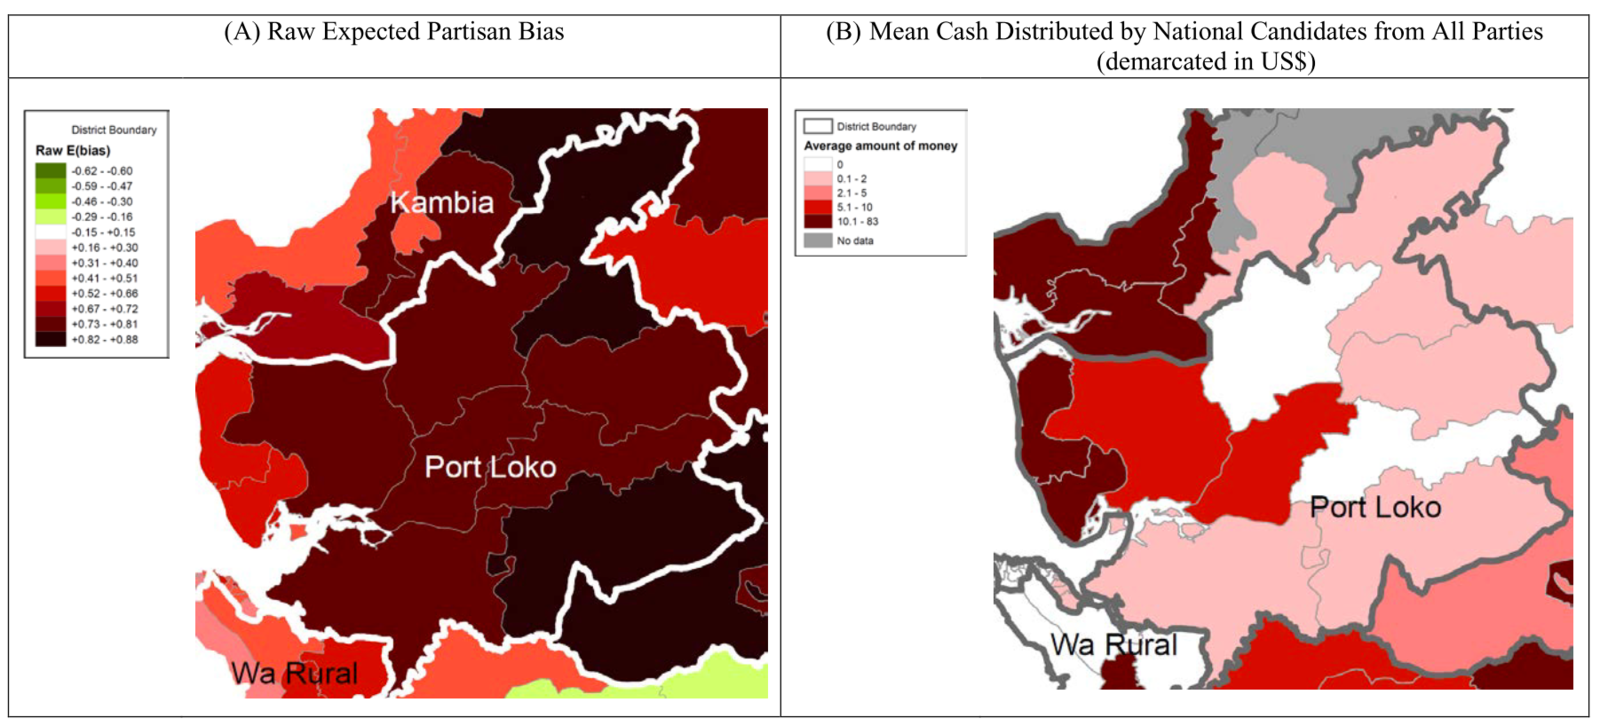
Figure 1 of Casey (2015)
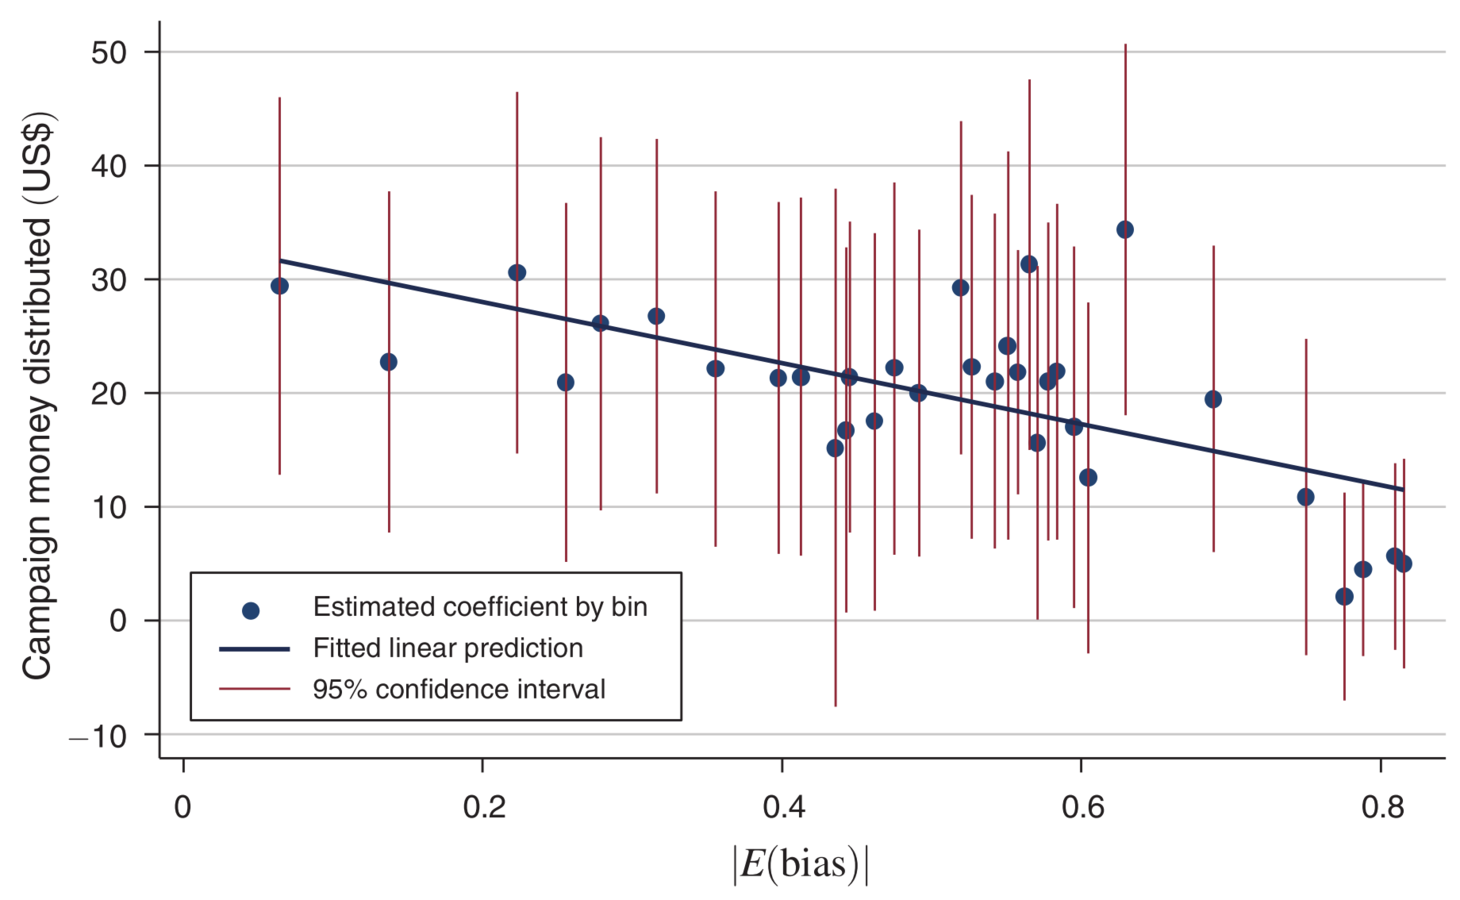
Swing districts attract campaign spendings
Biased to either party
Source: page 2430 of Casey (2015)
Swing districts attract more fiscal transfer
Difference between most biased and most neutral districts
19,575 US dollars
Summary
Politicians target swing voters for the division-of-a-pie policy
(More evidence needed, though)
Next lecture
Applying the probabilistic voting model to analyze
1. Impact of electoral rules
Proportional Representation
Majoritarian
vs
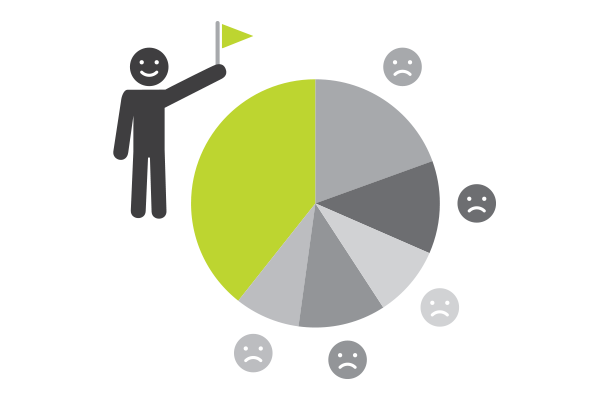
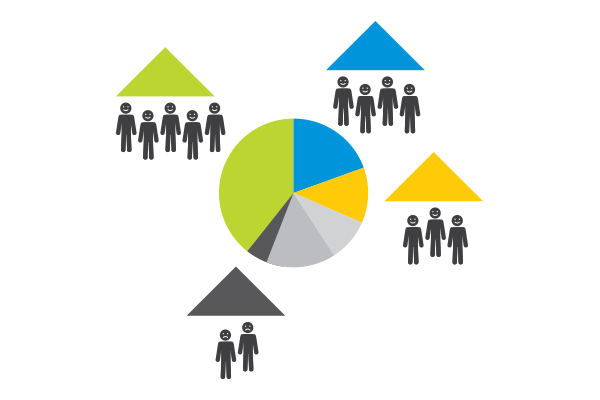
image source: move.bg/nakratko-za-izbornite-sistemi-en
Next lecture
Applying the probabilistic voting model to analyze

2. Voter intimidation
This lecture is based on the following academic articles and books:
Casey, Katherine. 2015. “Crossing Party Lines: The Effects of Information on Redistributive Politics.” American Economic Review 105(8): 2410–48.
Lindbeck, Assar, and Jörgen W. Weibull. 1987. “Balanced-Budget Redistribution as the Outcome of Political Competition.” Public Choice 52: 273–97.
See also section 3.4 of Persson, Torsten, and Guido Tabellini. 2000. Political Economics: Explaining Economic Policy. Cambridge, Massachusetts: MIT Press.