Obtain original web presentation here:
https://slides.com/odineidolon/chym2019-2/fullscreen
This PDF version is of lower quality
Climate change impact on hydrology: the Italian case study
Adriano Fantini
ICTP, Trieste, Italy
afantini@ictp.it
Present climate
Present hydrology
Future climate
Future hydrology

PR Change
Q Change
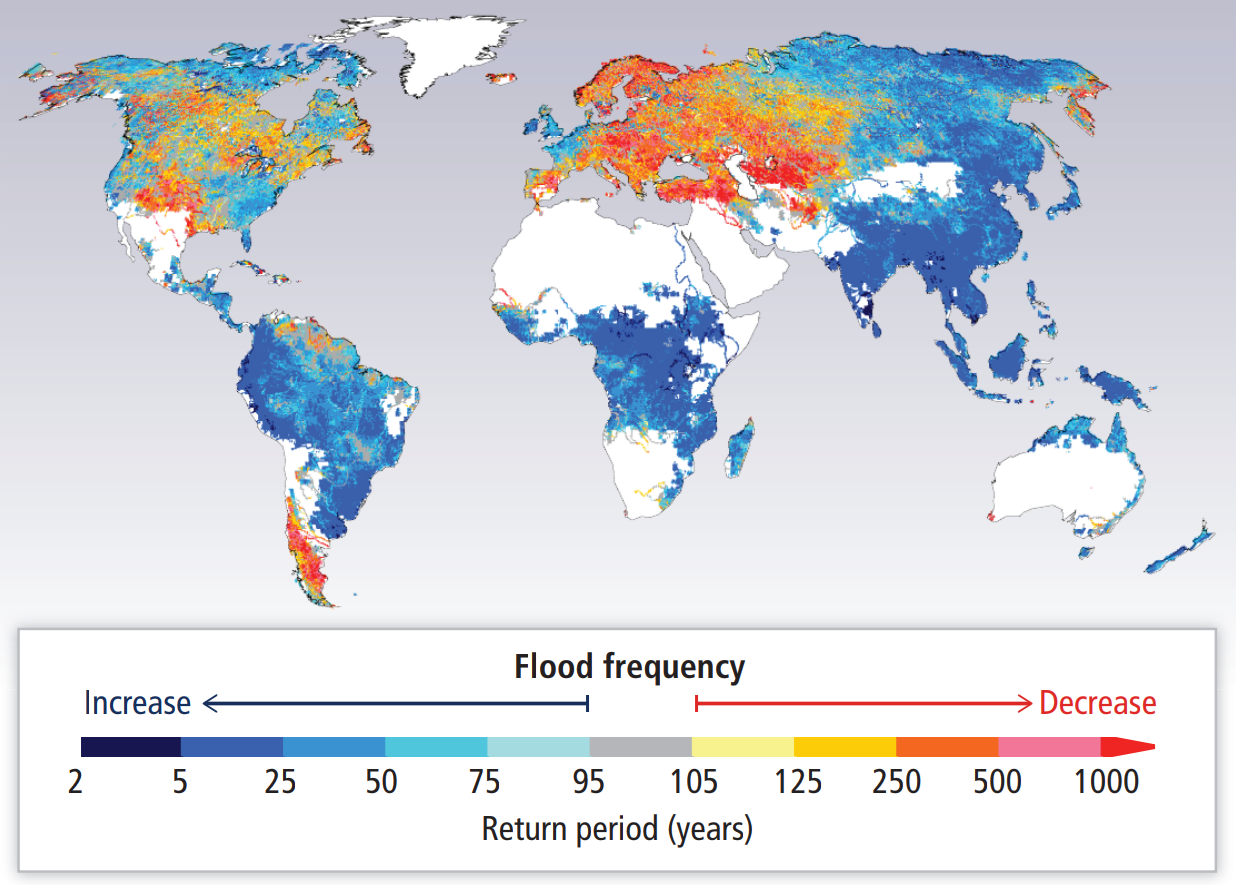
Motivation
Mixed results over Italy in the literature:
- General increase in flood proxies by the end of the century
- Especially for Northern Italy
- Low resolution does not resolve smaller basins
Alfieri et al. (2015); Thober et al. (2018); Donnelly et al. (2017)
Hirabayashi et al. (2013); Rojas et al. (2012);
Starting point: RCP8.5 climate simulations
- RegCM 4.6.1 climate simulation
- 1971-2100
- Precipitation and temperature
- HadGEM-driven
- RCP8.5 scenario (business as usual)

Objective: identify future changes in discharge over Italy
- Mean discharges
- Extremes
- Do discharge changes follow precipitation changes?
A step back: the GRIPHO dataset
Two main goals:
- Driving the hydrological model with high resolution data
- Validating the regional climate simulations
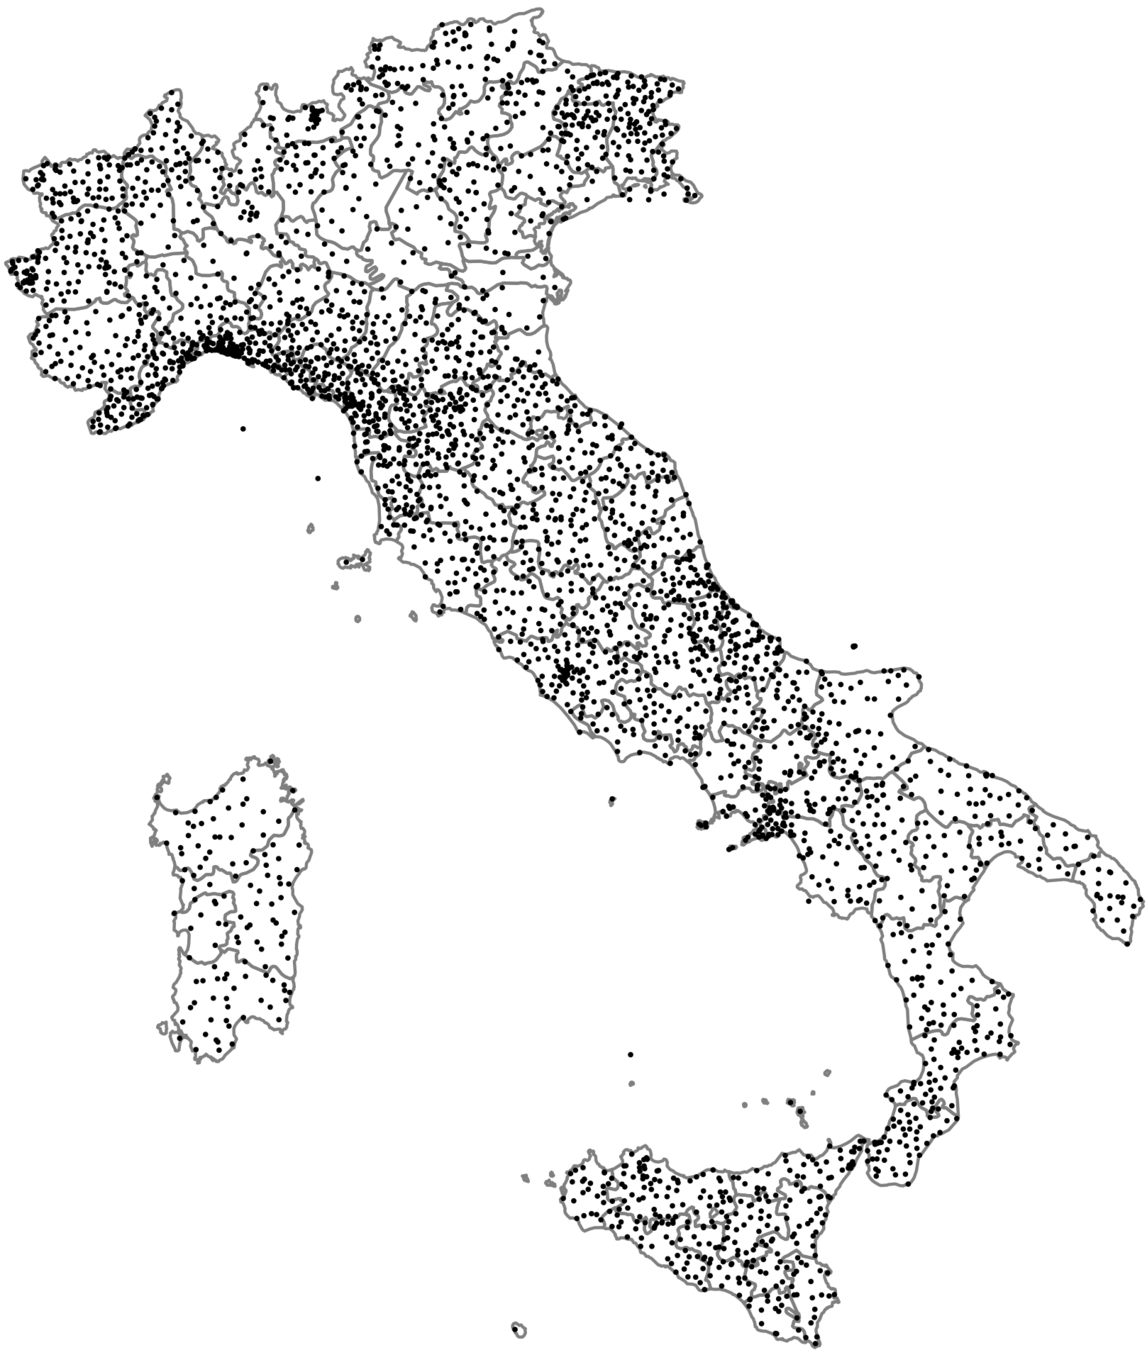
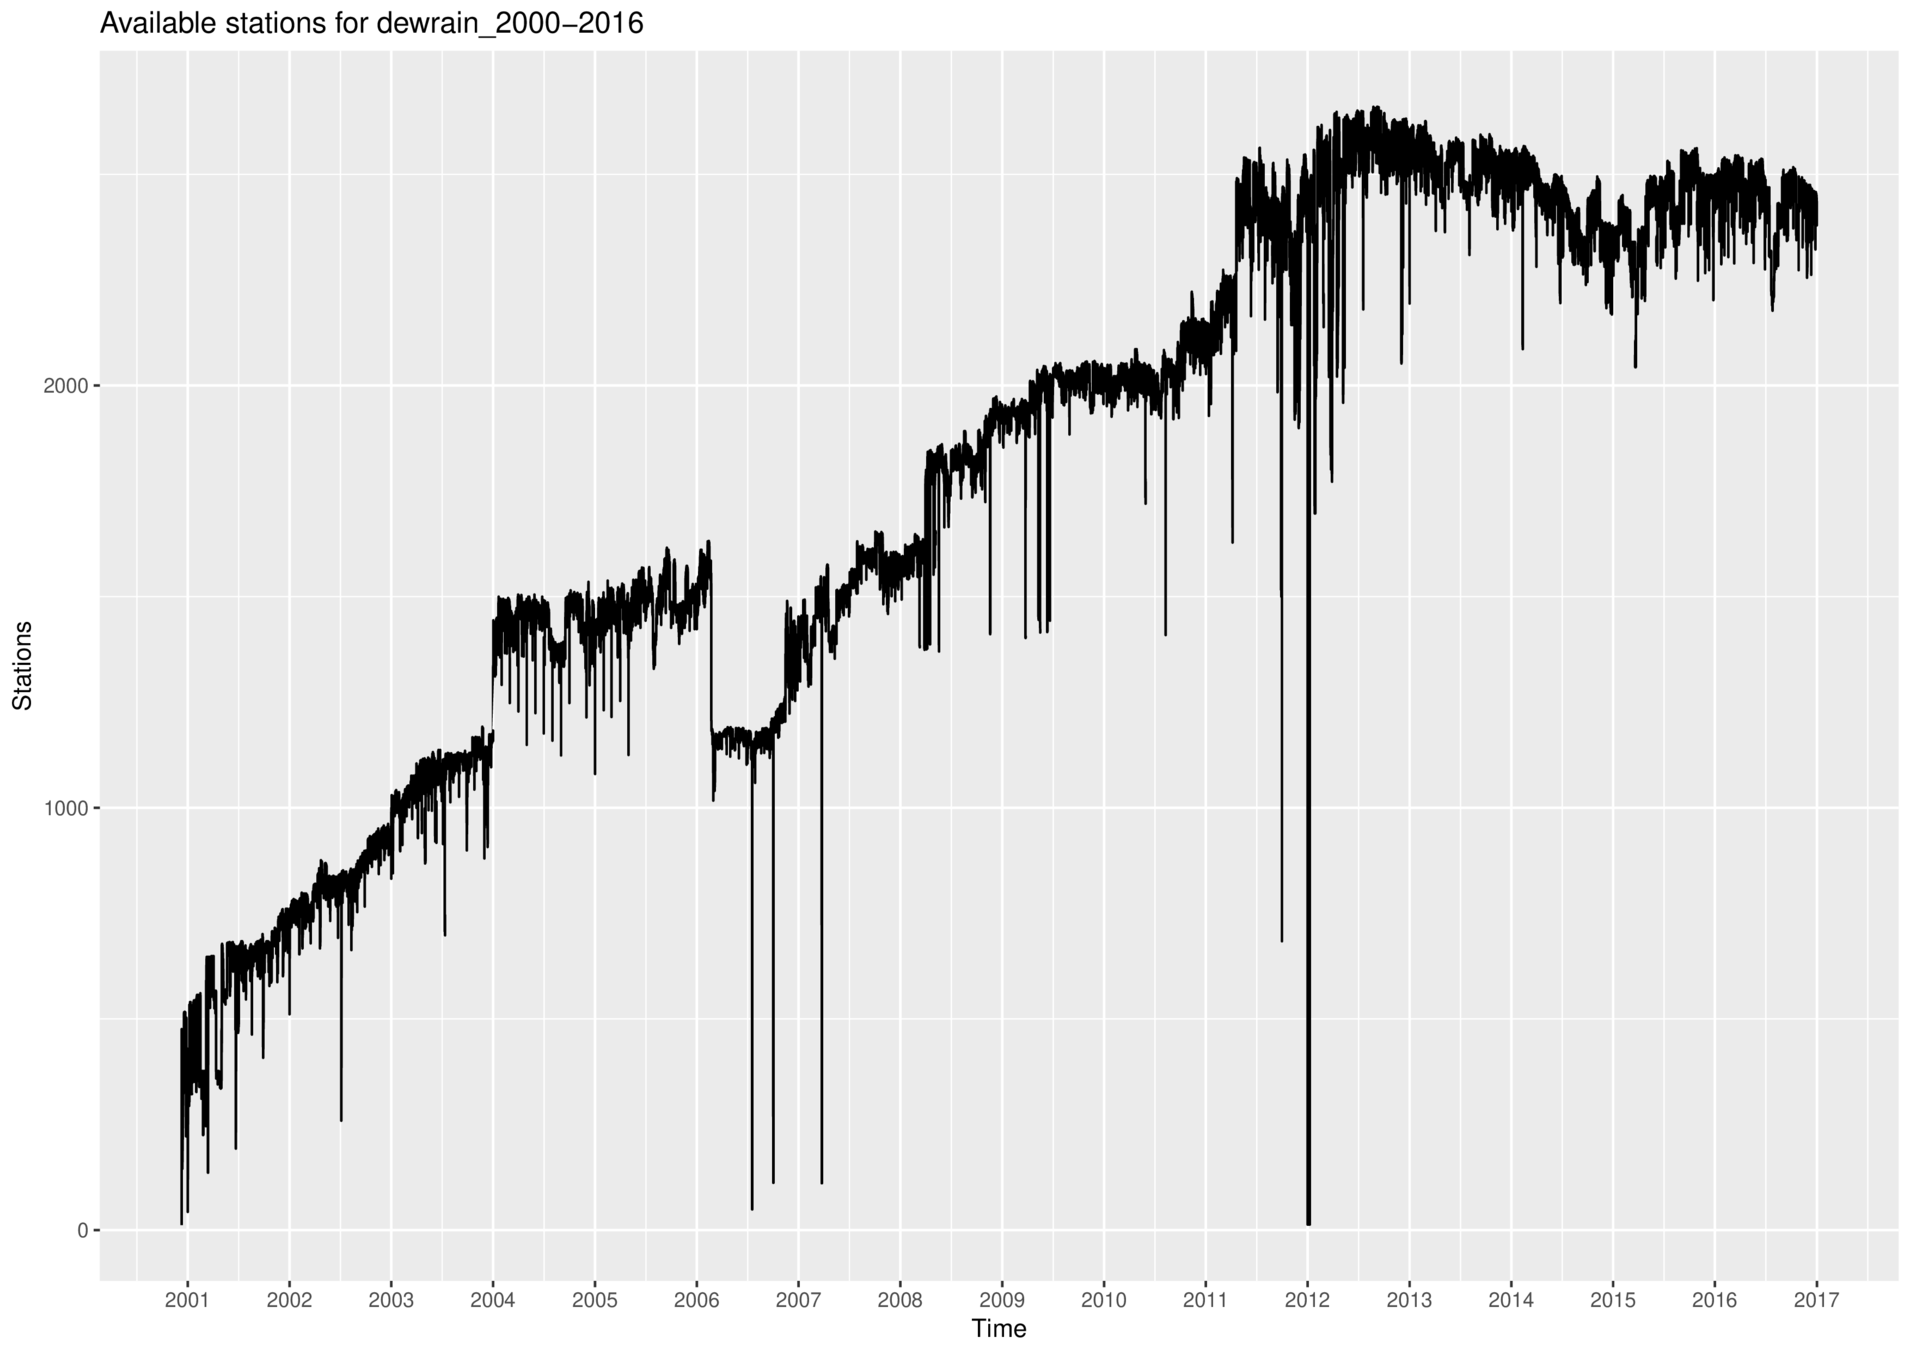
Raw station data provided by Marco Verdecchia (CETEMPS):
- 2001 - 2016
- Hourly
- 3712 stations (~2200 on average)
- No quality check
GRIPHO
(GRidded Italian Precipitation Hourly Observations)
GRIPHO gridding procedure
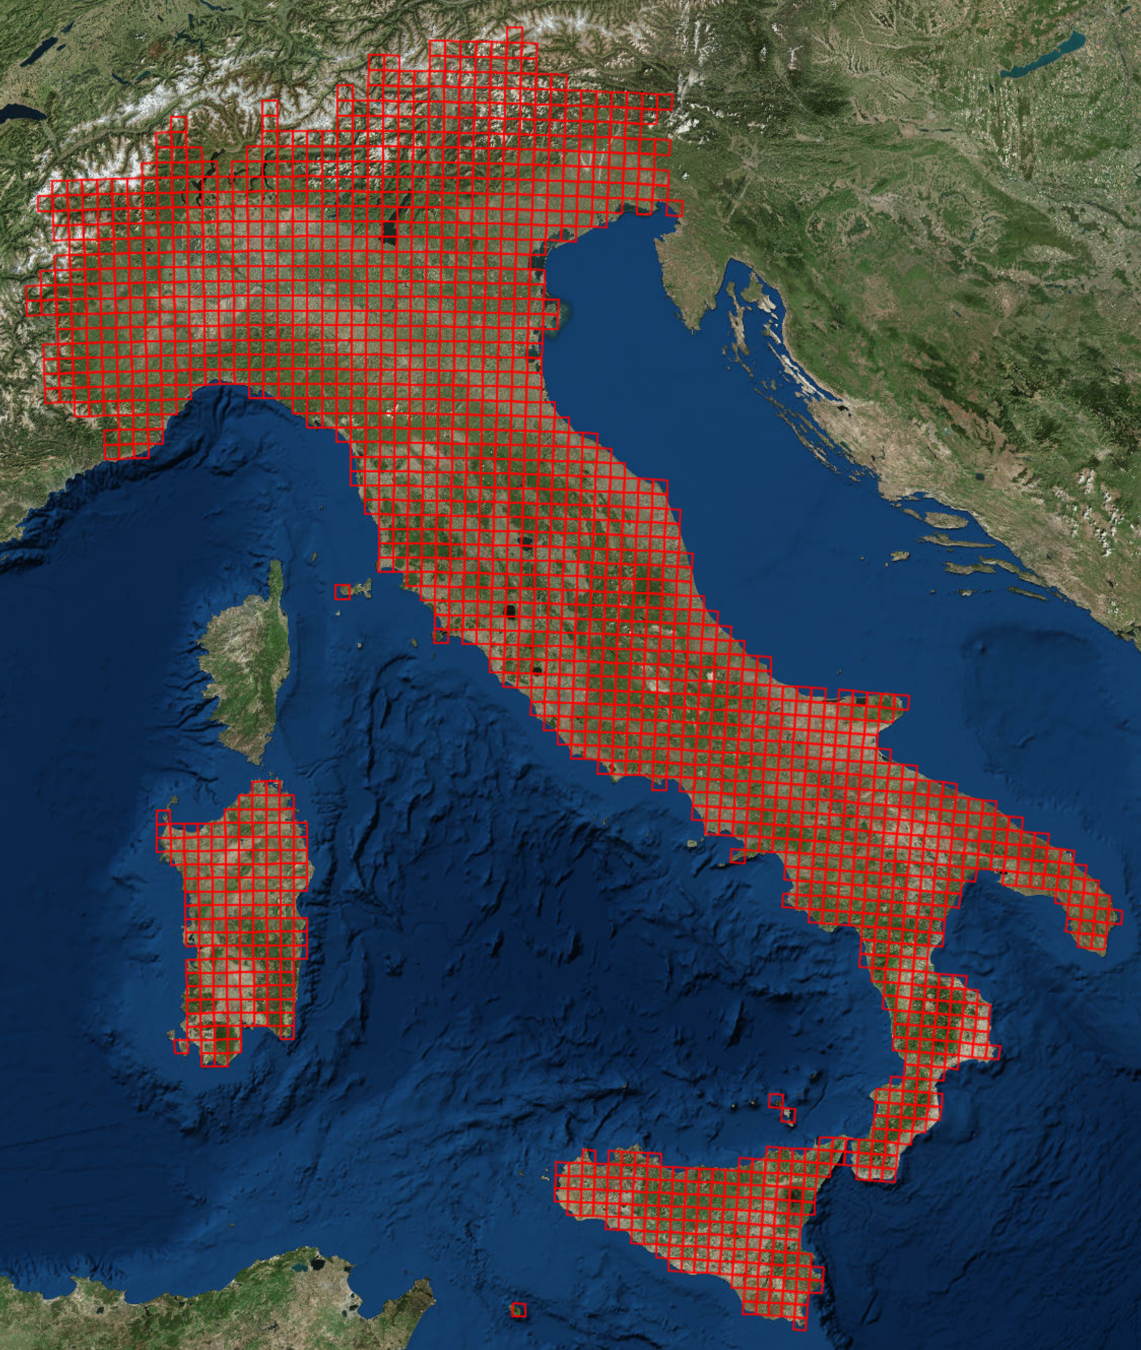
- 12km Lambert Conformal Conic grid
-
Gridding method based on Delaunay polygons using SciPy's interpolate.griddata
- Simple, fast method which minimizes smoothing
- Similar to Norway's KLIMAGRID dataset (Mohr, 2008, 2009)
- NetCDF CF-compliant output format
Mohr M., 2008: New Routines for Gridding of Temperature and Precipitation Observations for seNorge.no
Mohr M., 2009: Comparison of versions 1.1 and 1.0 of gridded temperature and precipitation data for Norway
Velasquez N. et al., 2011: Rainfall distribution based on a Delaunay triangulation method
GRIPHO data issues
- Varying station availability and density across the domain
- Inconsistencies, outliers and data errors
- Only ~15 years or data
Strong points:
- High station density (~1 station/100km²)
- High temporal resolution (1 hour)
- Only high resolution station-based dataset covering all Italy
TIME
NUMBER OF STATIONS
FIRST-STAGE FILTERING
FLAGGING
FLAG CHECKING
MANUAL DATA CLEANING
CLEANED DATASET!
GRIPHO cleaning procedure
The effect of data cleaning
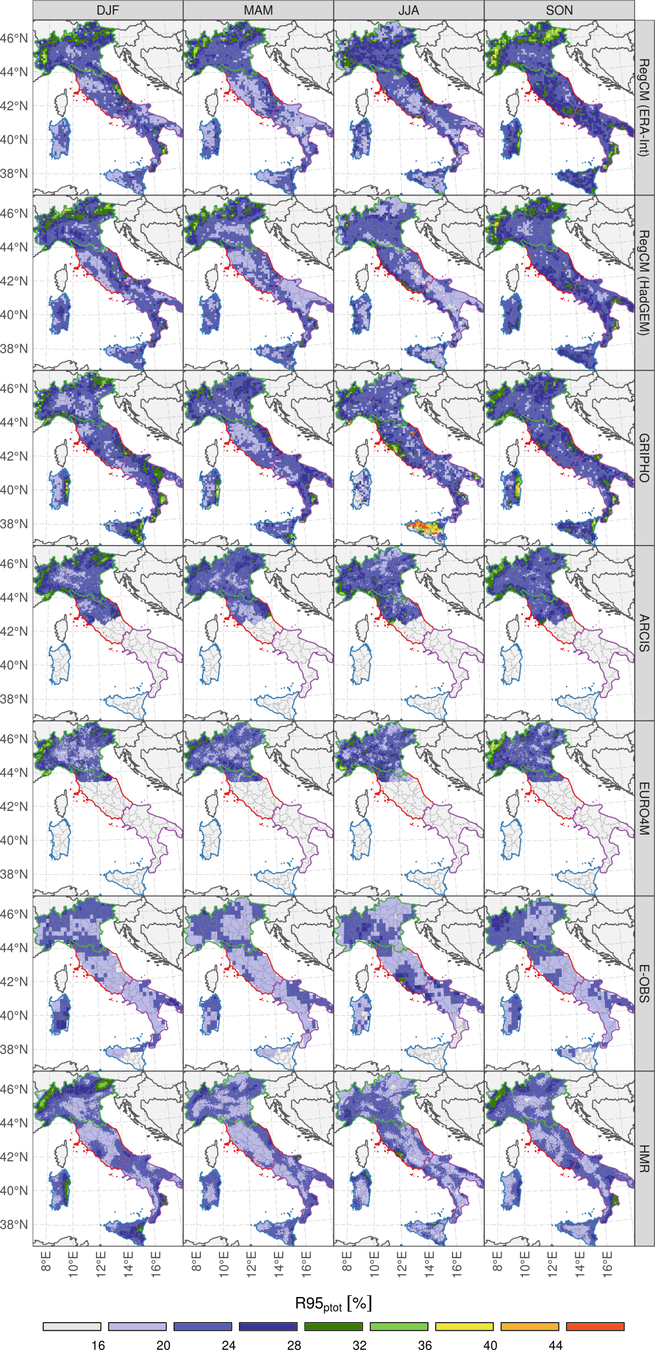
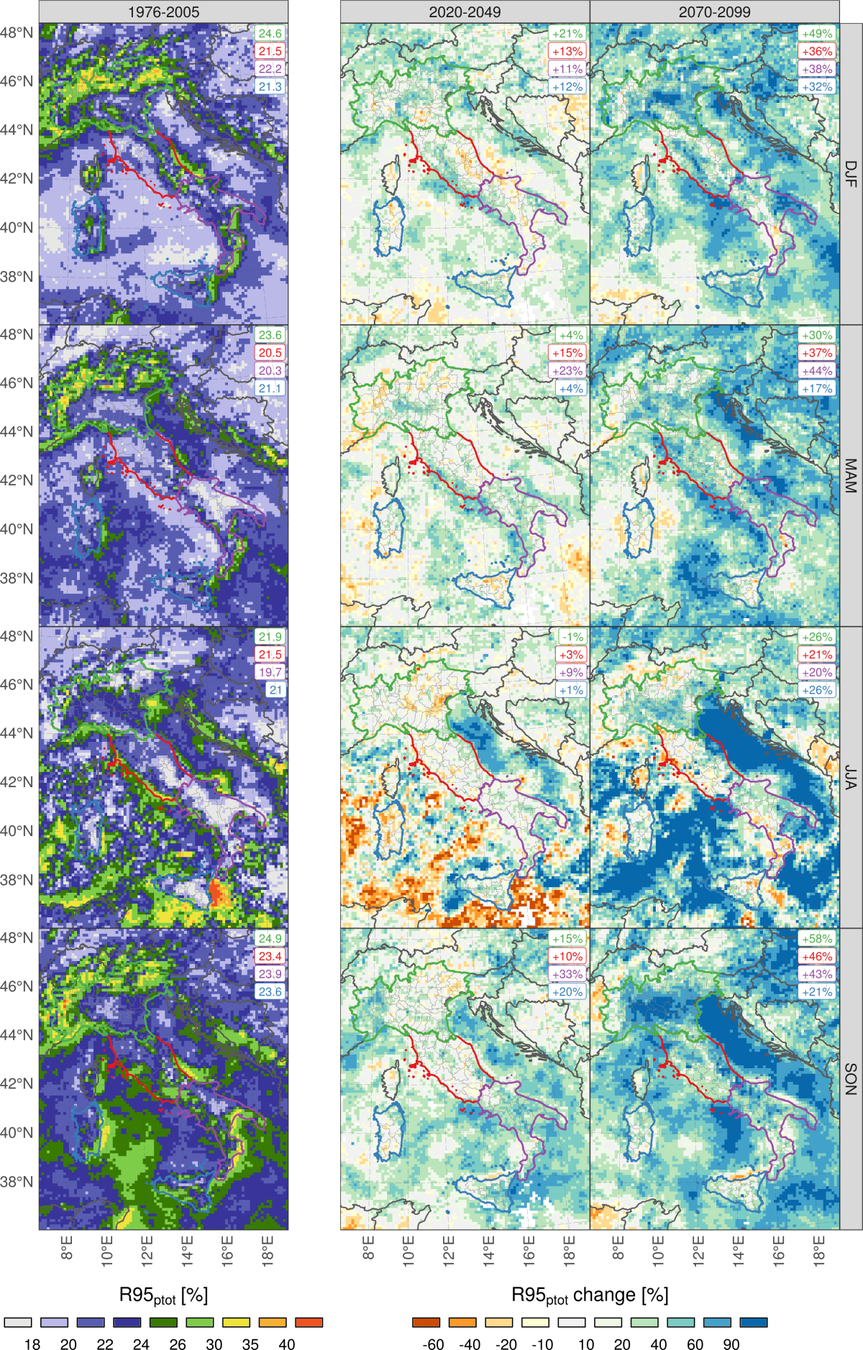
R95ptot = % of PR above 95th percentile
Metrics:
- Mean seasonal
- Extremes (R95ptot, R99ptot)
- Annual cycles
- Probability Density Functions
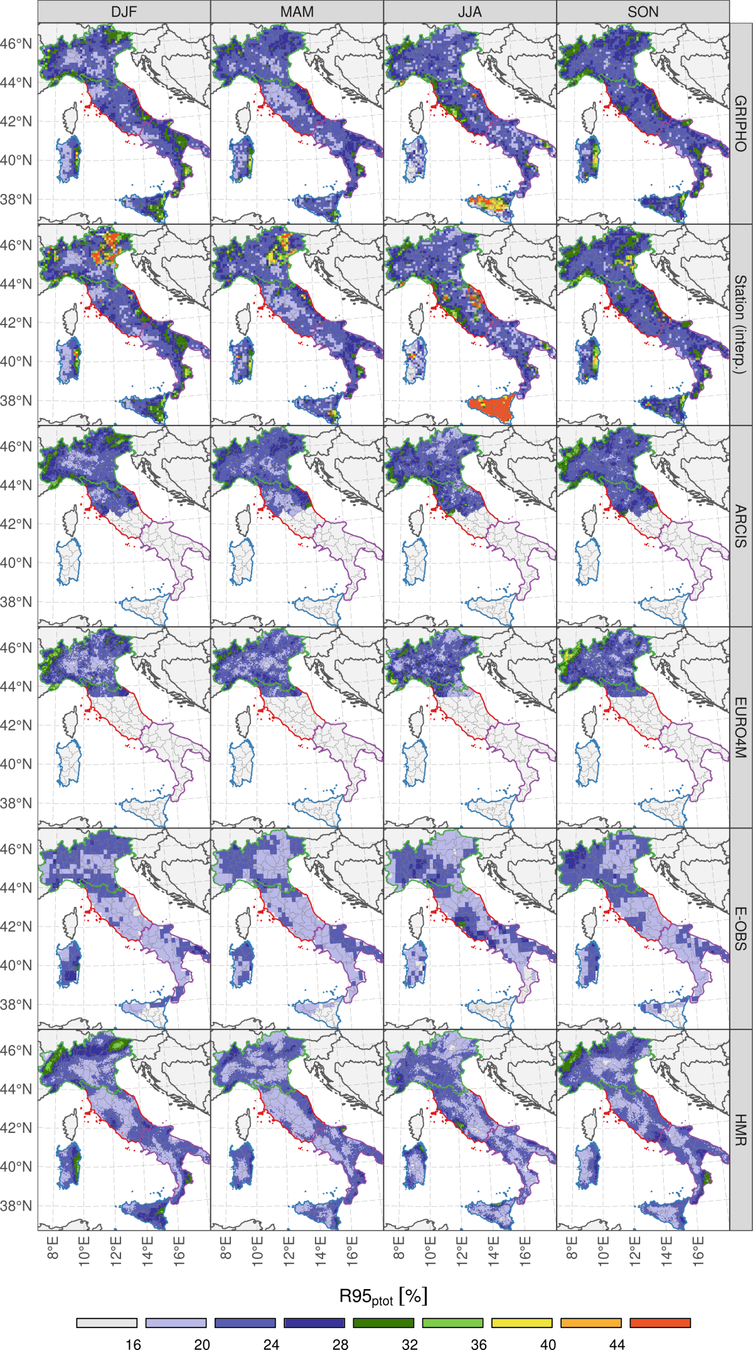
Comparison with:
- E-OBS (stations, 25km - new version is 10km)
- HMR (stations + reanalysis, ~5km)
- ARCIS (stations, ~5km, only Northern Italy)
- EURO4M-APGD (stations, 5km, only Northern Italy)
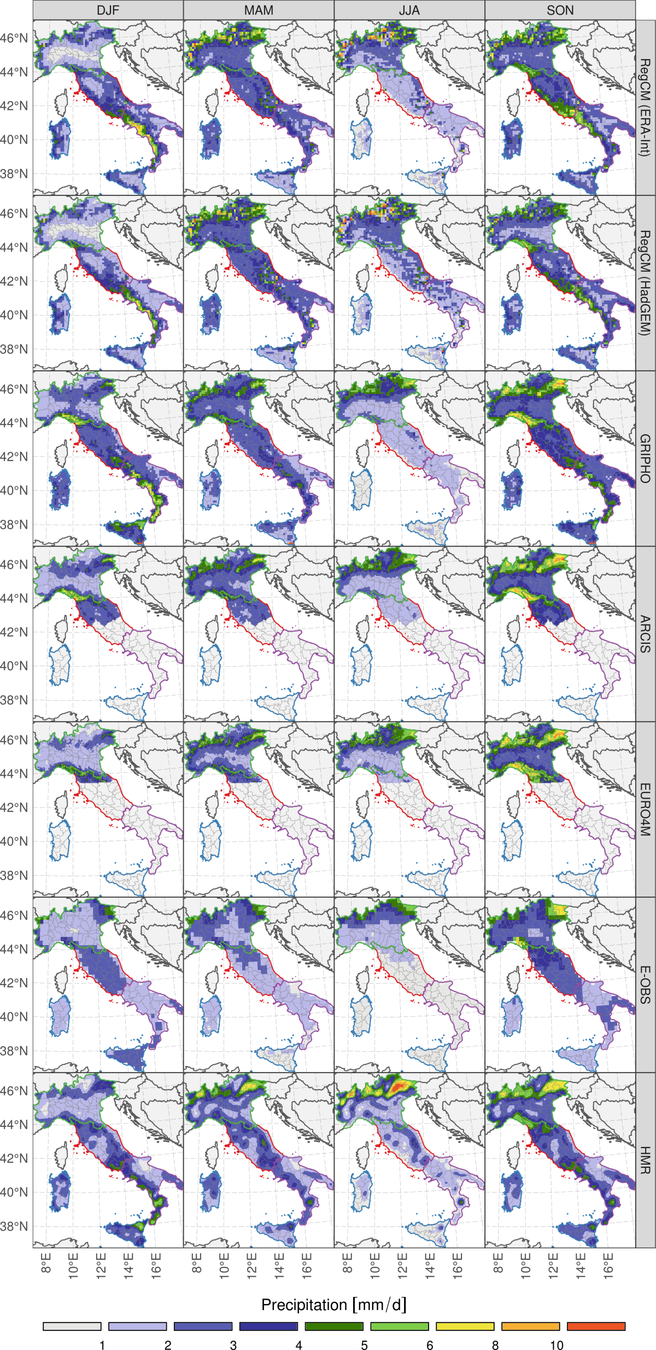
GRIPHO validaiton
{
{
LD
HD
Mean precipitaiton
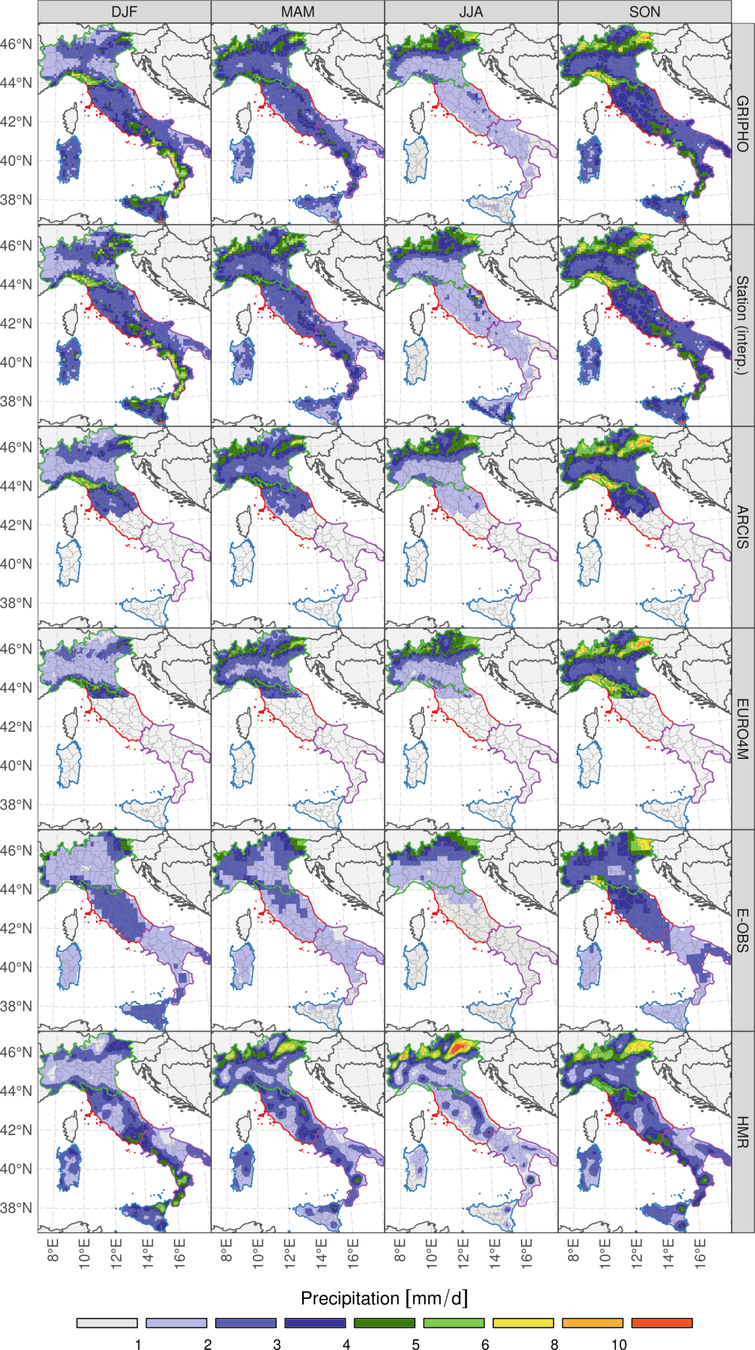
GRIPHO
E-OBS
HMR (rean.)
Extreme precipitation (R95ptot)
GRIPHO
ARCIS
E-OBS
Precipitation distribution (PDFs)

Wrong outliers
Low station density datasets
GRIPHO: conclusions
- Performance in the North similar to other high resolution datasets (EURO4M-APGD, ARCIS)
- Much finer details compared to HMR and E-OBS, especially for extremes
- Only station-based dataset over Italy providing hourly precipitation
- Suitable for comparing with the climate model and for driving the hydrological model!
Fantini A., Coppola E., Verdecchia M. and Giuliani G.:
‘GRIPHO: a gridded high-resolution hourly precipitation dataset over Italy’, in preparation
Extreme precipitation (R95ptot)
GRIPHO
E-OBS
HMR (rean.)
Two RegCM 4.6.1 12km EURO-CORDEX simulations run on ICTP's Argo and CINECA's Marconi clusters:
- ERA-Interim driven 1979-2016 historical simulation
- HadGEM driven 1971-2100 scenario simulation (RCP8.5)
- 135 3-year tuning experiments
- 6000 runtime hours
- 3 million core-hours
- >100TB disk usage
Thanks to James Ciarlo` for running part of the HadGEM driven simulation!
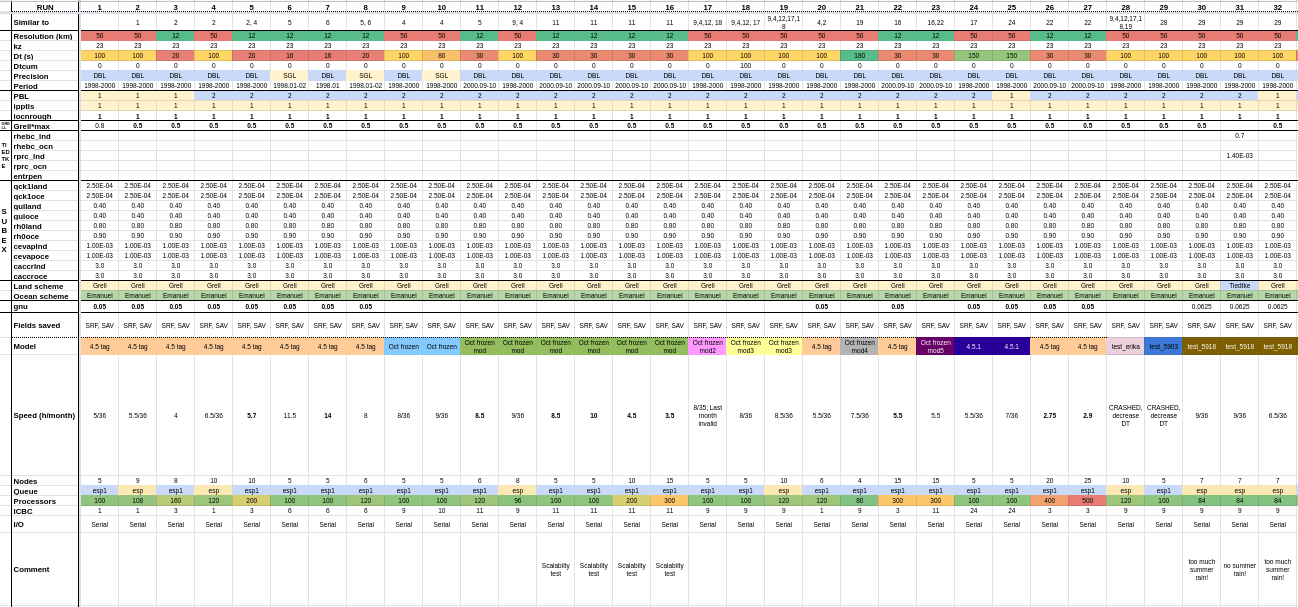
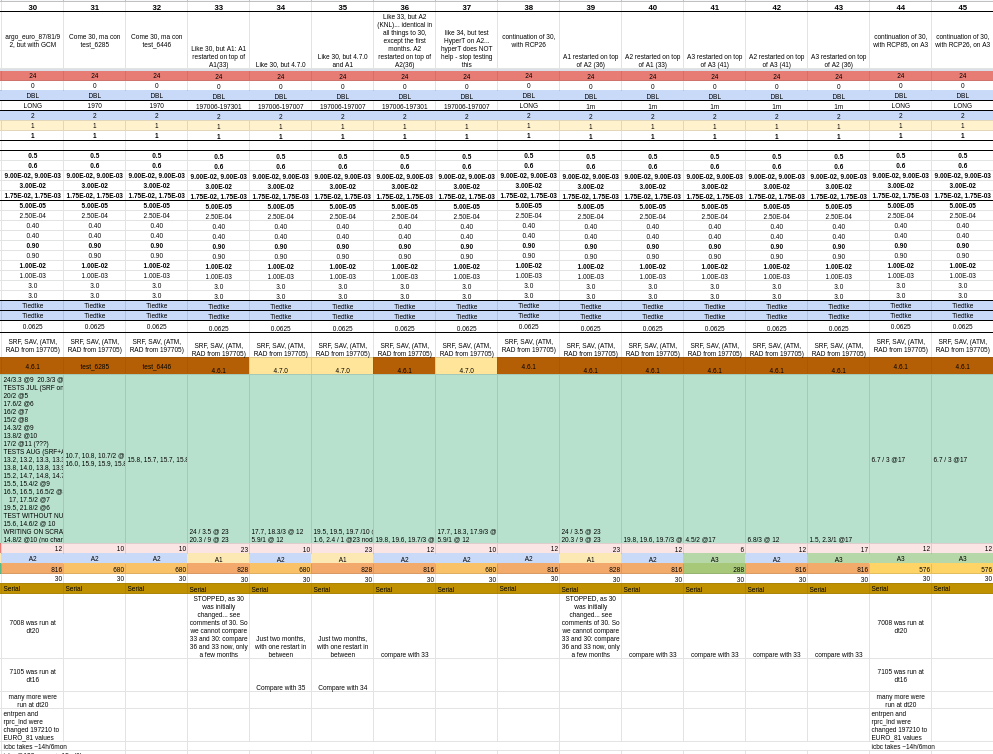
Two regional climate simulations
Does the model perform well?
Validation for precipitation + temperature:
- Mean seasonal
- Extremes (R95ptot, R99ptot)
- Annual cycles
- Probability Density Functions
Validation: mean precipitation
Validation: extreme precipitation
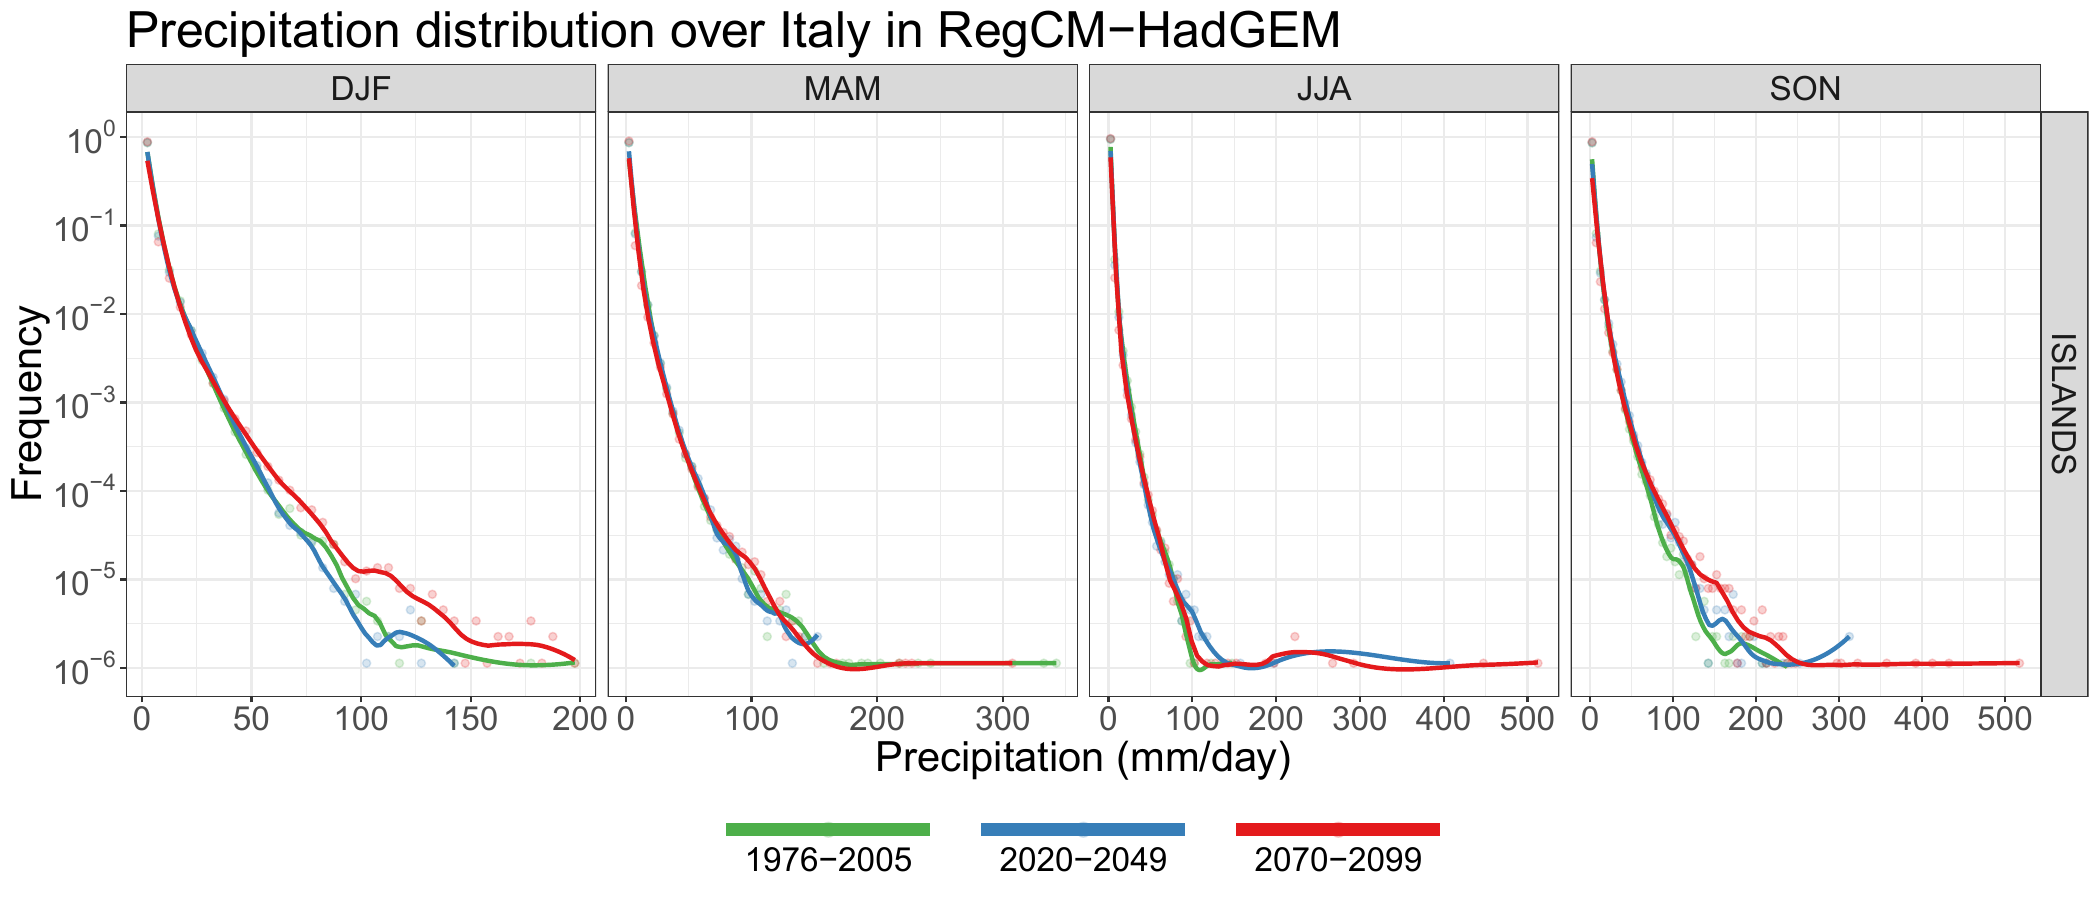
Climate change: mean PR
Climate change: extreme PR
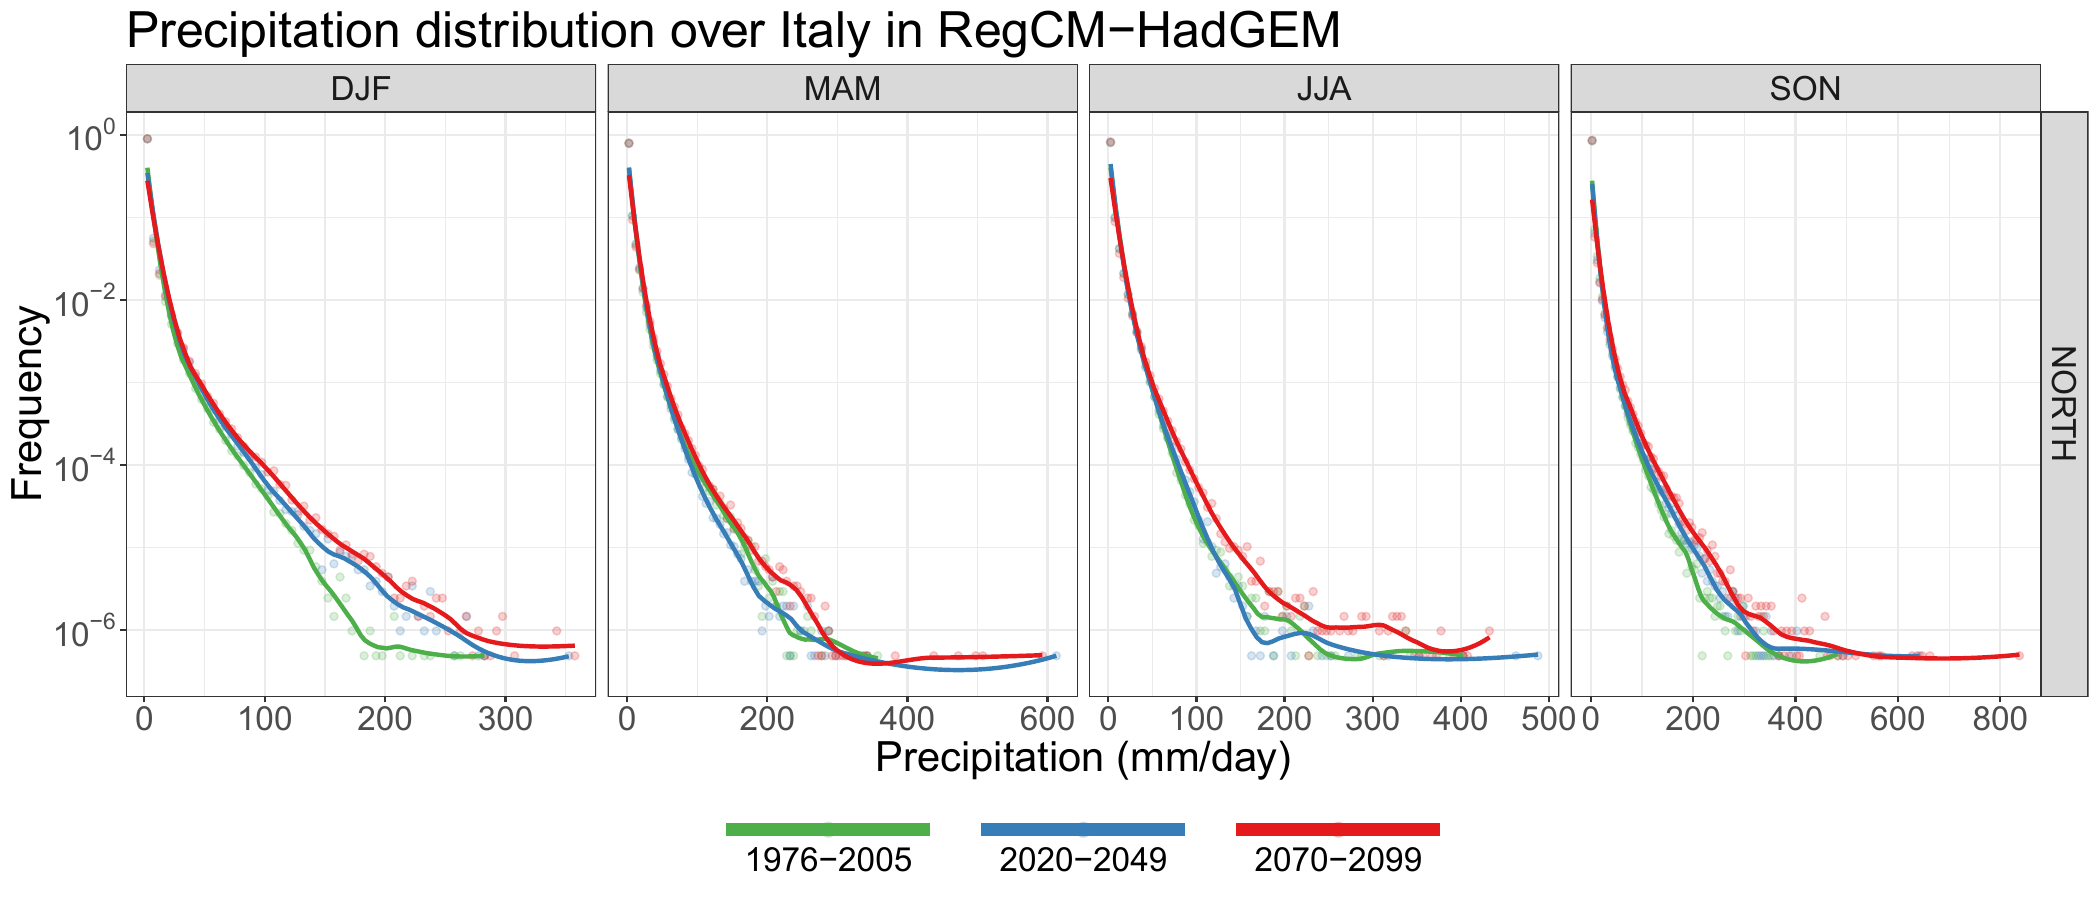
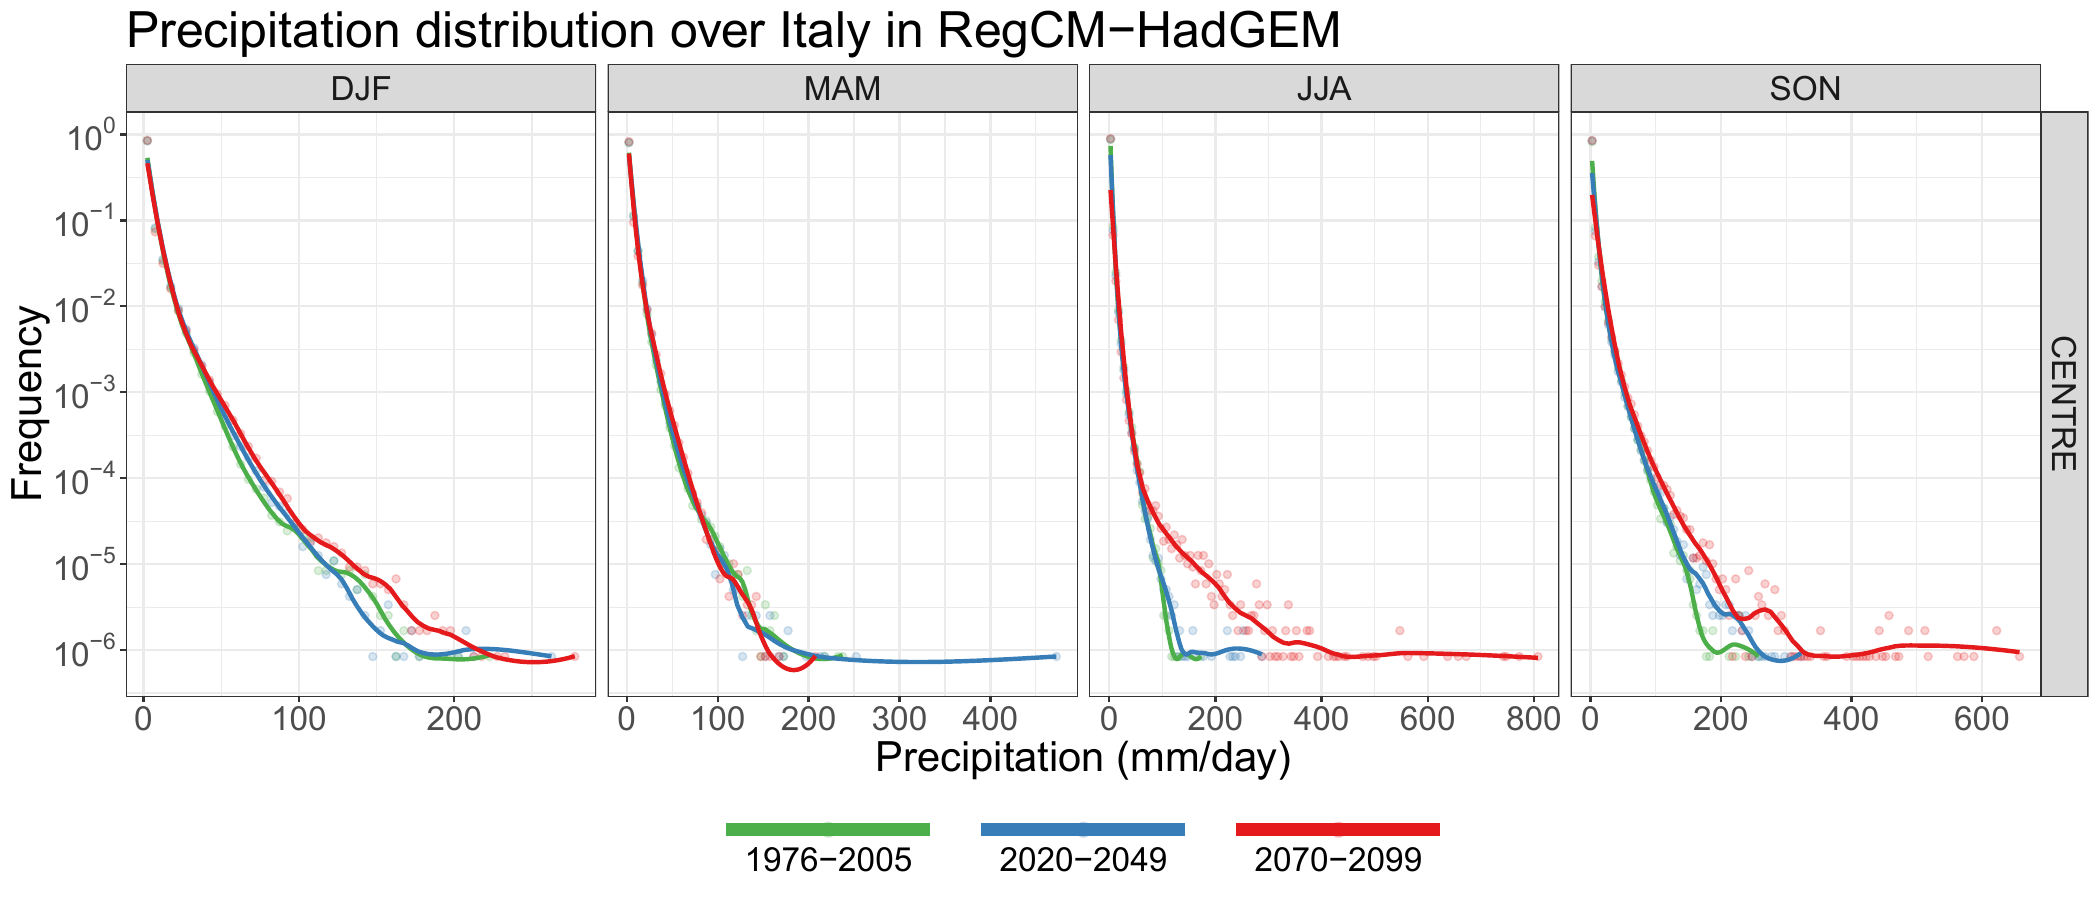
Climate change: PDFs (1)
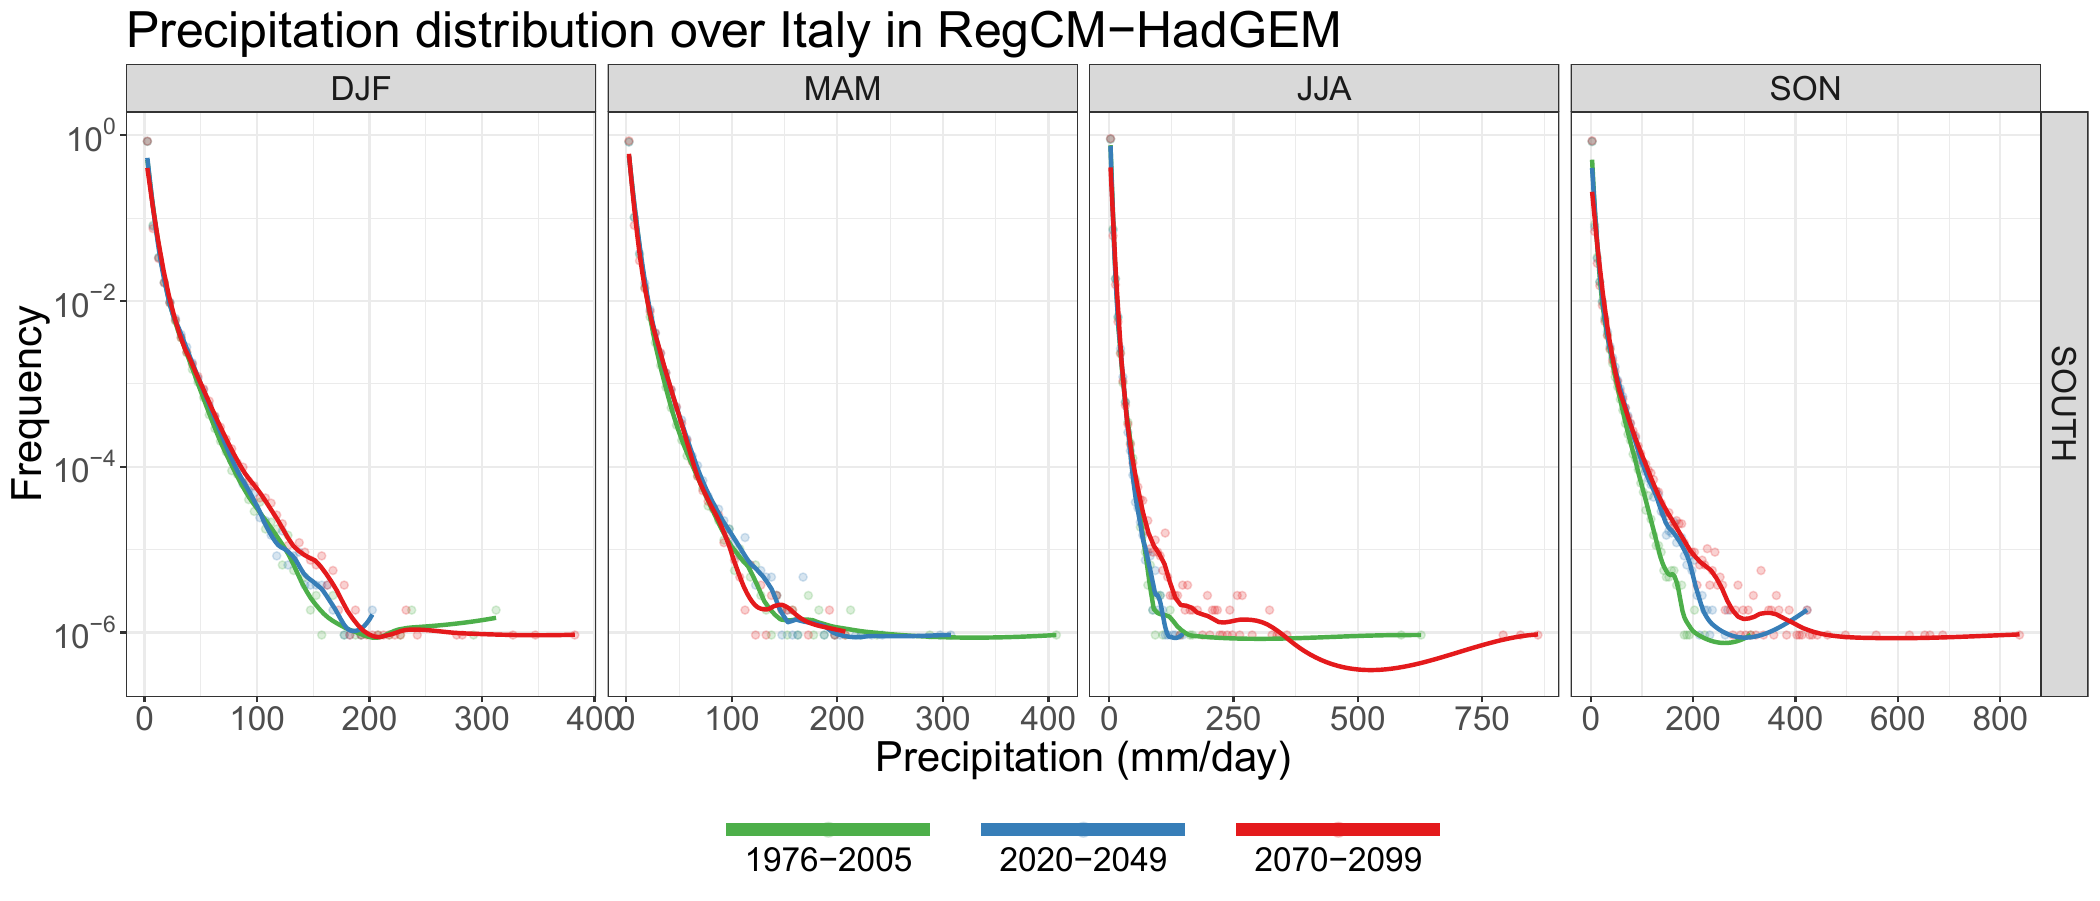
Climate change: PDFs (2)
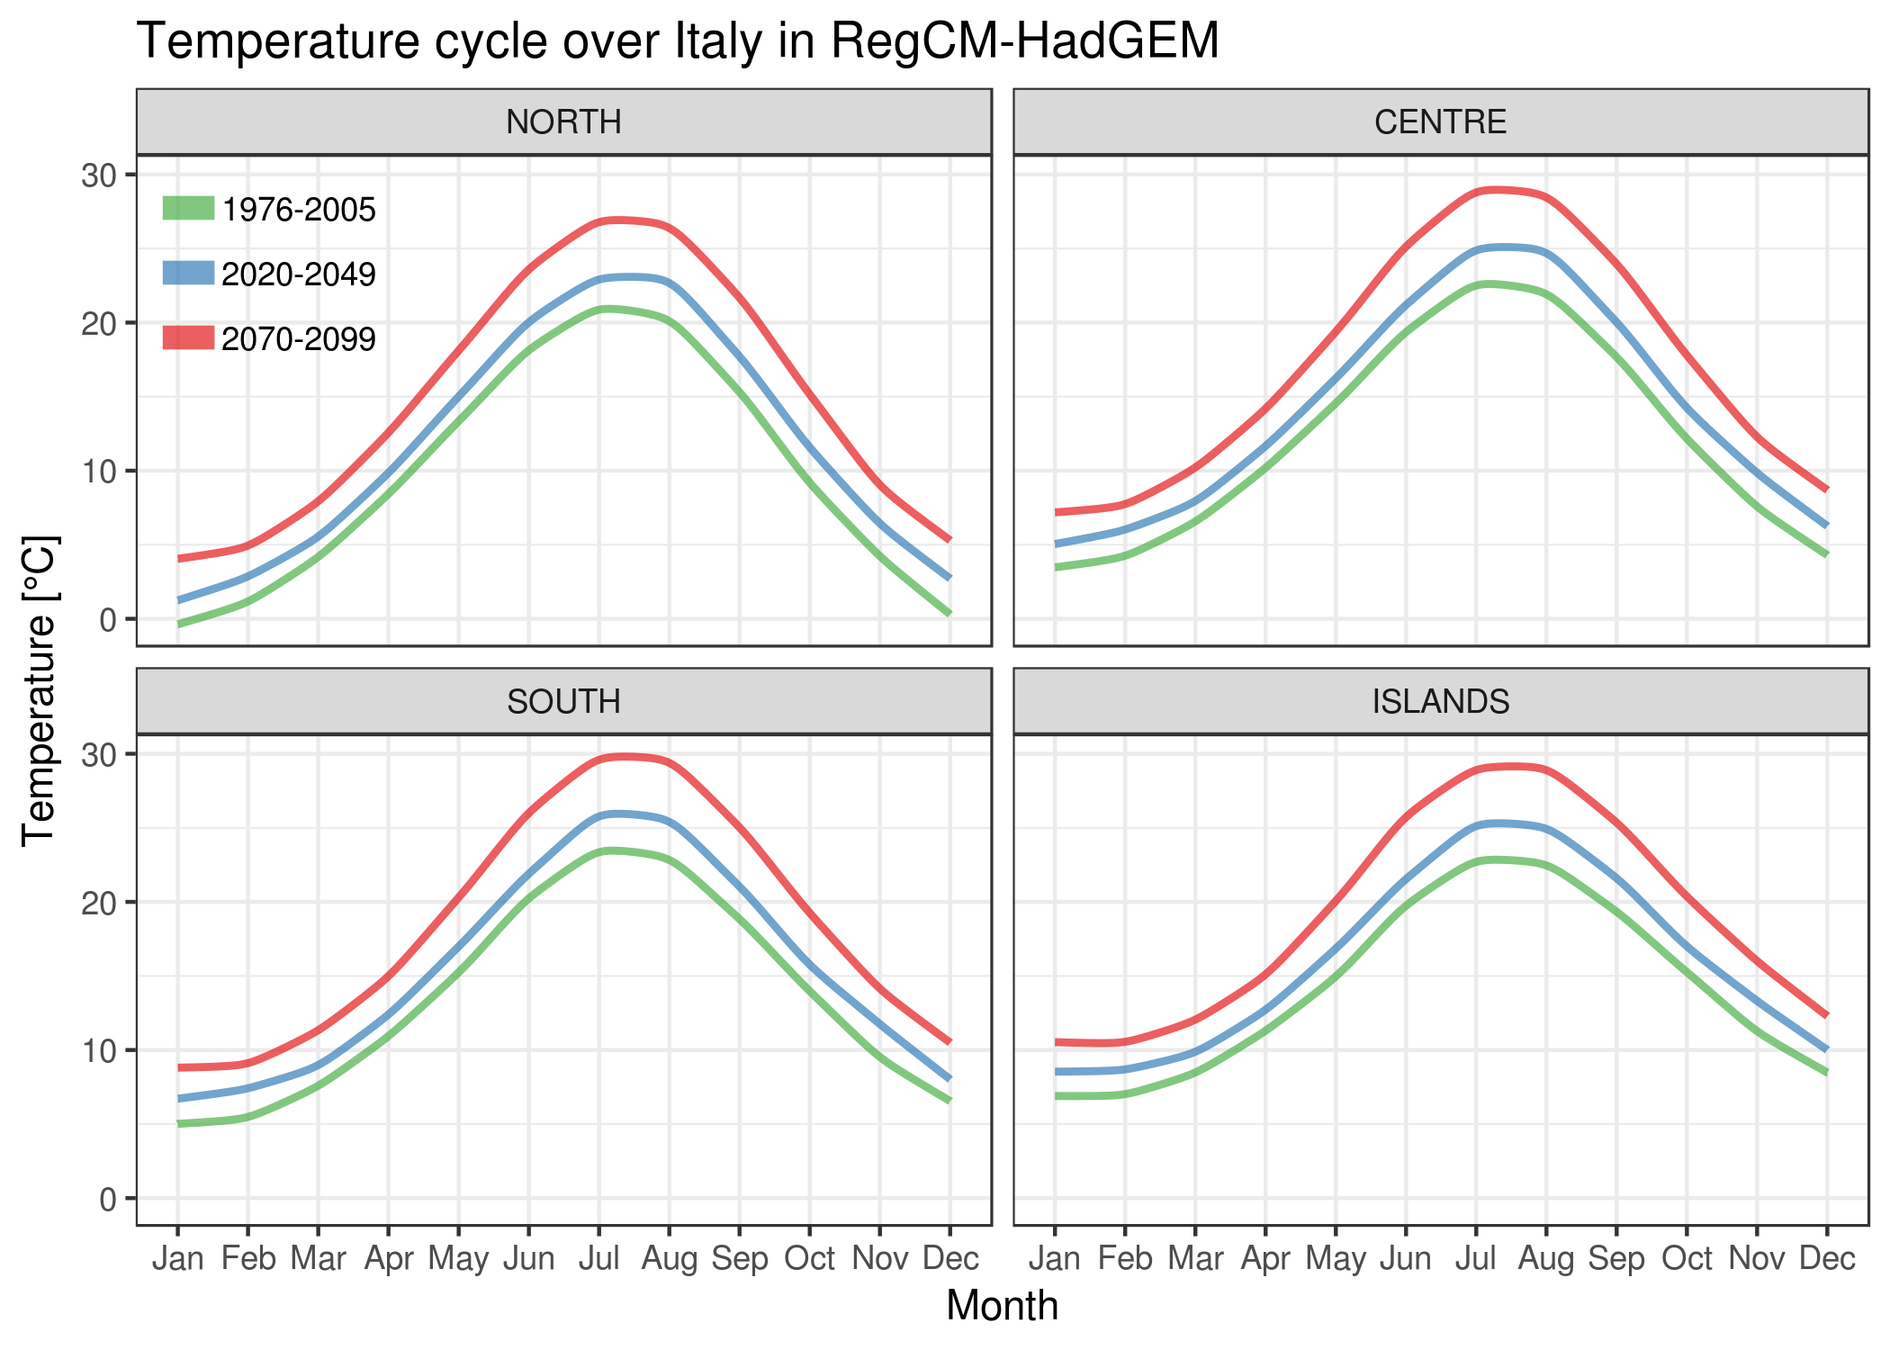
Climate change: temperature
- Model precipitation and temperature generally in line with observations
- Increased projected average precipitation by the end of the century in winter in the north; decrease in the south and isles in summer dipole
- Precipitation extremes projected to strongly increase
- The most extreme events increase more
- In line with the results from other models
Climate simulation: remarks
Cetemps Hydrological Model
CHyM is a distributed (gridded) hydrological model. Peculiarities:
- Can build DEM from various sources, smoothing by cellula automata algorithms
- Can use several kind of inputs, such as station observations, gridded model data, etc.
- Designed to work on any domain
- Used daily at CETEMPS for operational forecasts
- Hourly NetCDF output
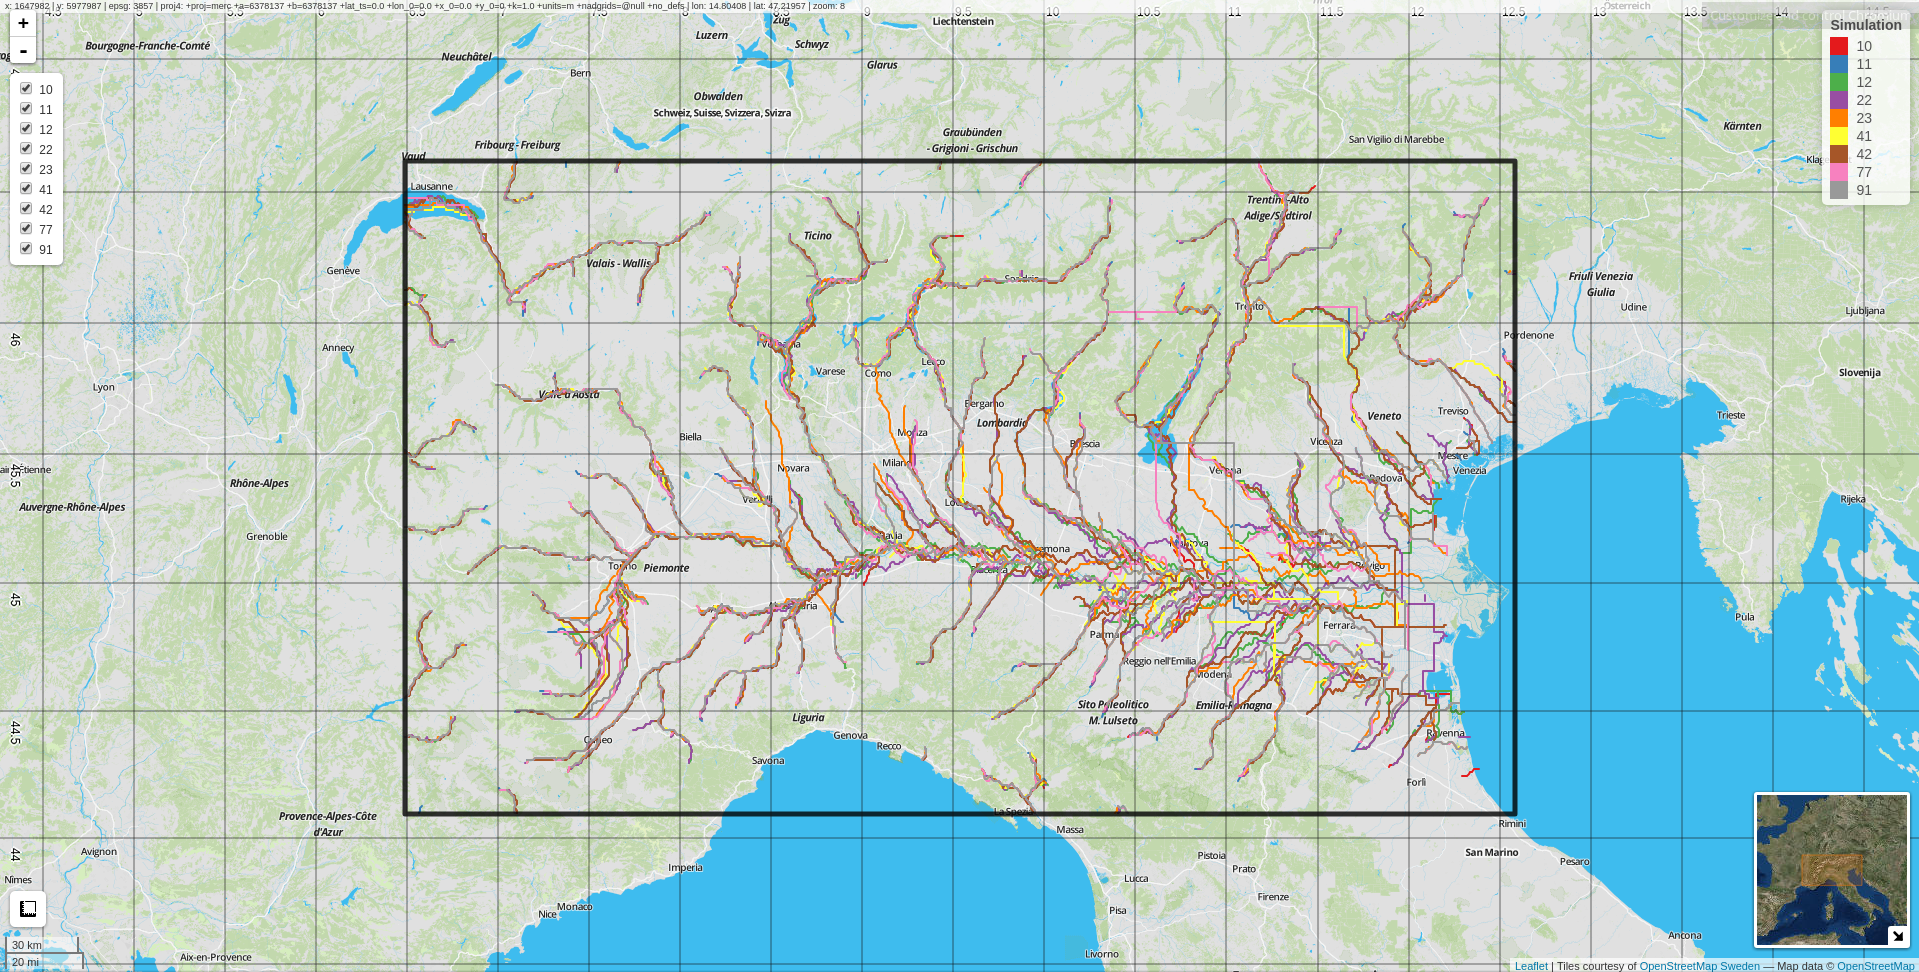
CHyM simulations
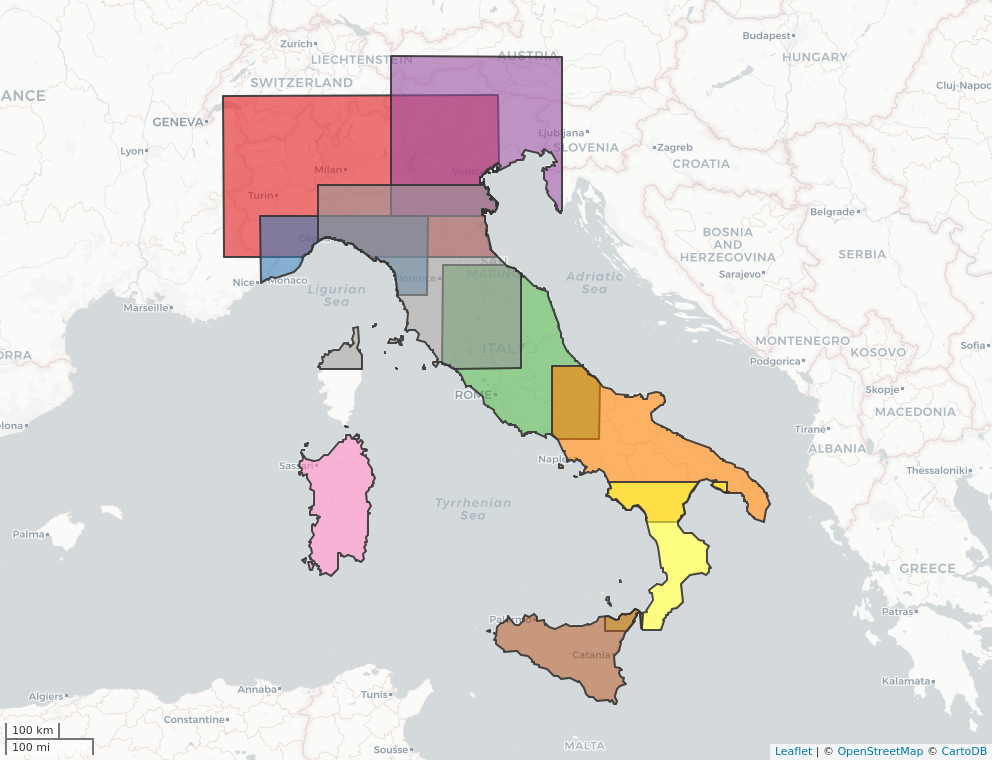
- 9 simulated domains
- Tested several Digital Elevation Models, chose HydroSHEDS 90m
- Specific tuning for each region
- 300-900m resolution
- Argo and Marconi clusters
- 3000 runtime hours
- 100k core-hours
- ~35TB
Three PR drivers:
- GRIPHO (MM5) 2001-2016
- RegCM-ERA 1980-2016
- RegCM-HAD 1972-2100
96 river network reconstruction tests for each region
(manual and automatic, with distance measures)
CHyM river network
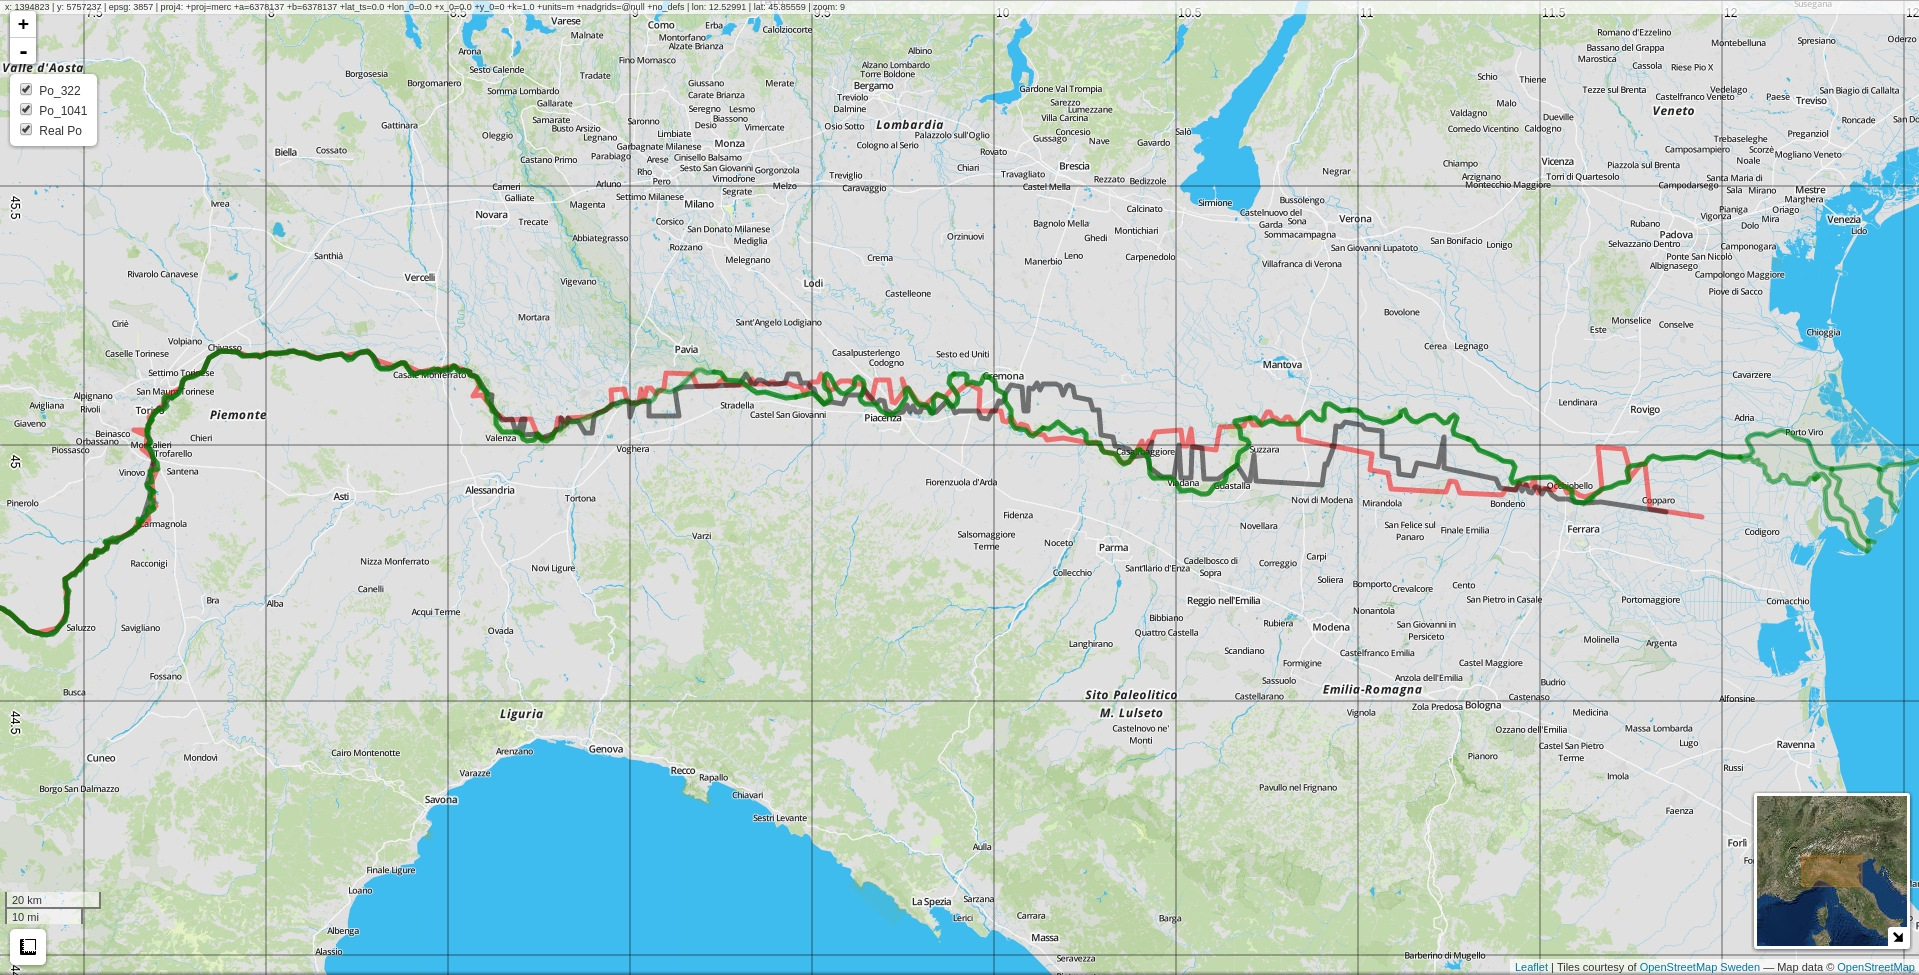
CHyM river netowrk
Po river example
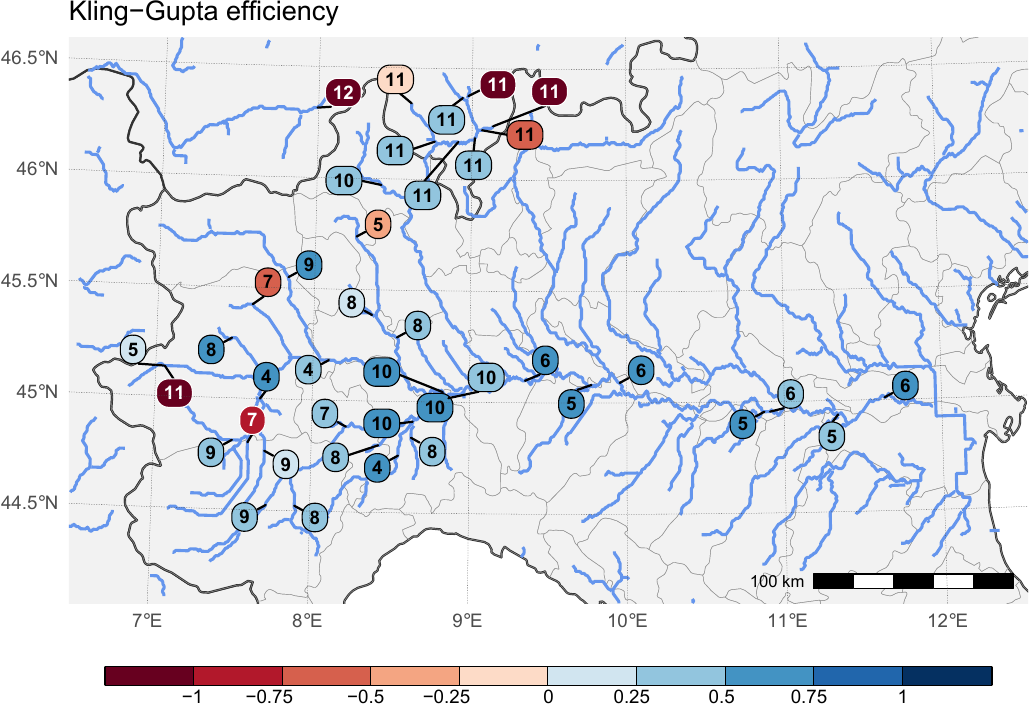
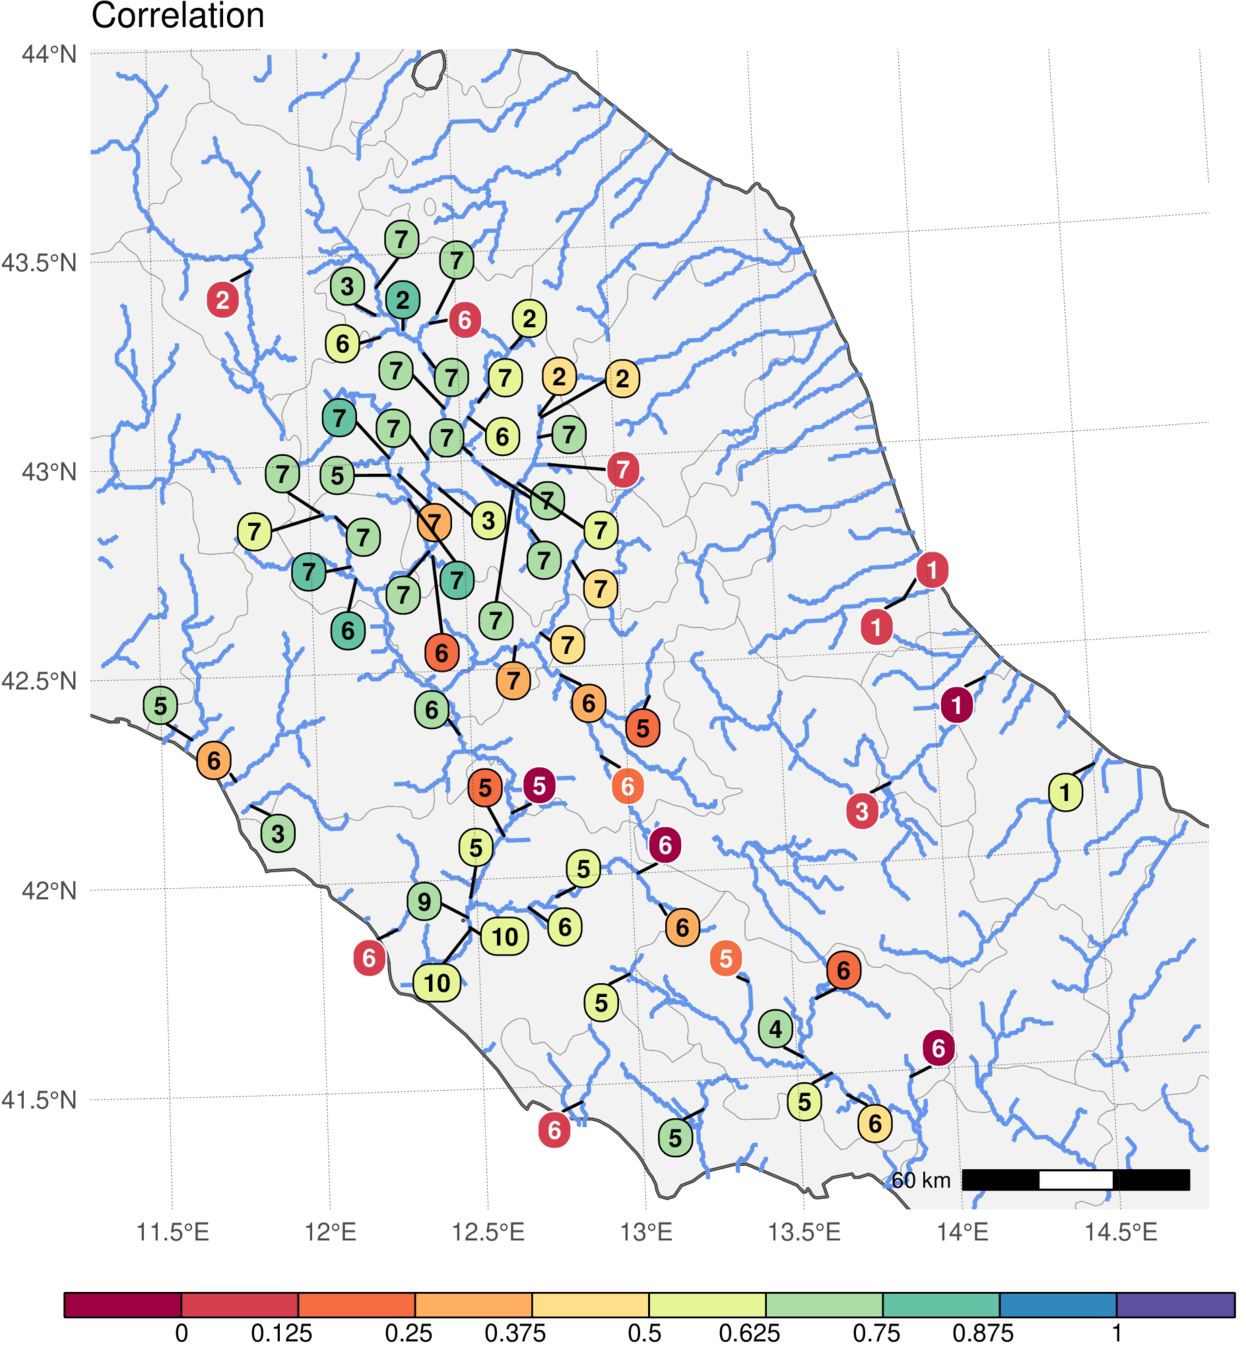
Does the model perform well?
Validation only possible against a few discharge stations:
- Average discharge
- Yearly maximum discharge
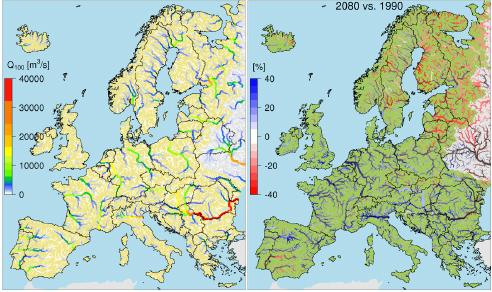
- Projected Q100 discharge
- Standard hydrological model metrics (NSE, KGE, correlation, index of agreement, ...)... against only a few stations, unfortunately
CHyM simulations
CHyM validation example
CHyM (GRIPHO)
CHyM validation example
CHyM (GRIPHO)
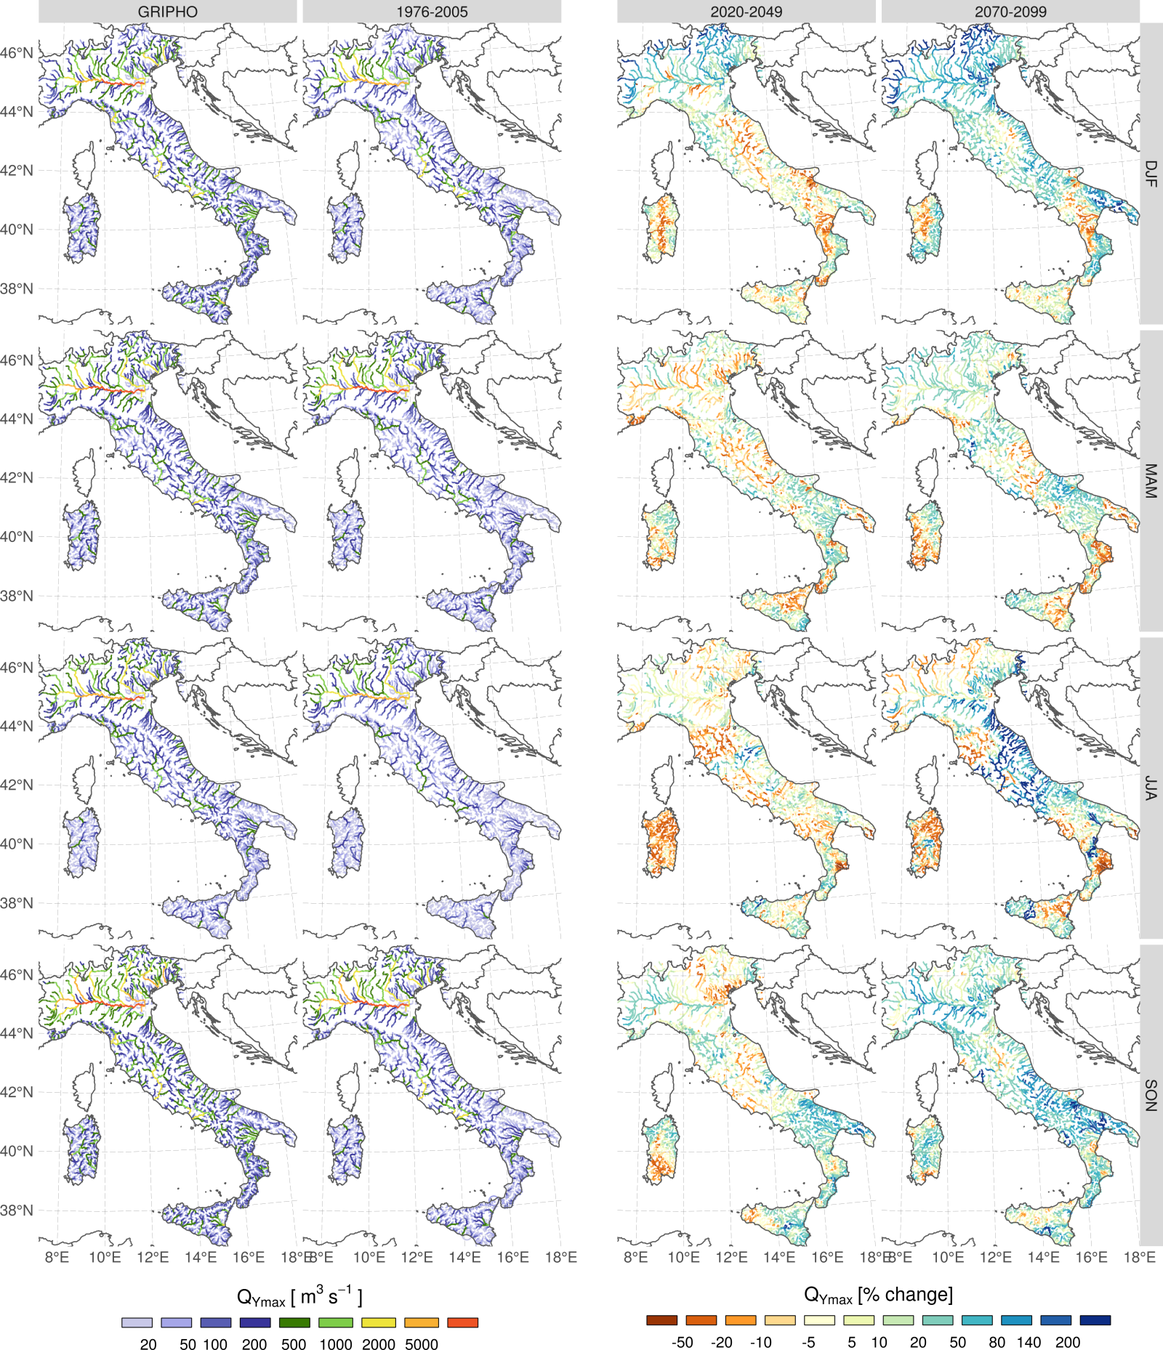
Mean change
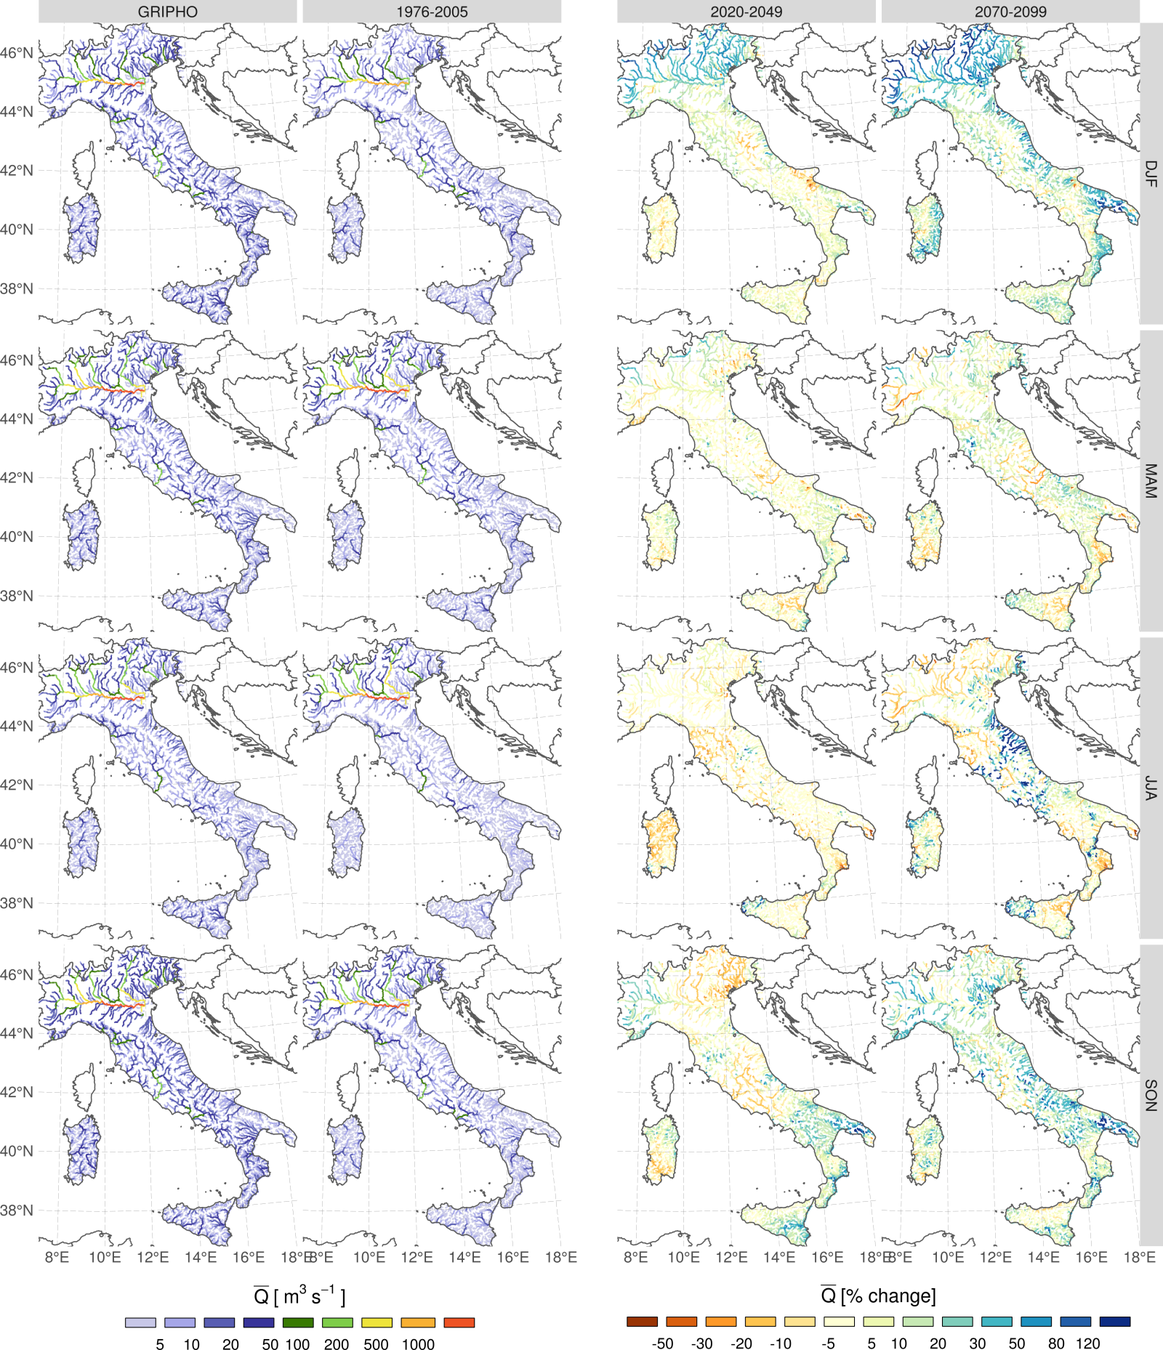
MEAN DISCHARGE
MEAN DISCHARGE CHANGE
MEAN PRECIP CHANGE
Extreme change
MEAN ANNUAL MAXIMUM DISCHARGE
Qymax DISCHARGE CHANGE
R95ptot PRECIP CHANGE
- Model discharges in line with observations (for the few available stations)
- Average discharge projected to slightly increase in the north; mixed changes elsewhere
- Extreme discharges projected to strongly increase by the end of the century (often >1.5x)
- Extreme discharge changes do not match extreme precipitation changes hydrological model adds useful information!
- Paper coming soon!