


Alex Sanchez
Front End Developer for the Tampa Bay Times
Let's talk about the internet.
//Poynter Non-Profit News Exchange
@alxnsnchz
@alxnsnchz
@alxnsnchz
@alxnsnchz
How we make decisions about UI/UX
Determining what to make based on assets
Benefits of multiple iterations
Digital strategy decisions
@alxnsnchz
@alxnsnchz
Pinellas County houses the five worst elementary schools in Florida.
All of them are majority black.
Failure rates for black children are strikingly high compared to other Florida counties.
All a result of the school board abandoning integration.
@alxnsnchz
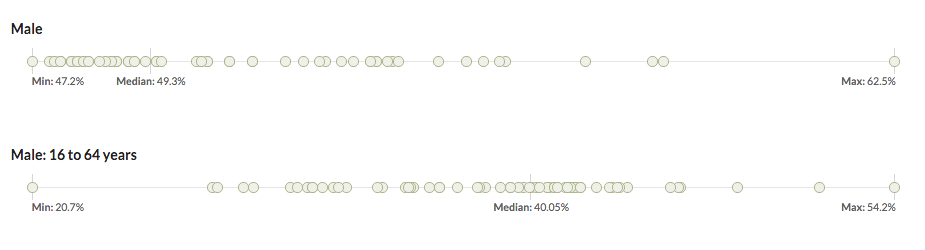
Test scores
Enrollment
Disciplinary records
Attendance records
Racial demographics
@alxnsnchz
@alxnsnchz
Walk people step-by-step through the information.
Help them understand all the data
MOST IMPORTANT: See the causal relationship between resegregation and these failing schools
@alxnsnchz
@alxnsnchz
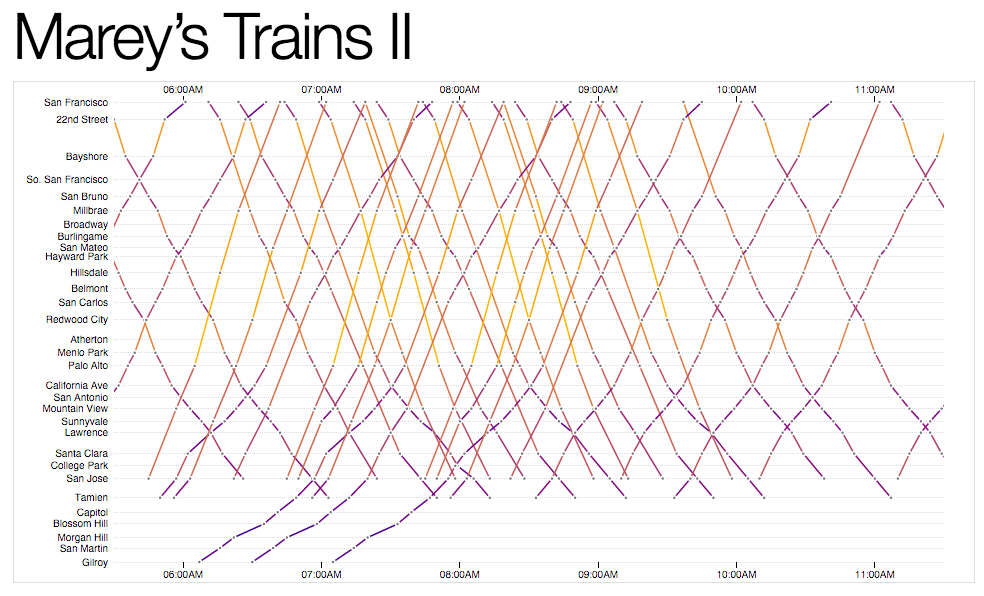
Use animations to draw attention to different patterns within the same data
@alxnsnchz
@alxnsnchz
(sometimes it doesn't work out the first time)
@alxnsnchz
@alxnsnchz
@alxnsnchz
@alxnsnchz
@alxnsnchz
This is the last slide
@alxnsnchz
Hashtags (#FailureFactories)
Ability to share from every slide
Ability to sign up for email updates at the end of the presentation.
@alxnsnchz
Chart: 250K views
Day 1: 120K views
1000+ email addresses
#FailureFactories trending in Tampa Bay area
US Dept. of Education Secretary Arne Duncan: "We as adults have failed them."
@alxnsnchz
@alxnsnchz
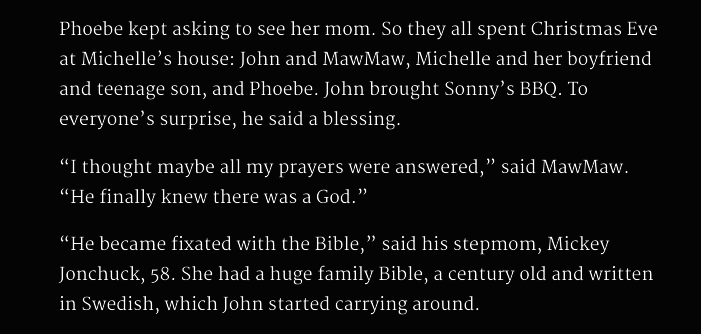
After lifelong history of abuse, child neglect and mental illness, a man drops his 5-year-old daughter off the side of a bridge.
@alxnsnchz
@alxnsnchz
Was going to be long (10K+ words per chapter)
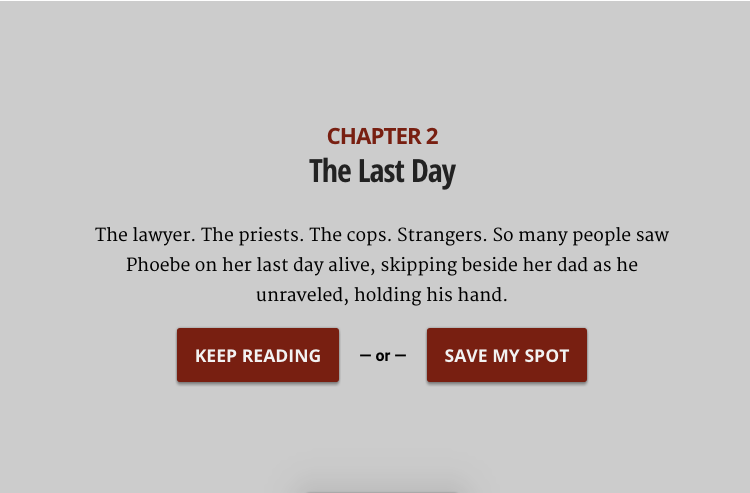
Told in 3 chapters
Discussion about rolling out over three days or all at once
Very dark
@alxnsnchz
@alxnsnchz
Think about your own behavior as a consumer of the internet and online journalism
@alxnsnchz
@alxnsnchz
@alxnsnchz
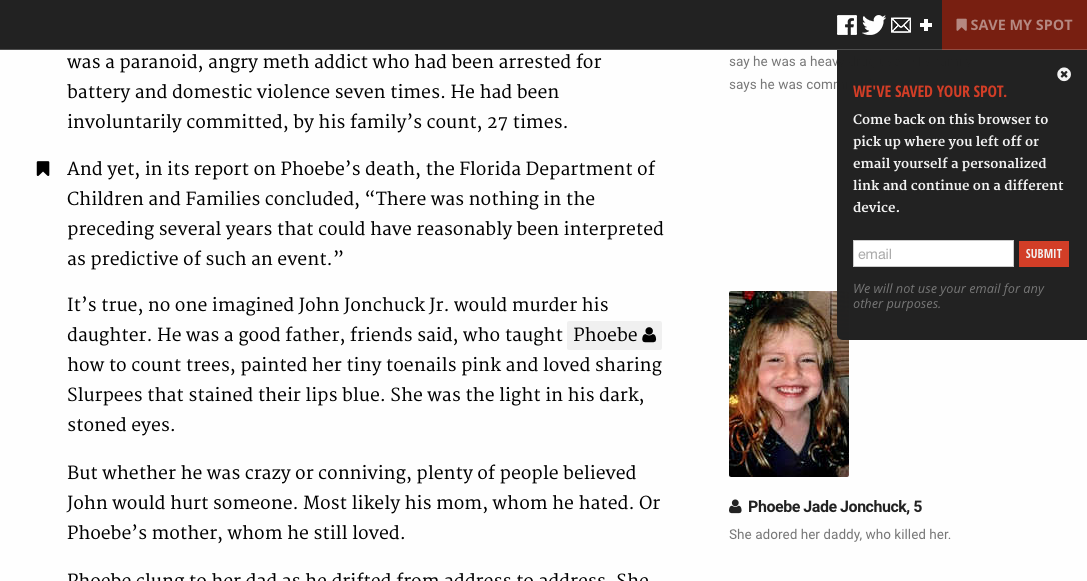
Use cookies to automatically keep track of reader's paragraph as soon as they exit the page.
@alxnsnchz
Use cookies to automatically keep track of reader's paragraph as soon as they exit the page.
@alxnsnchz
@alxnsnchz
@alxnsnchz
@alxnsnchz
@alxnsnchz
Trailer pages
Inline Twitter "sharelines"
Reddit AMA with Lane DeGregory
Email to Tampa Bay Times subscribers
@alxnsnchz
113K views
900-1200 concurrent viewers during first 2 weeks
Tweets specifically mentioning "Save My Spot" feature
Released on 1-year anniversary; dominated the market.
Responses from Fla. DCF
@alxnsnchz
@alxnsnchz
By Alex Sanchez
Tracking the process and development of data visualizations and digital storytelling from inception through iteration to publication. How to know when you have something that can be a data visualization or an infographic or an immersive story experience and then how to continue with that idea through all the stages of its creation until it's ready to be published.


