Change Is*
Meeting 1: Product Introduction & Brainstorm
*working title
Intros
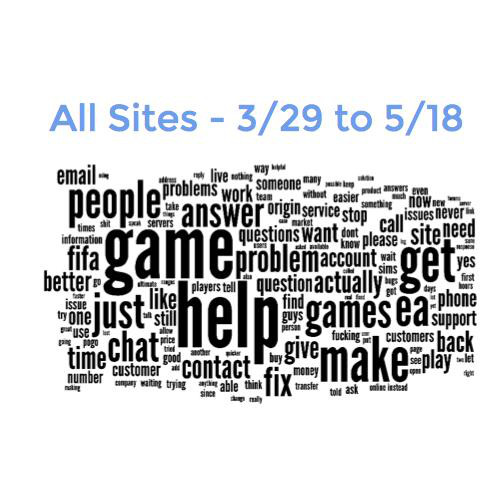
Visually tell useful data stories
Inform / empower audience
Have fun / learn and whatnot
Here's what I'd like to do:
1. Use public data
2. Create an infogallery
a. Physical - EAST?
b. Digital - TBD
3. Do it before September
Here's what that might look like:
Communication
- Define Project / Roles - Tonight
- Brainstorming Content Categories - Feb 4 - Feb 28
- Data Gathering / Exploration - Feb 28 - Apr 30
- Mockups / Sharing - April 30
- Secure Venue - April 30
- Development - May 31 – Jul 31
- Testing / Tweaking - Jul 31
- Submission Deadline for EAST - Late August
- Production / Event Planning - After That
- Website Development - After That
Logistics
Day of Week
Time
Frequency
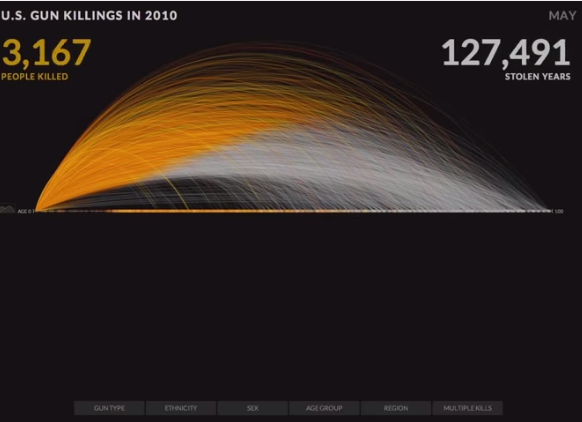
This is a story
So is this
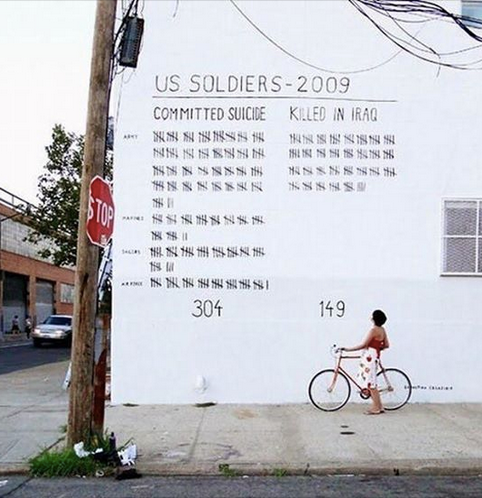
Data viz in a physical space as a catalyst for community engagement
What types of questions can we answer?
- what are the most dangerous times of day to ride your bike or walk in certain areas?
-
how does austin's gentrification compare to other cities?
-
which areas of austin are the most segregated?
-
what communities in Austin have the most community organizations per capita?
-
How have our commutes changed since 1990?
-
Do more young adults today in your area live with their parents than in previous decades? Do more own their own homes?
What's next?
How to reach me:
amaliebarras@gmail.com
832-607-6916
Change Is - 1
By Amalie Barras