Amr Eleraqi
كن انساناً وكفى
Introduction
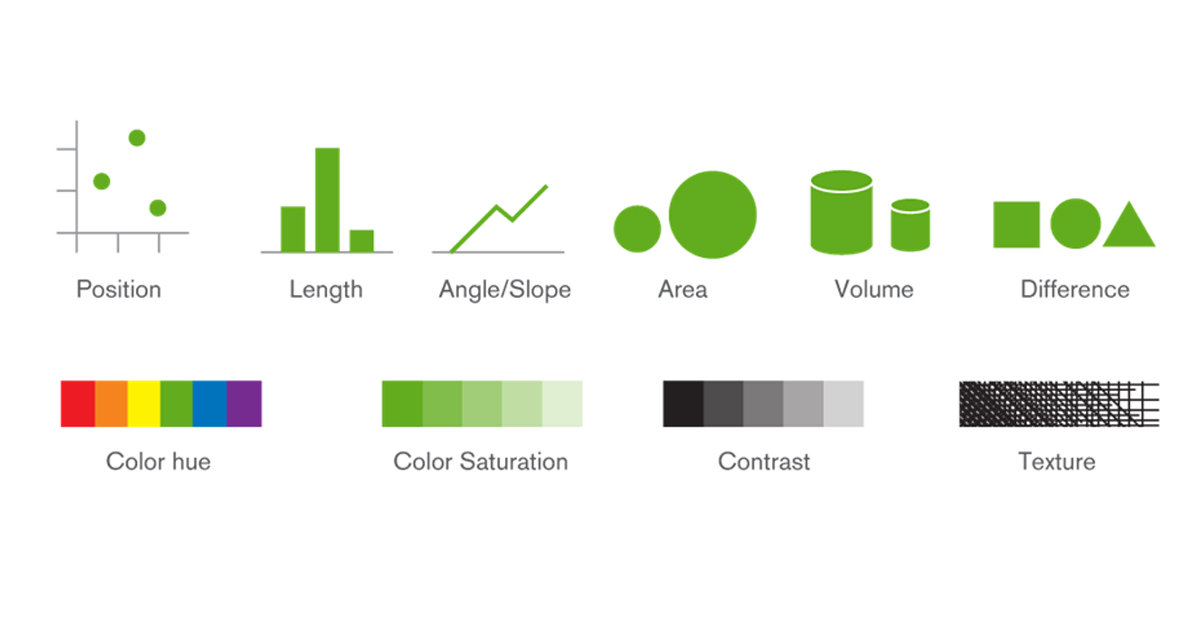
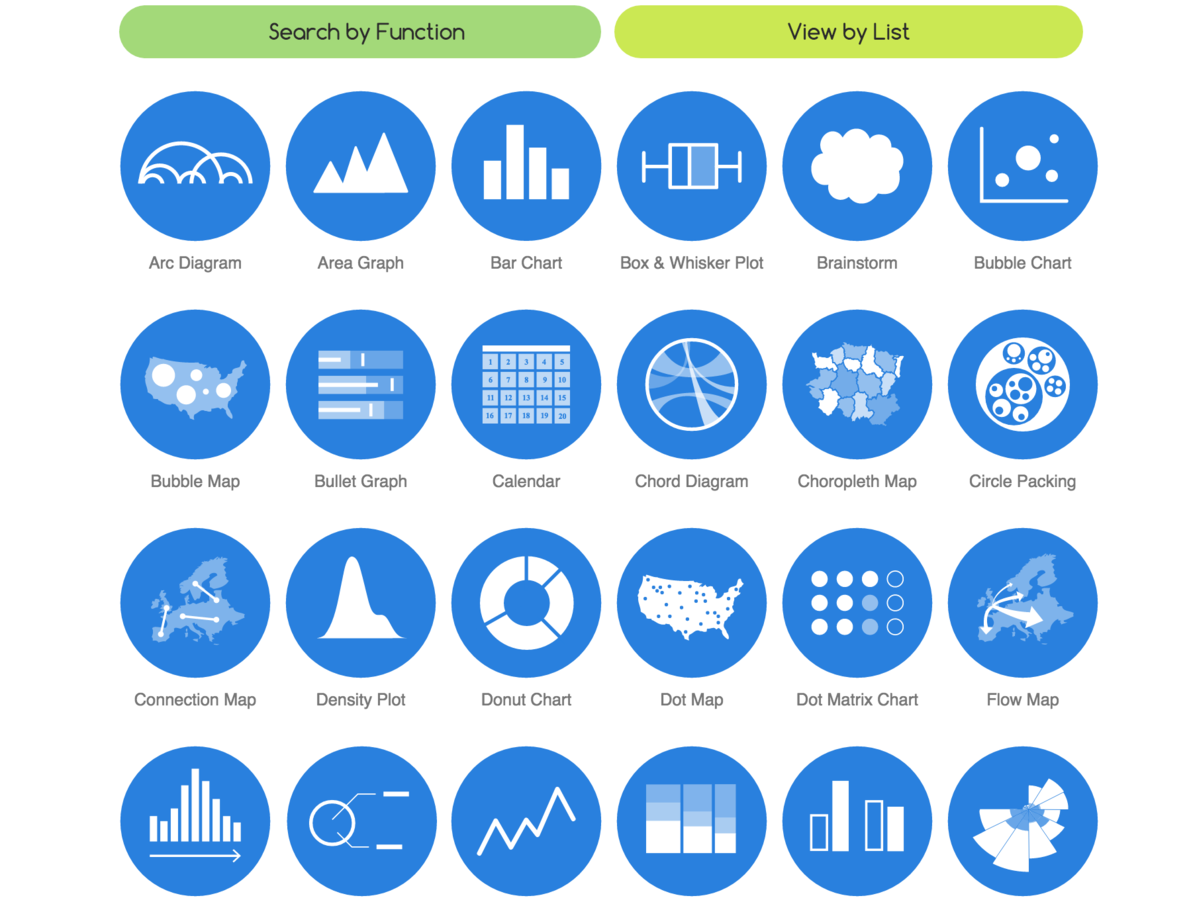
Building Blocks
Construction
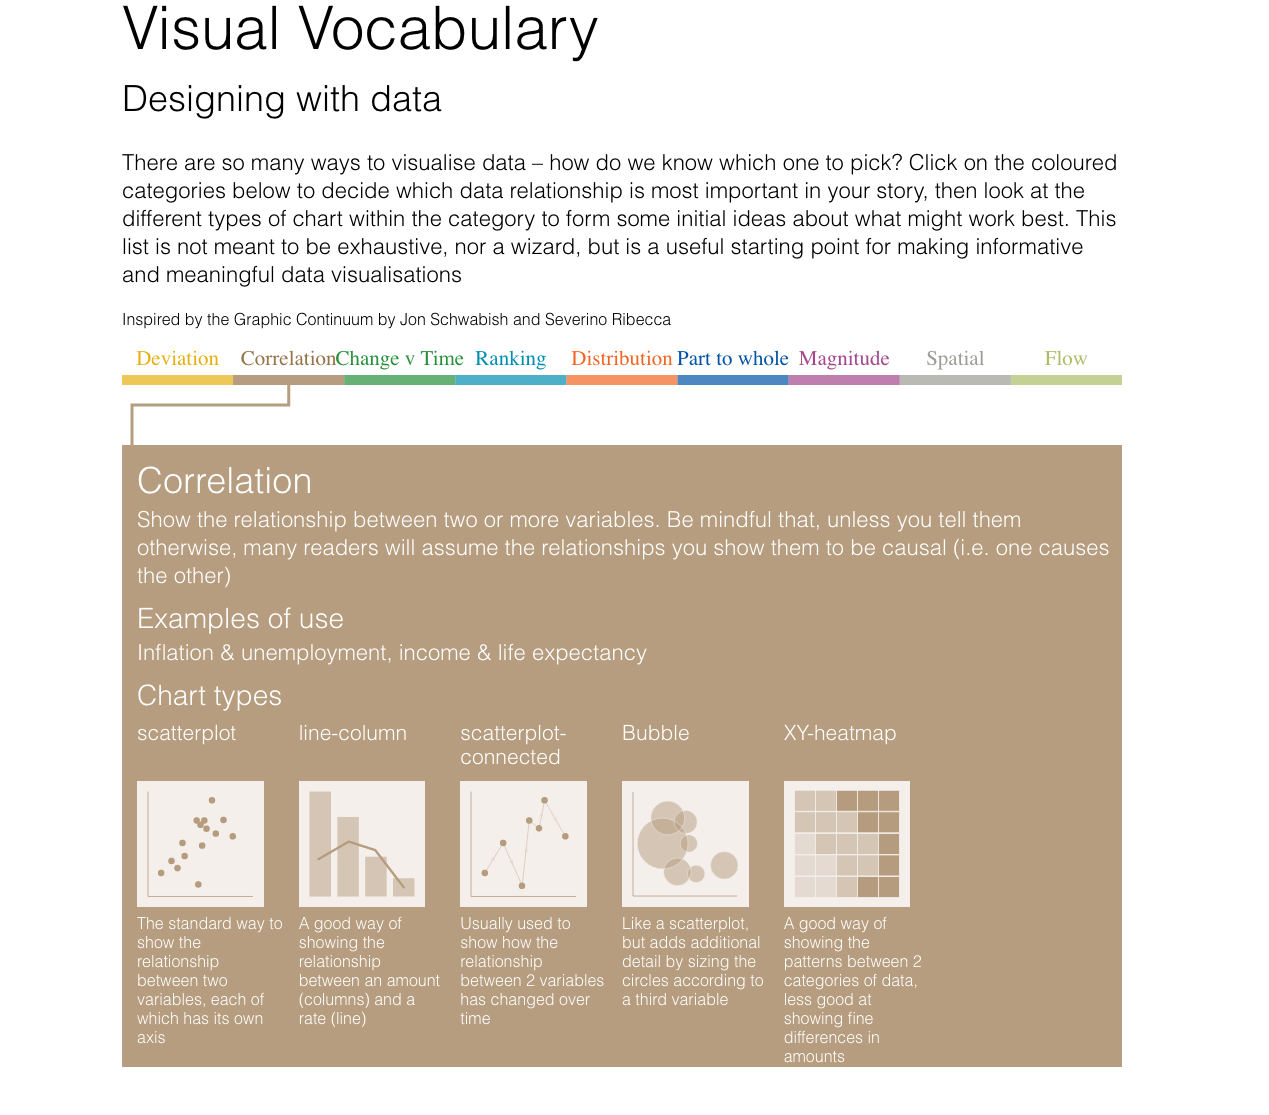
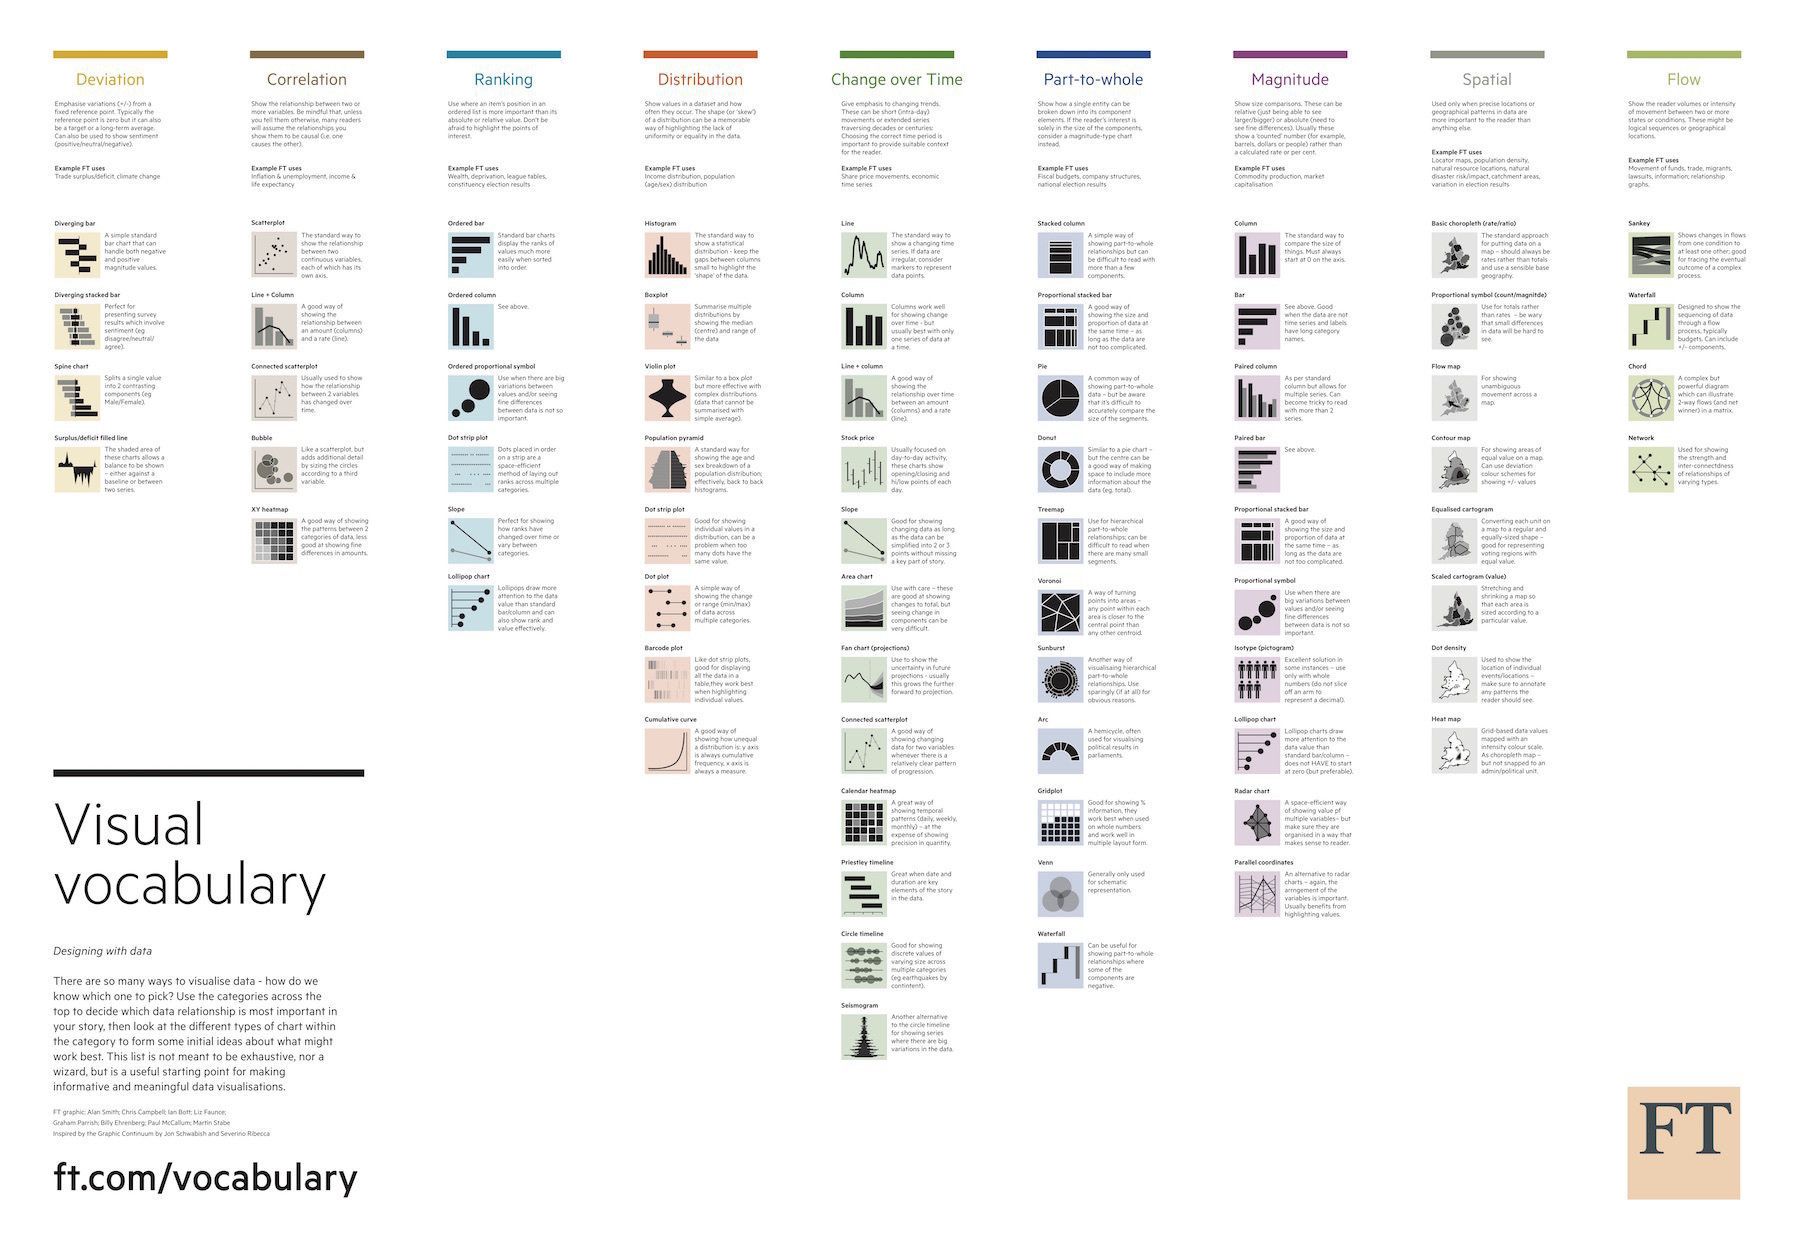
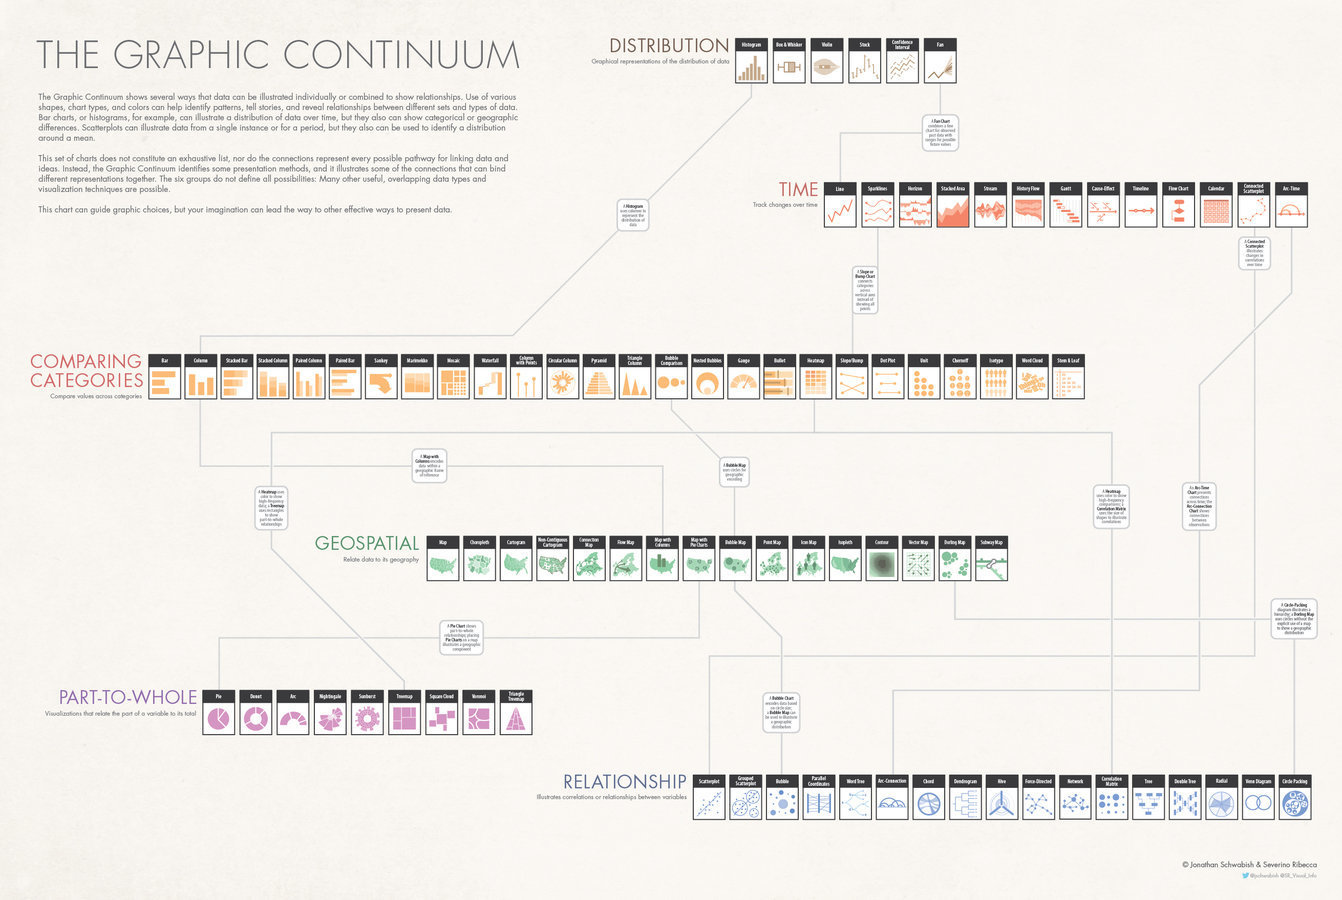
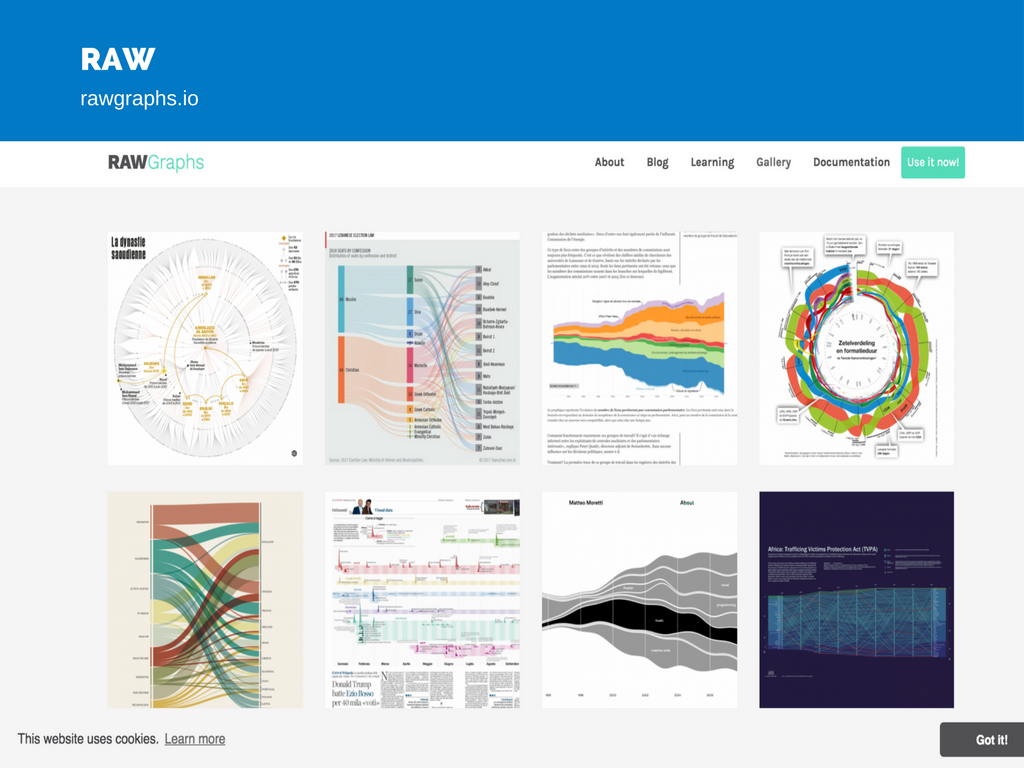
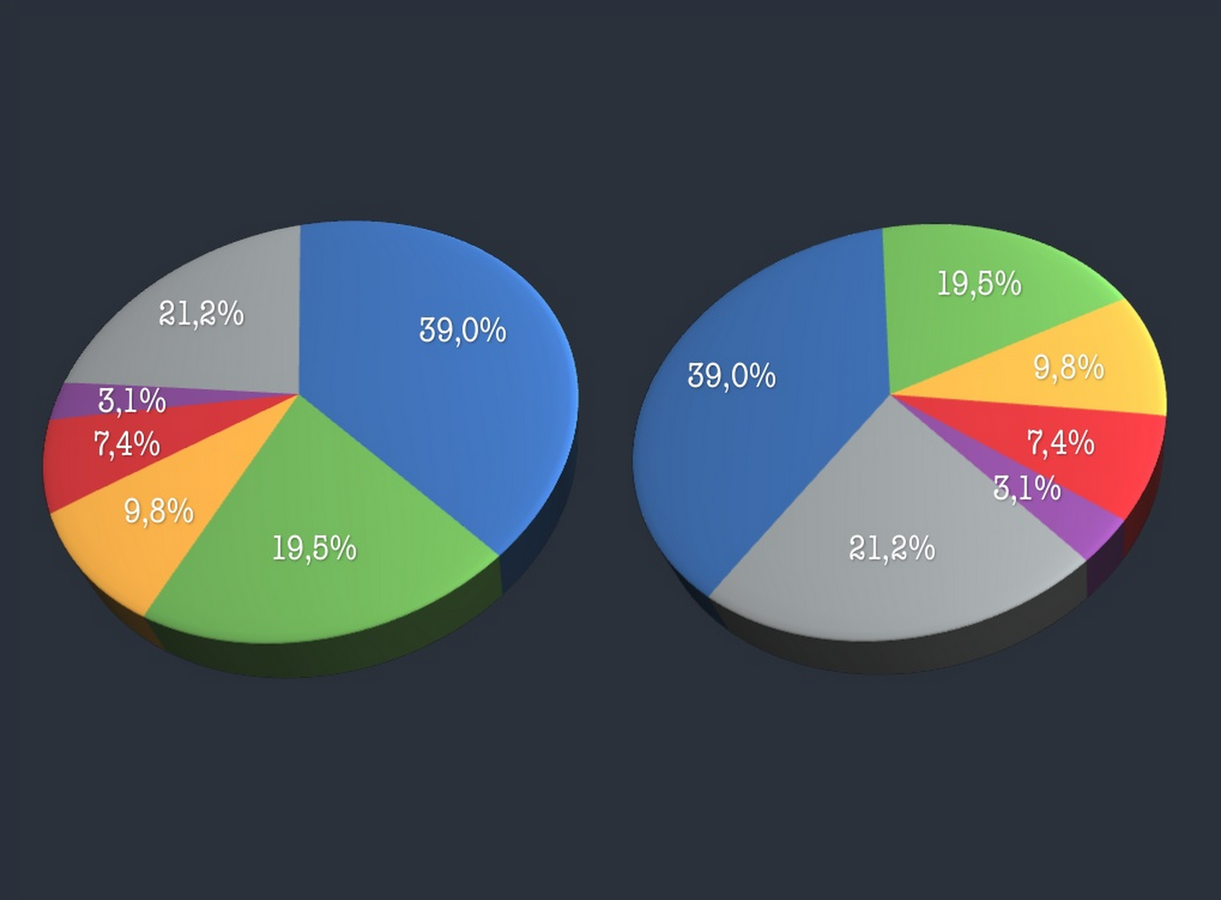
Data visualisation is broadly defined as a method of encoding quantitative, relational, or spatial information into images.
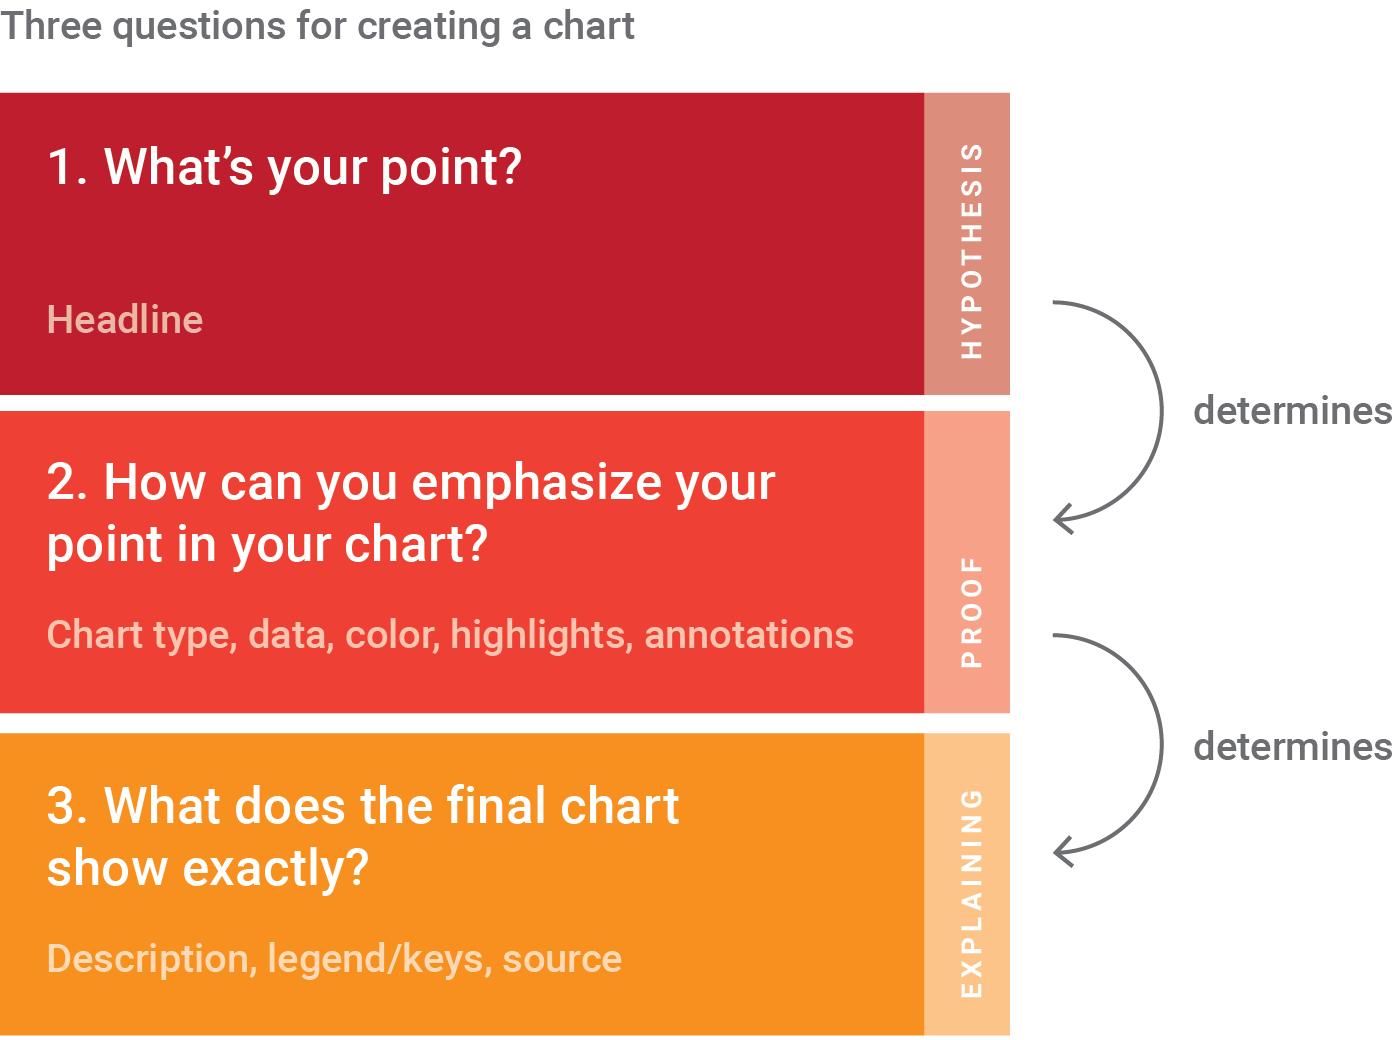
Message:
Distribution
Correlation
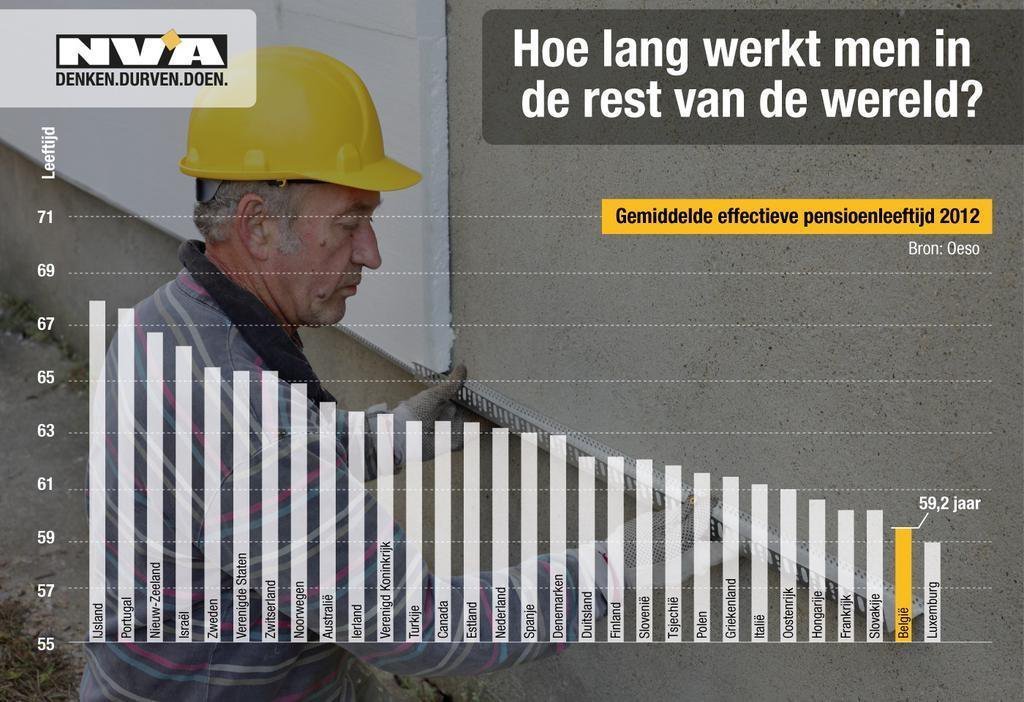
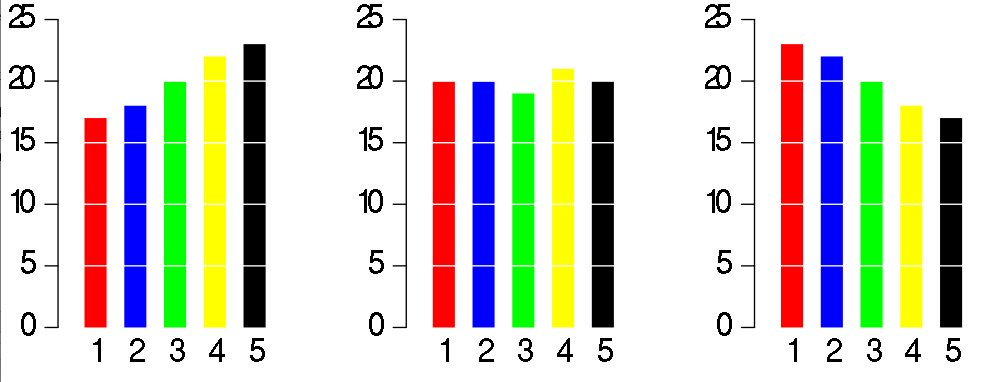
Ranking
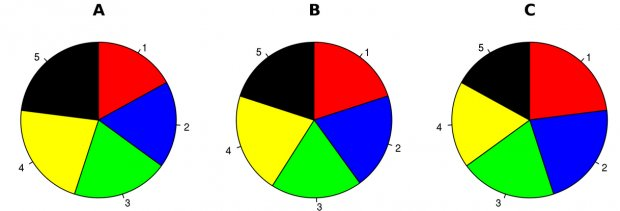
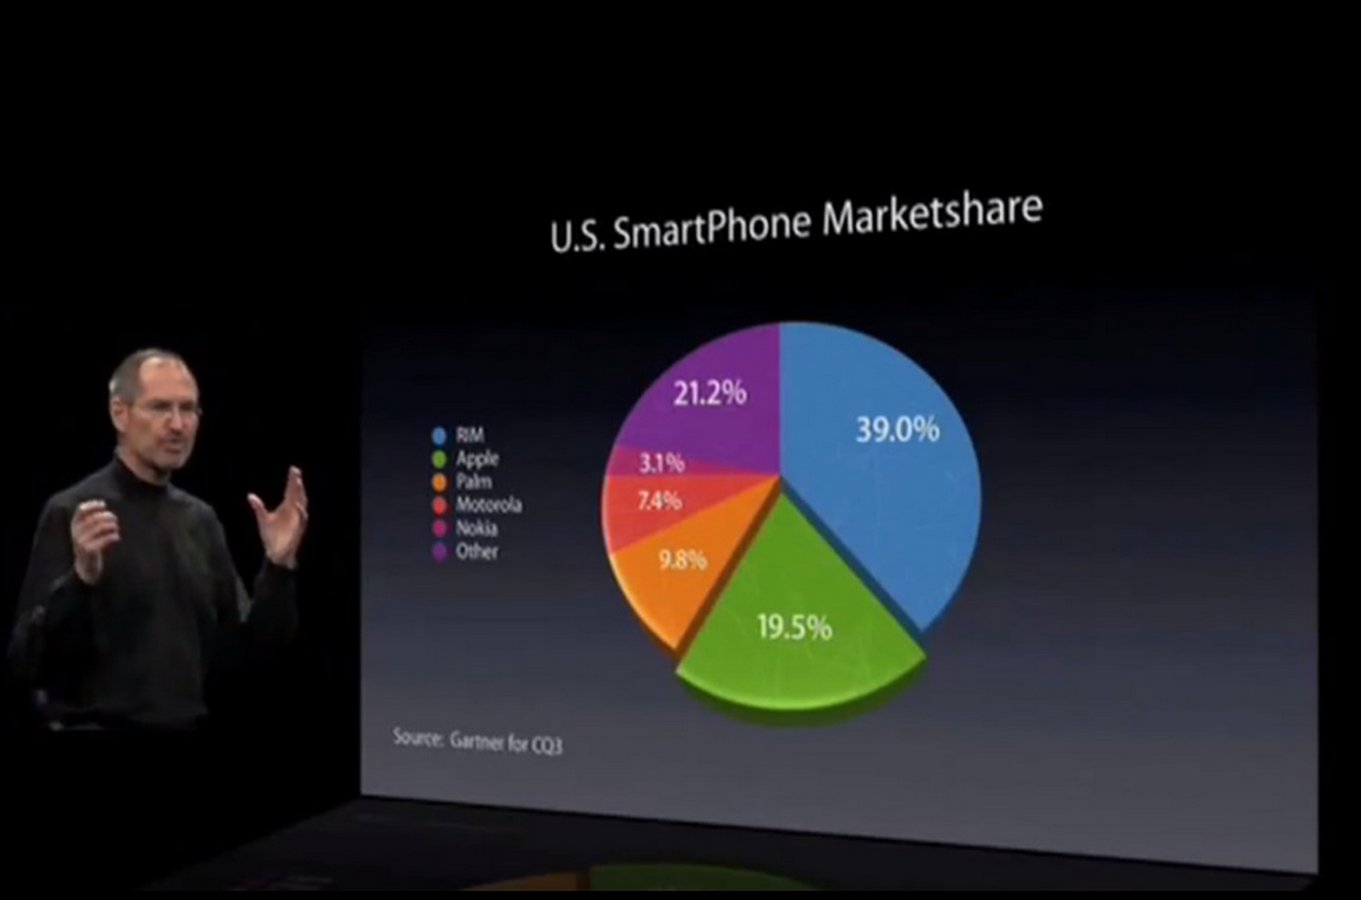
Part of a whole
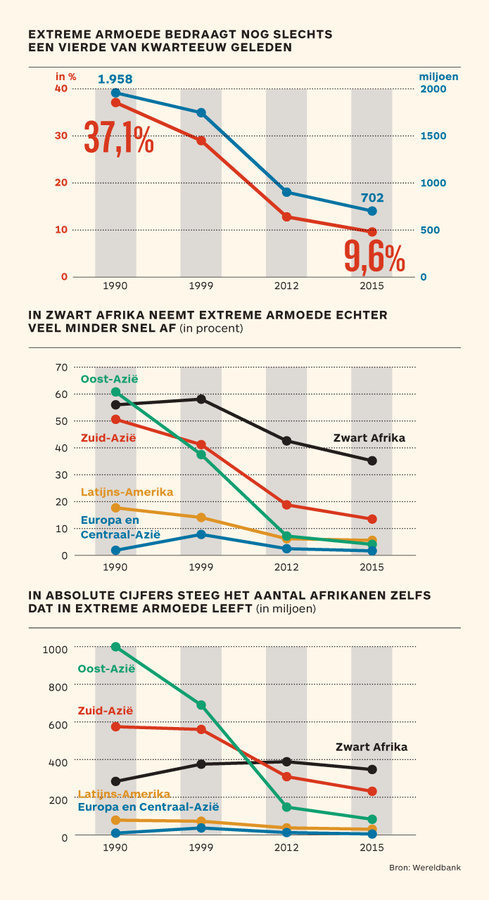
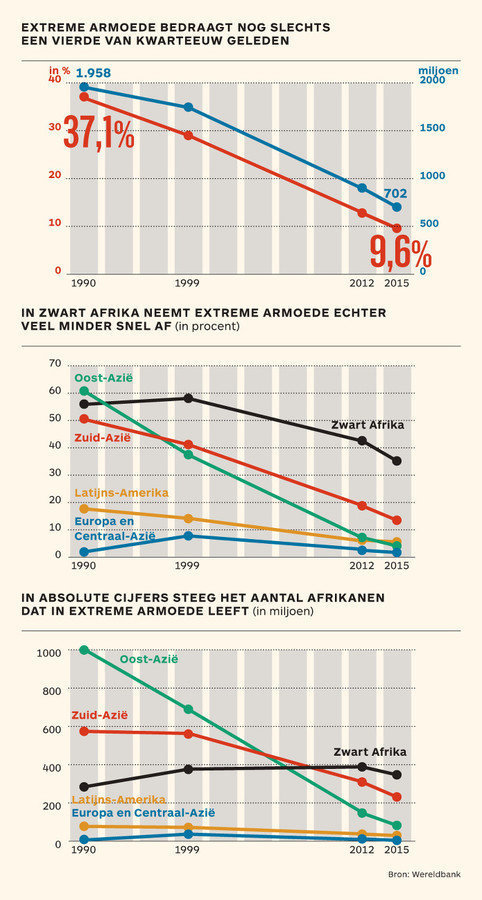
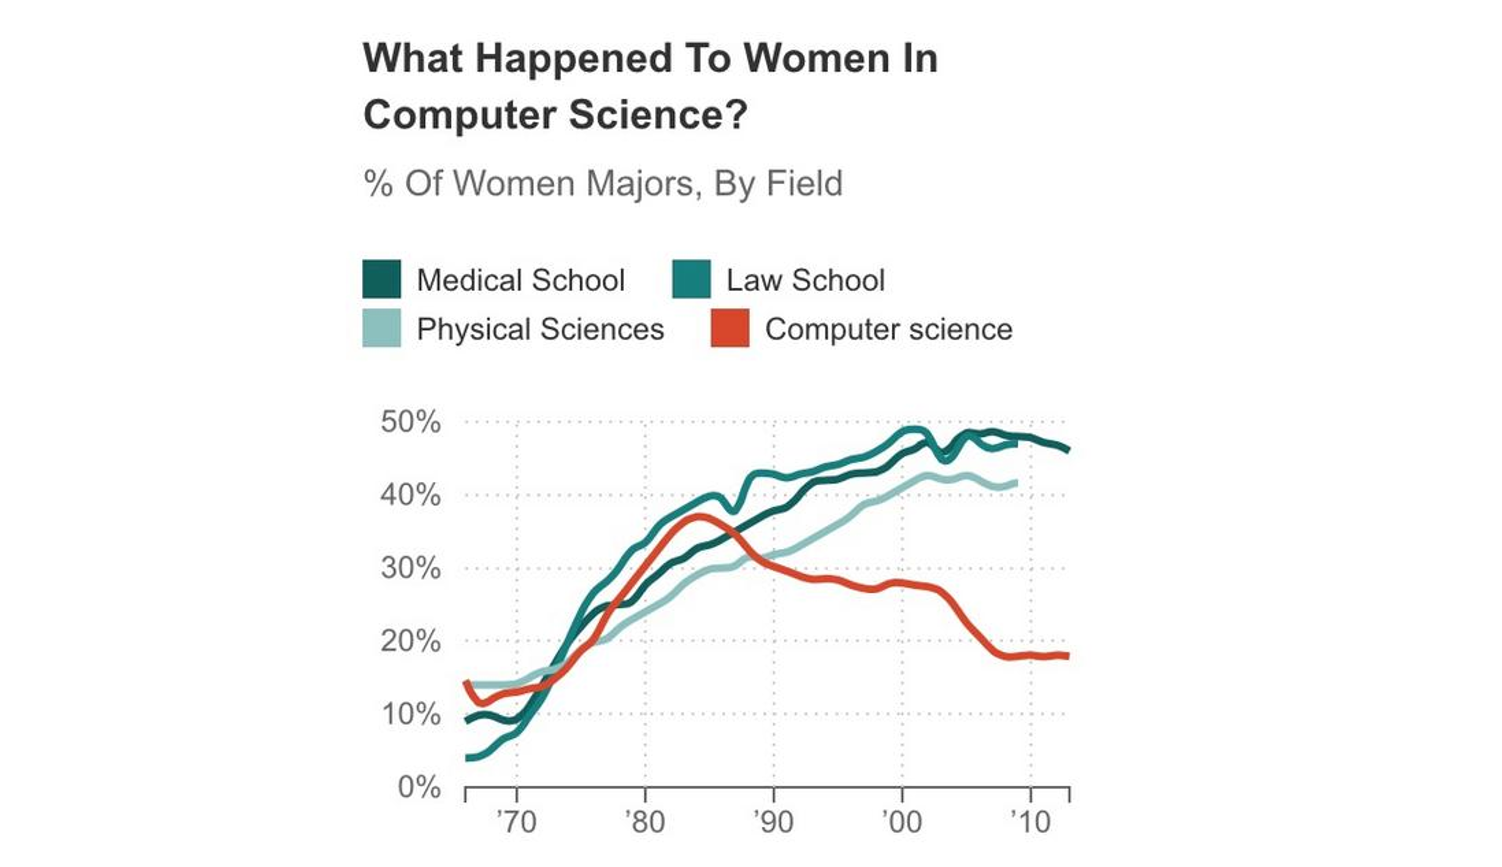
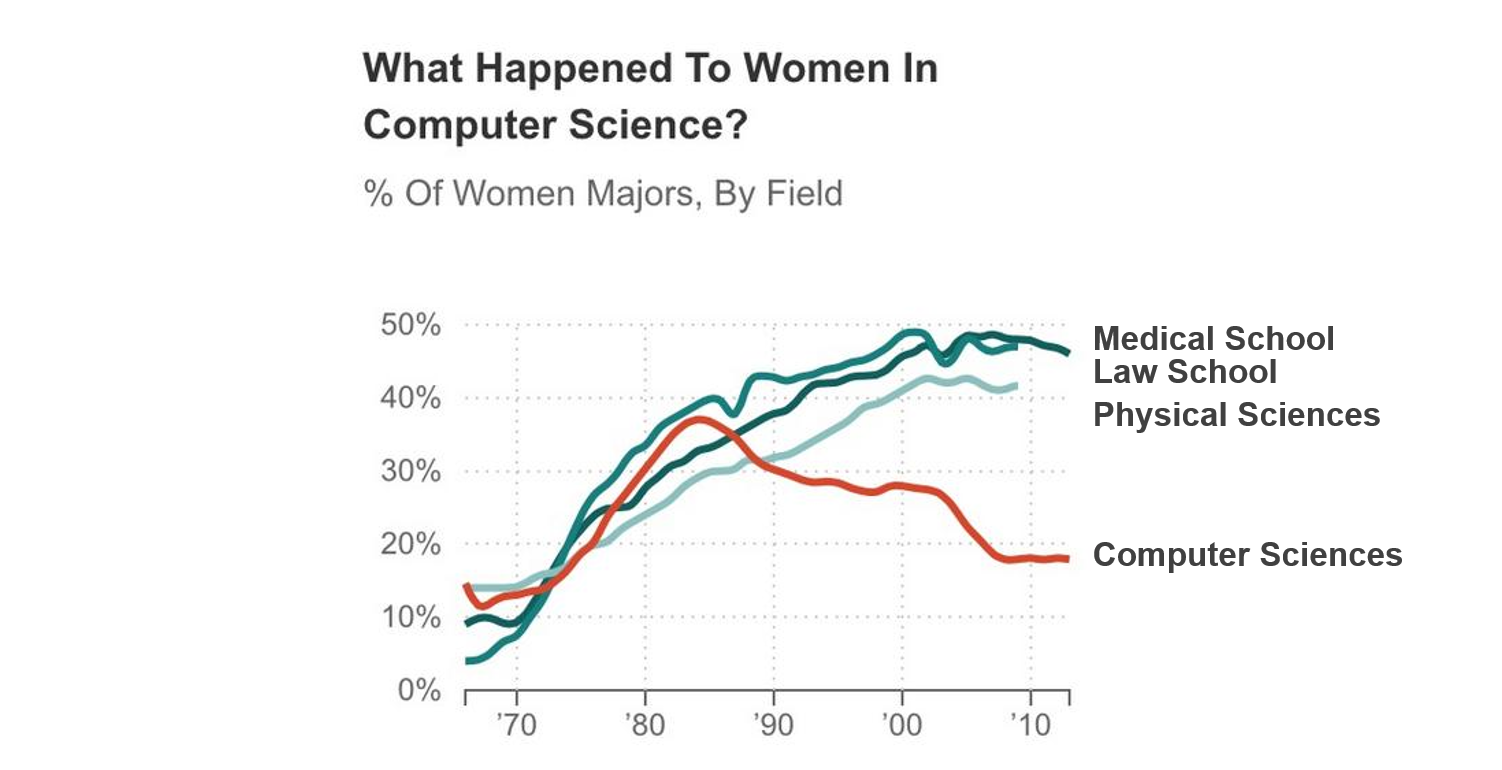
Evolution
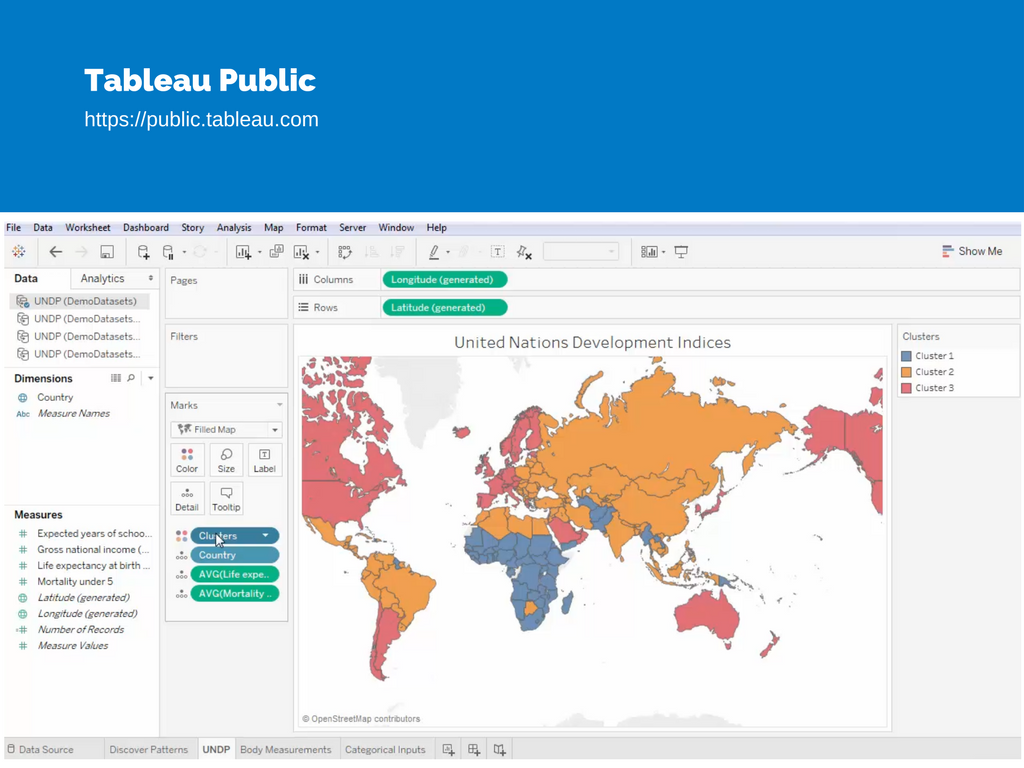
Map
Flow
Data type:
Numeric
Categoric
Numeric + Categoric
Maps
Network
Your graph will depend on
By Amr Eleraqi


