state of the chart:
d3 charting libraries in january 2015,
a short, personal and incomplete survey
Anna Powell-Smith http://anna.ps @darkgreener
so many charting libraries

soooooooooooooo many

which?
why?
what next?
1. which

d3 libraries i looked at
- nvd3
- c3
- dc
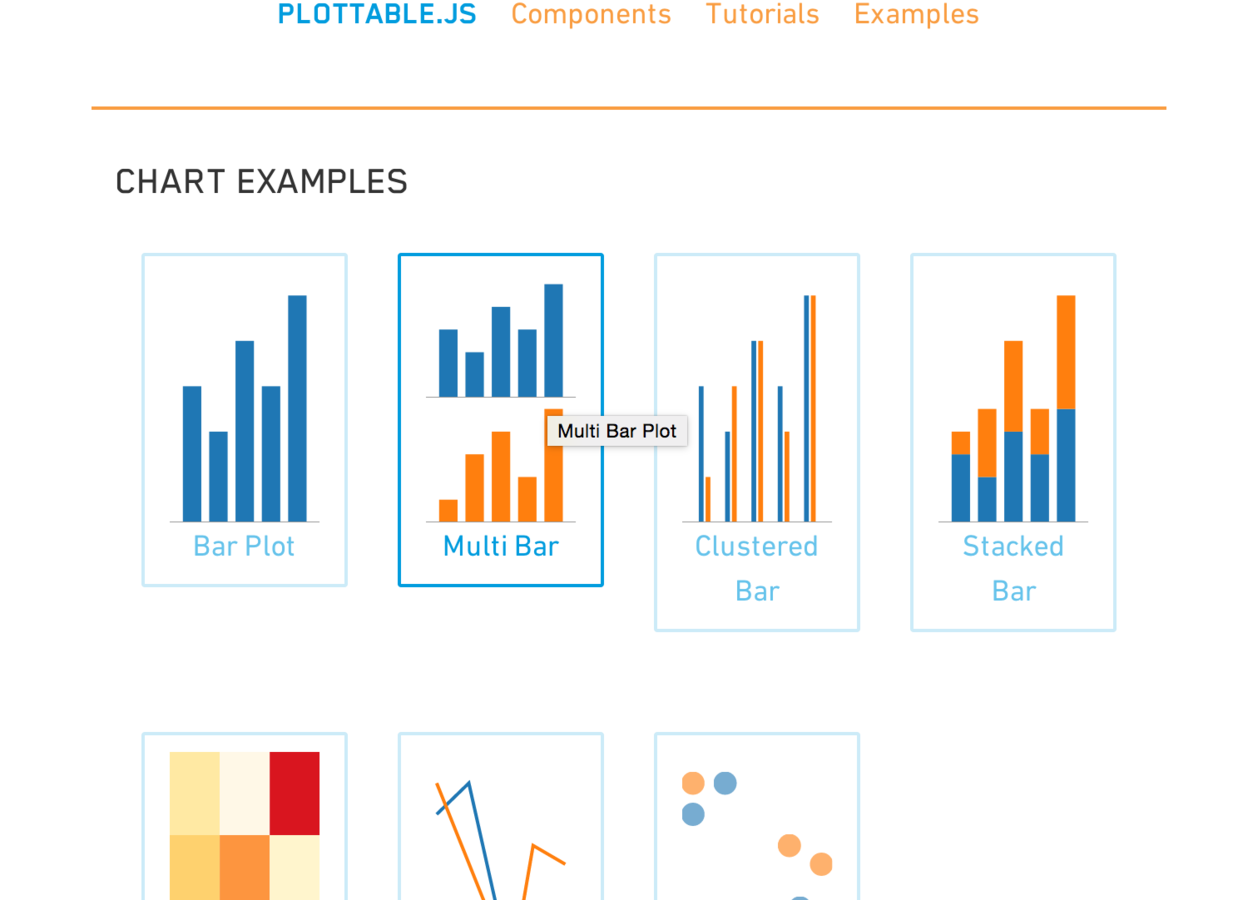
- plottable (palantir)
d3 libraries i didn't look at
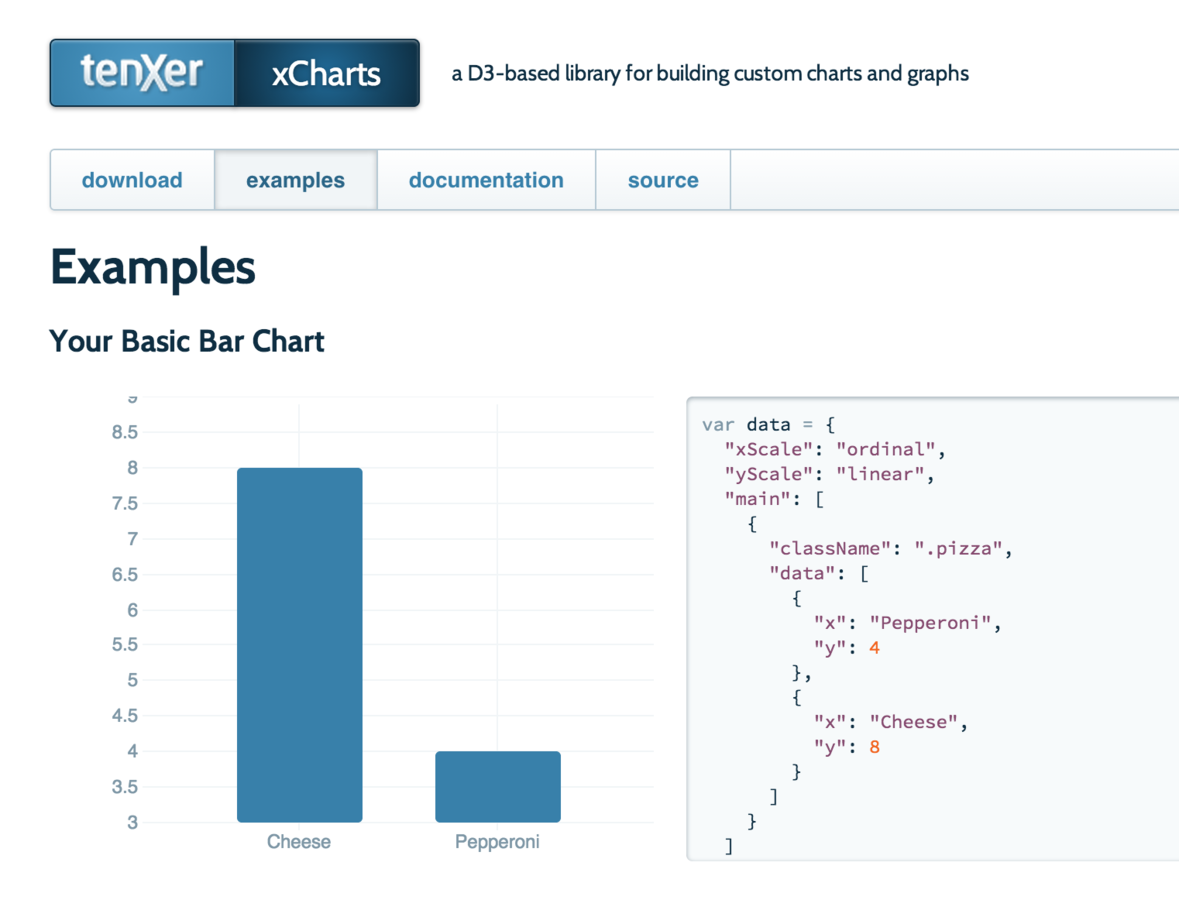
- xcharts (not actively developed)
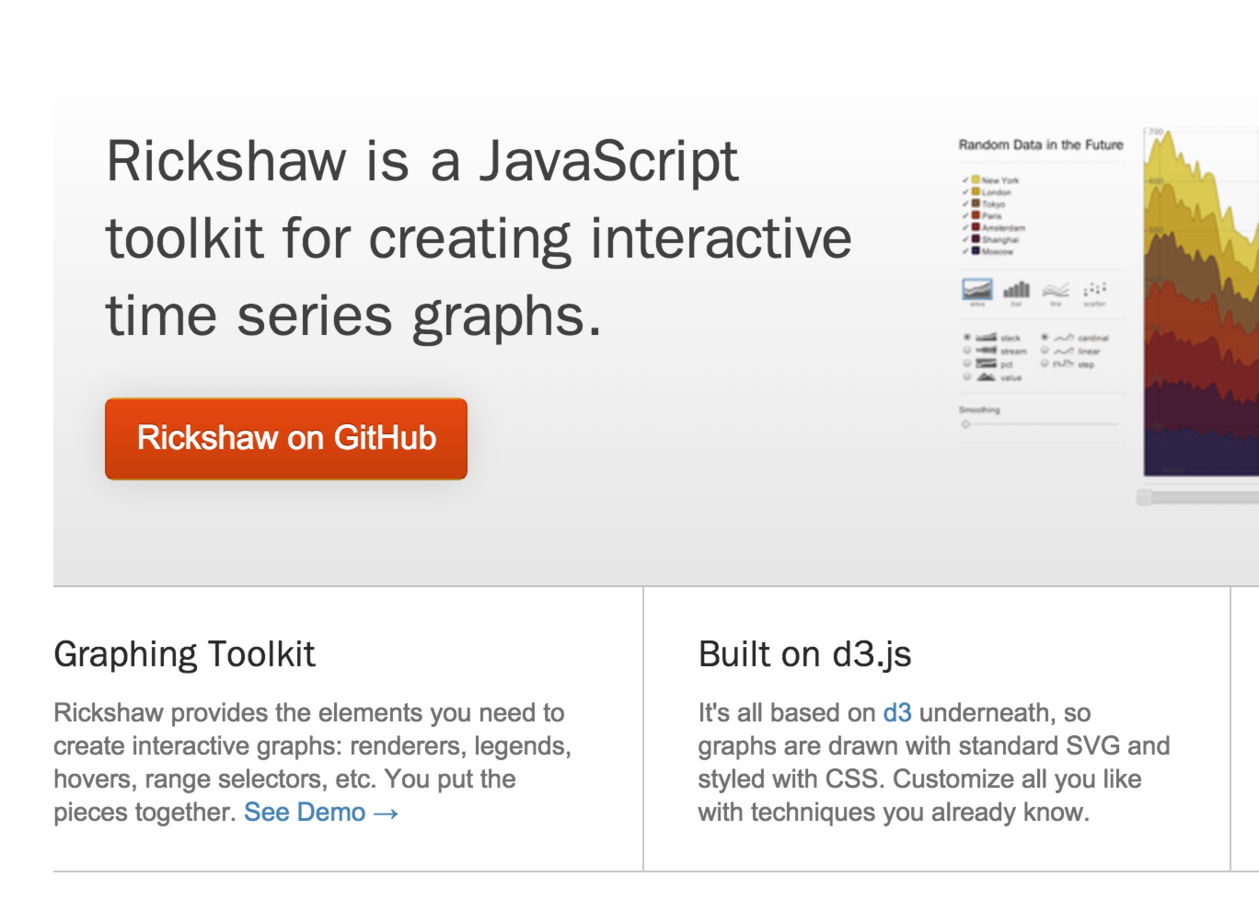
- rickshaw (not actively developed)
- polycharts ($$$)
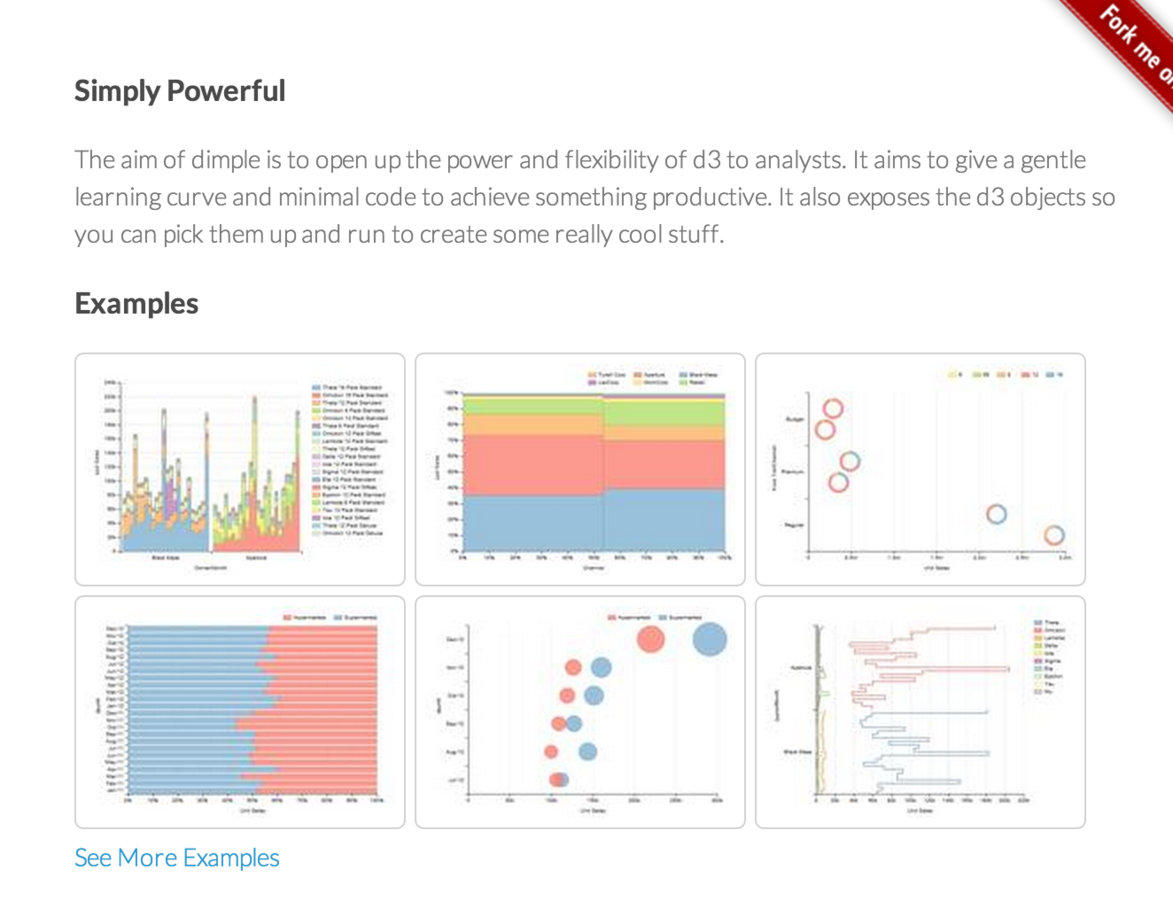
- dimple (only one active dev)
- raw (really an exploratory/design tool)
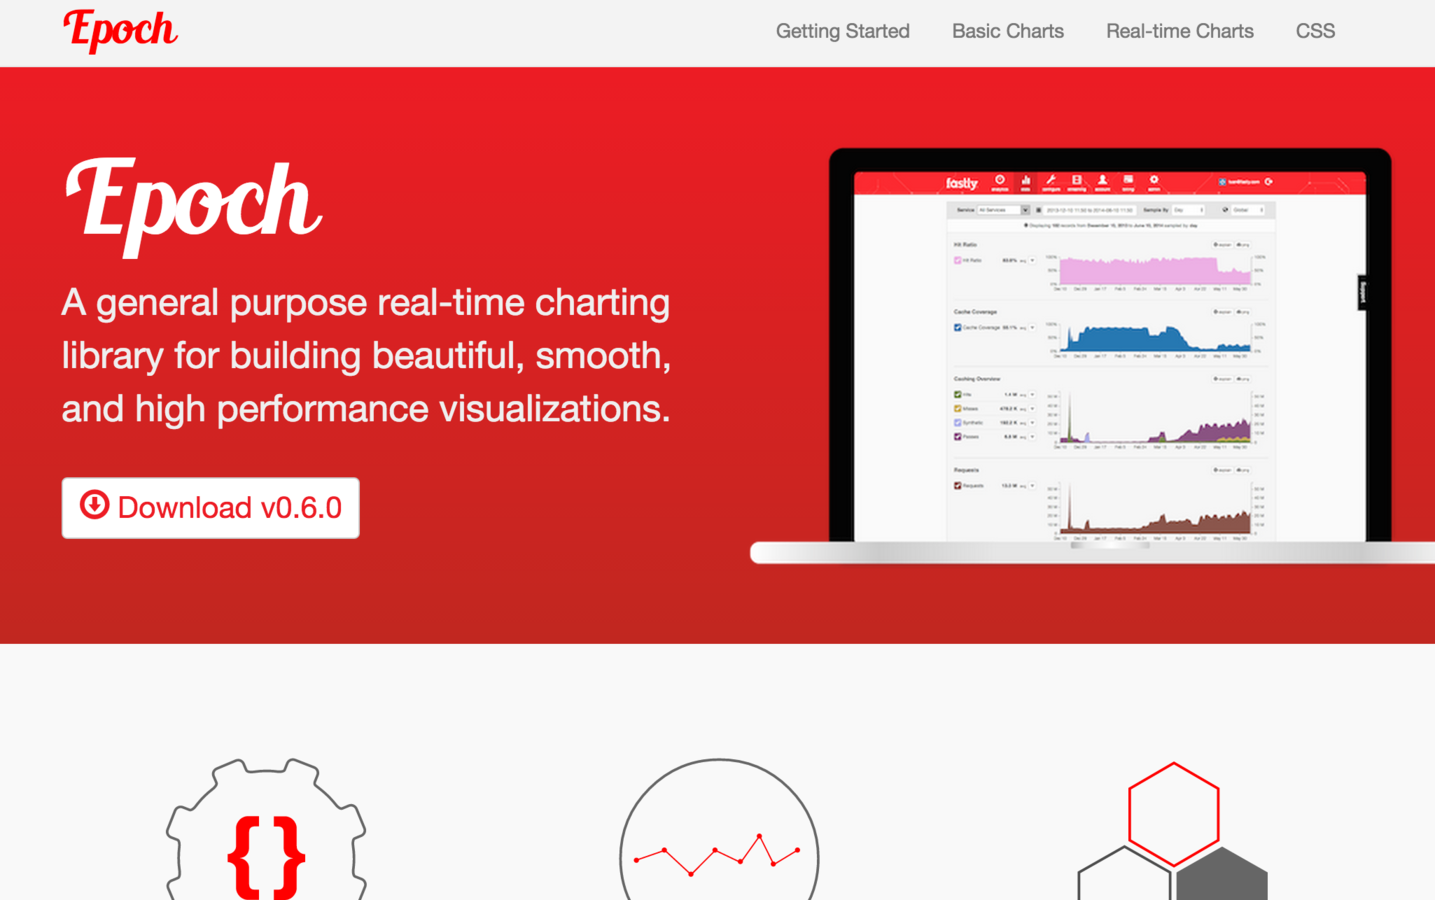
- epoch (focussed on realtime data)
post-talk note: lots of love for dimple at the meetup, especially for analysis - should check this out
d3 libraries i didn't look at
- metricsgraphics by mozilla (looks interesting, but i ran out of time)
- vega (interesting, but perhaps more theoretically right now)
and i also didn't look at
- anything deliberately specialist:
- network graphs (jsnetworkx)
- responsive charts (chartist)
- parallel coordinates (parallel coordinates)
- large datasets (crossfilter)
and i also didn't look at
- d3 libraries for your favourite javascript mvc:
- d3-angular
- d3-react
- d3-meteor
- d3-too-hip-for-you
oh yeah, not that either
- anything not based on d3
- the five d3 chart libraries released since yesterday
- your favourite d3 chart library (sorry about that)
it's a bit overwhelming...

would like to meet...
- sensible philosophy
- open licence
- being actively developed...
- ...ideally by more than one person
- straightforward setup
- supports transitions
- access to underlying d3
- support for writing plugins
we'll look at bar charts in each one
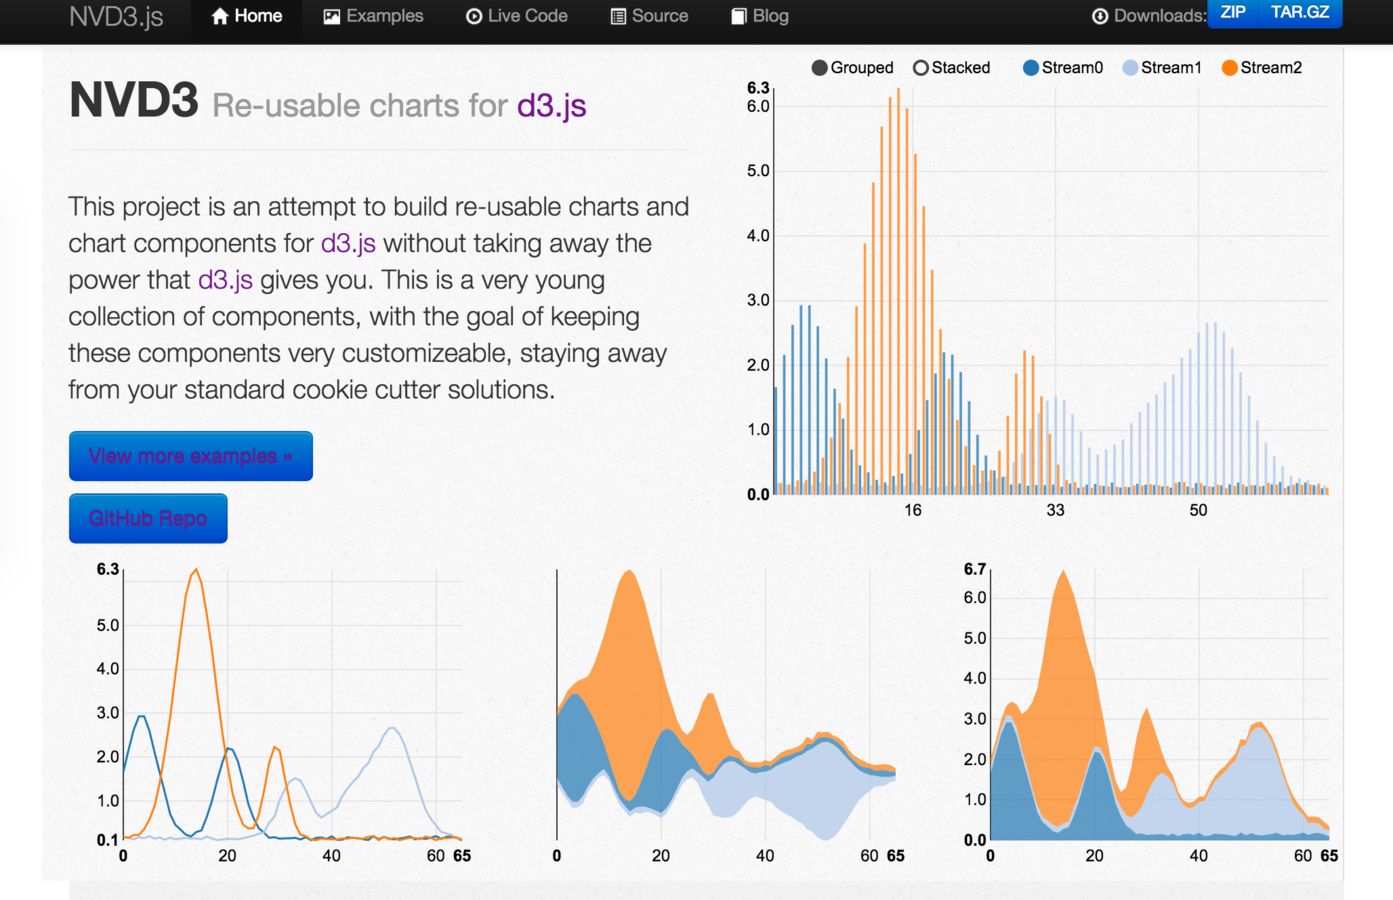
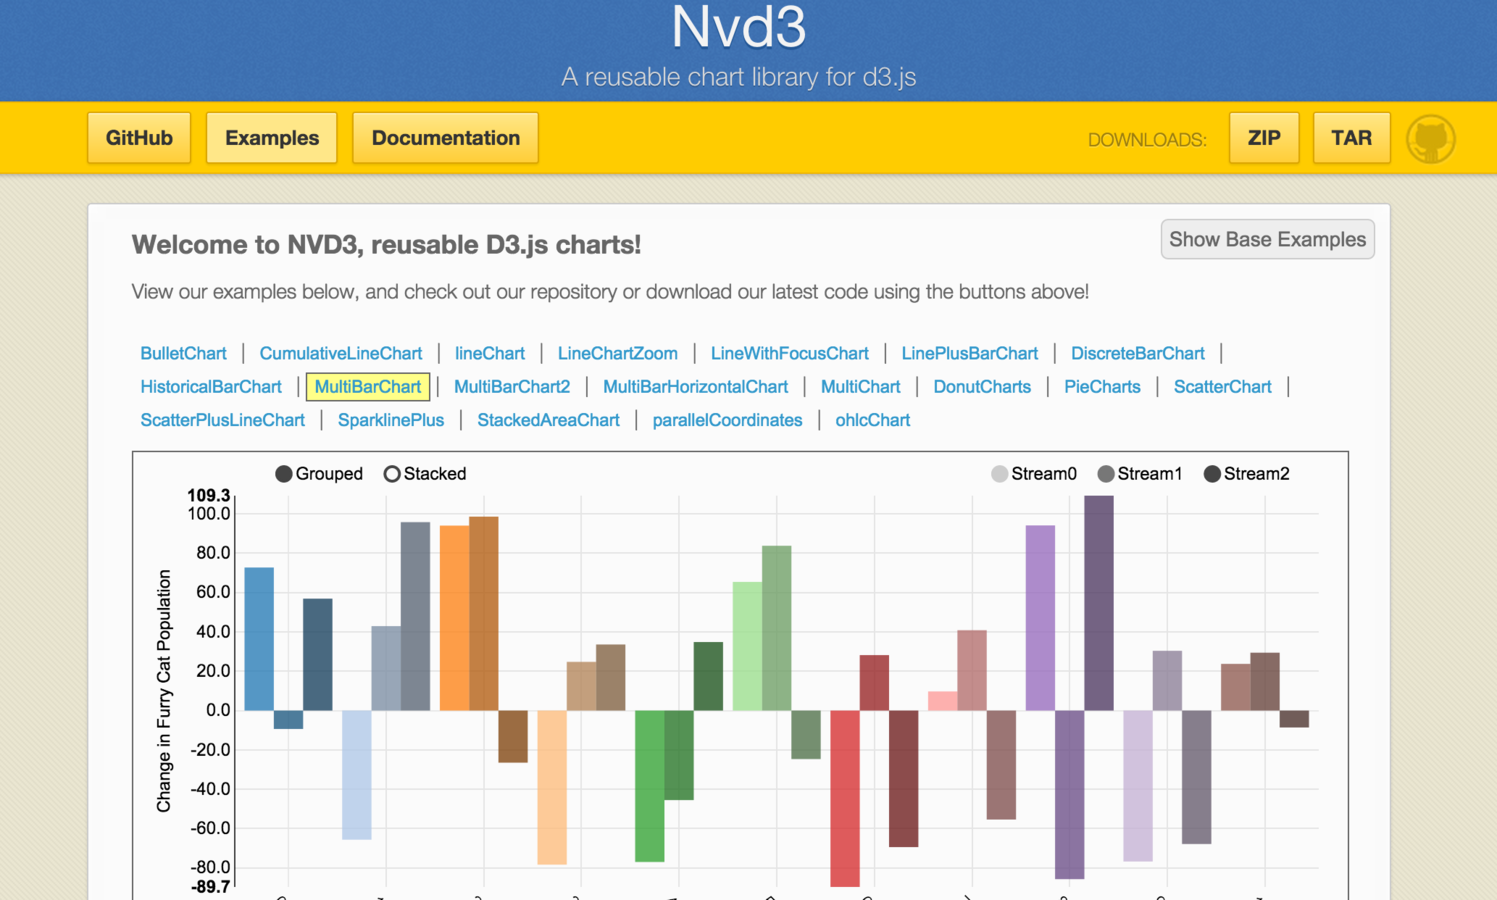
nvd3
history is... interesting
- initially developed by a dev at Novus
- he made it open source, but Novus objected
- then they changed their mind
- then they stopped actively developing it when he moved on
- then someone else forked it, then decided they didn't have time to maintain it
- then someone made a community fork

"A reusable chart library for D3"
- Apache licence
- Based on Mike Bostock's "Towards Reusable Charts"
- Begun in May 2013, currently 1.7
- "Reece" now seems to be leading
- Semi-actively developed
- Documentation split across two sites
nv.addGraph(function() {
  var chart = nv.models.discreteBarChart()
      .x(function(d) { return d.label })    //Specify the data accessors.
      .y(function(d) { return d.value })
      .staggerLabels(true)    // Staggering labels.
      .tooltips(false)        //Don't show tooltips
      .showValues(true)       //...instead, show bar value on top of each bar.
      .transitionDuration(350)
      ;

  d3.select('#chart svg')
      .datum(exampleData())
      .call(chart);

  nv.utils.windowResize(chart.update);

  return chart;
});
pros
- Loads of options
- Mature
- Great that there's now a community project with a clear licence situation
cons
- Documentation not great
- Definitely an 'NVD3 way' - I find it hard to follow
- Is it alive?
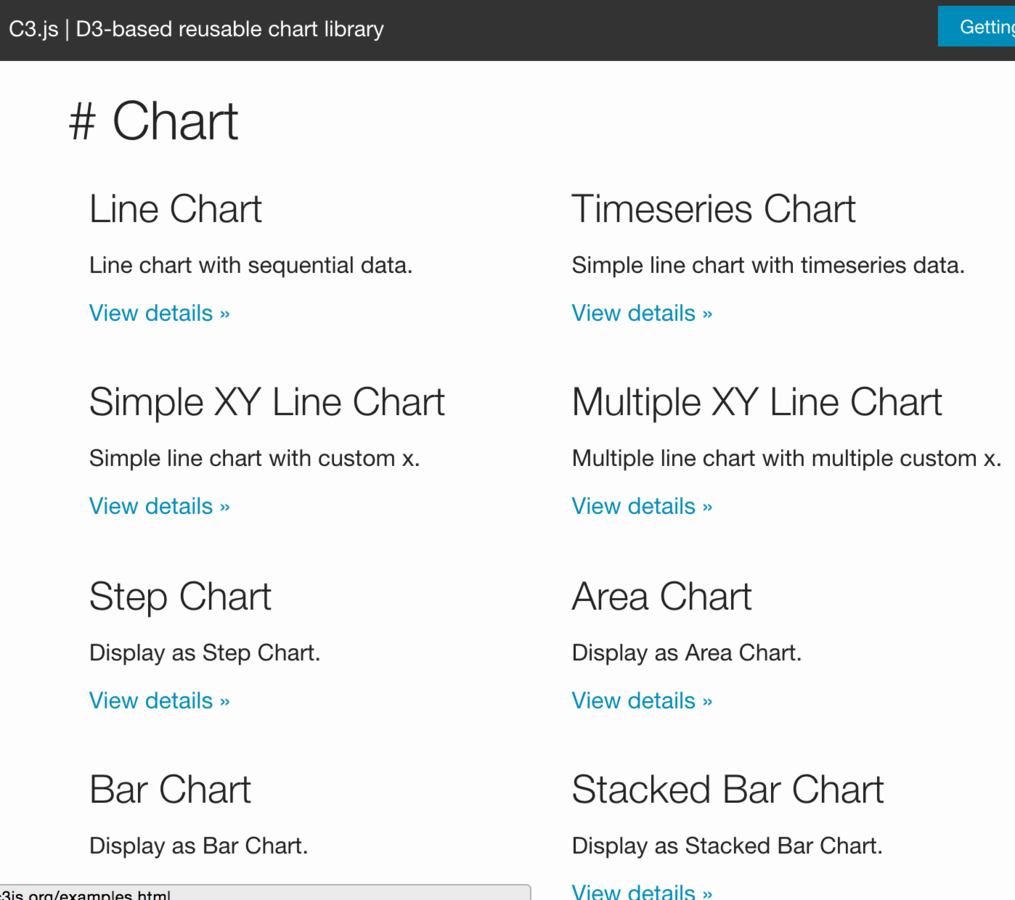
c3
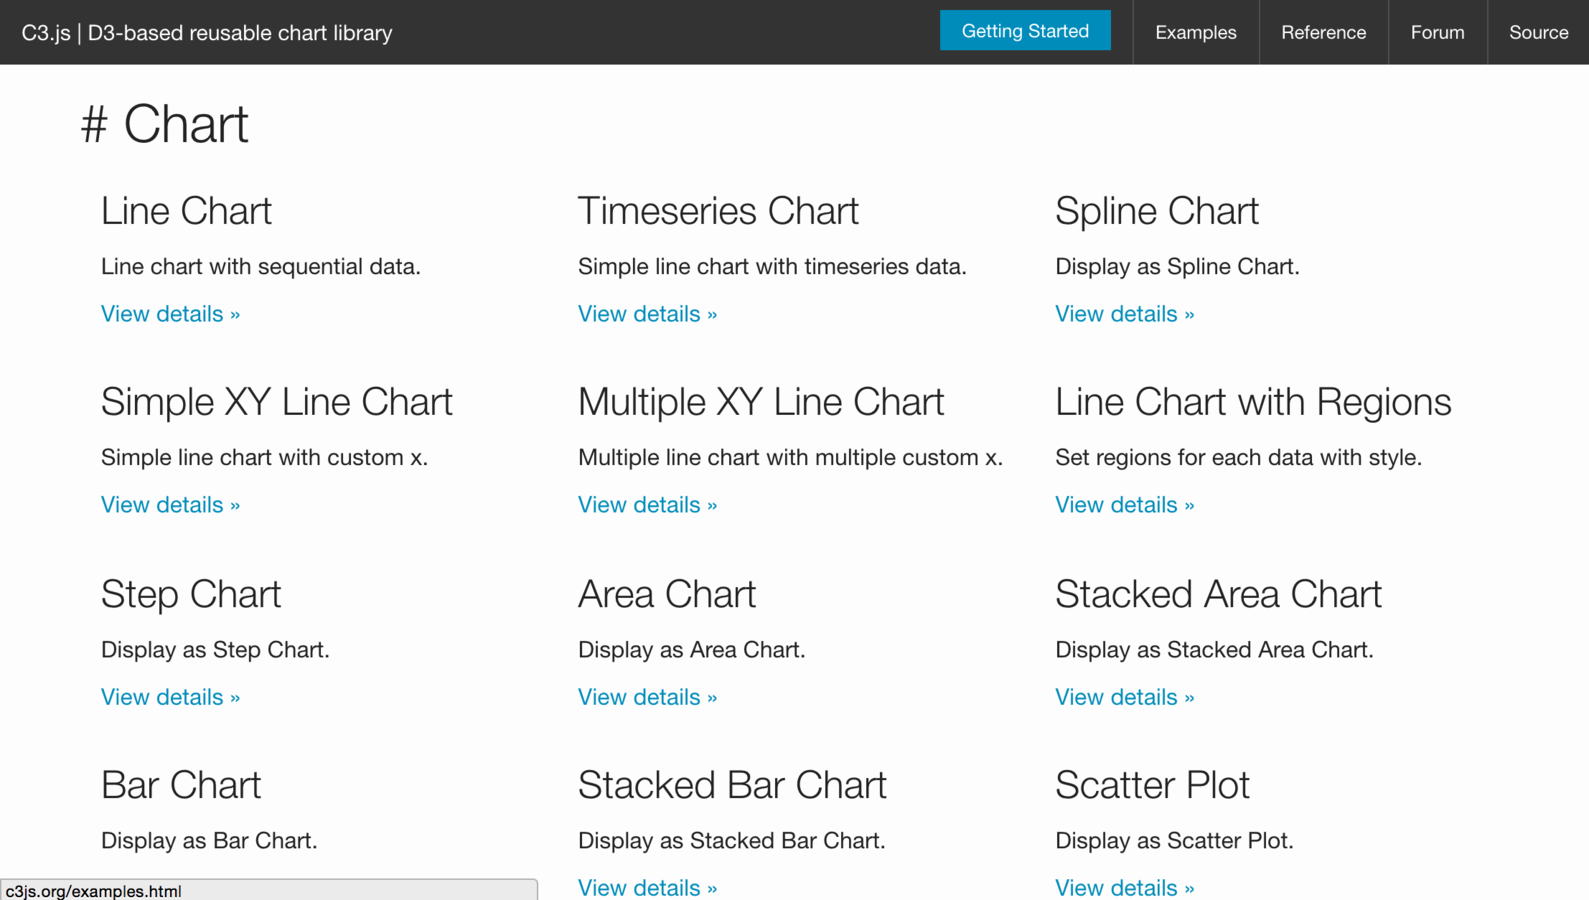
"D3-based reusable chart library"
- MIT licence
- Begun in May 2013, currently v0.4
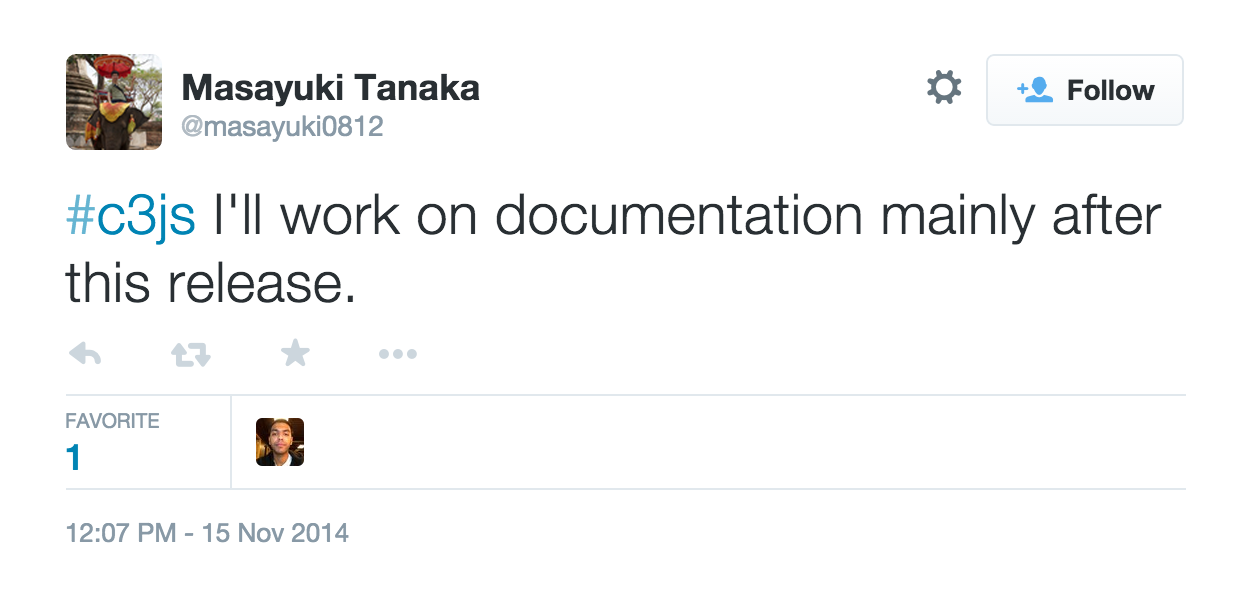
- Masayuki Tanaka is lead dev
- Actively developed
- Active Google Group
- 3,500 GitHub stars
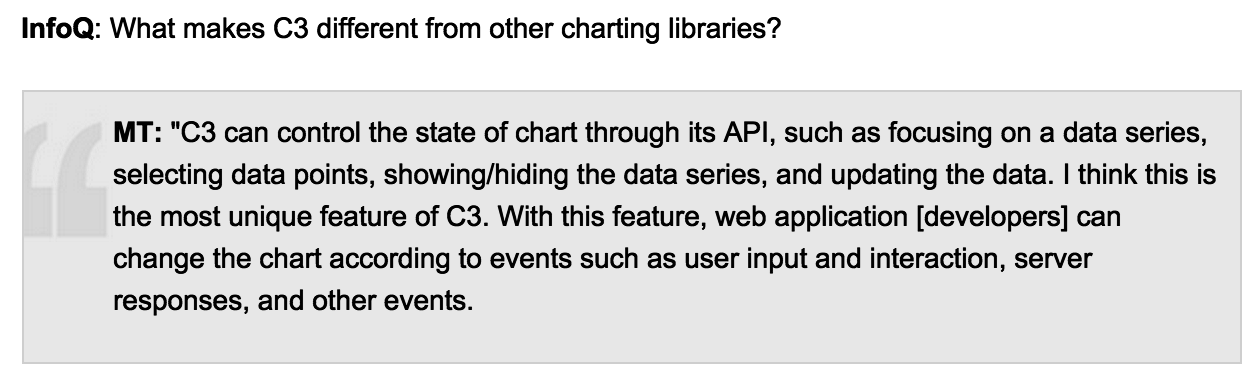
pros
- comfortable - feels familiar
- customisable - wraps the D3 code, extend via D3
- controllable - APIs to interact with chart state
var chart = c3.generate({
    data: {
        columns: [
            ['data1', 30, 200, 100, 400, 150, 250],
            ['data2', 130, 100, 140, 200, 150, 50]
        ],
        type: 'bar'
    },
    bar: {
       width: 100
    }
});

chart.load({
    columns: [
        ['data3', 130, -150, 200, 300, -200, 100]
    ]
});
var chart = c3.generate({
    data: {
        columns: [
            ['data1', 30, 200, 100, 400, 150, 250],
            ['data2', 130, 100, 140, 200, 150, 50]
        ],
        type: 'bar',
        labels: {
            format: {
                y: d3.format("$,")
            }
        }
    },
    bar: {
       width: 100
    }
});
cons
- documentation? (seems excellent to me)
- not many plugins yet (but supported)
- no specific responsive features
- fewer chart types than nvd3
- mostly one very active developer
dc
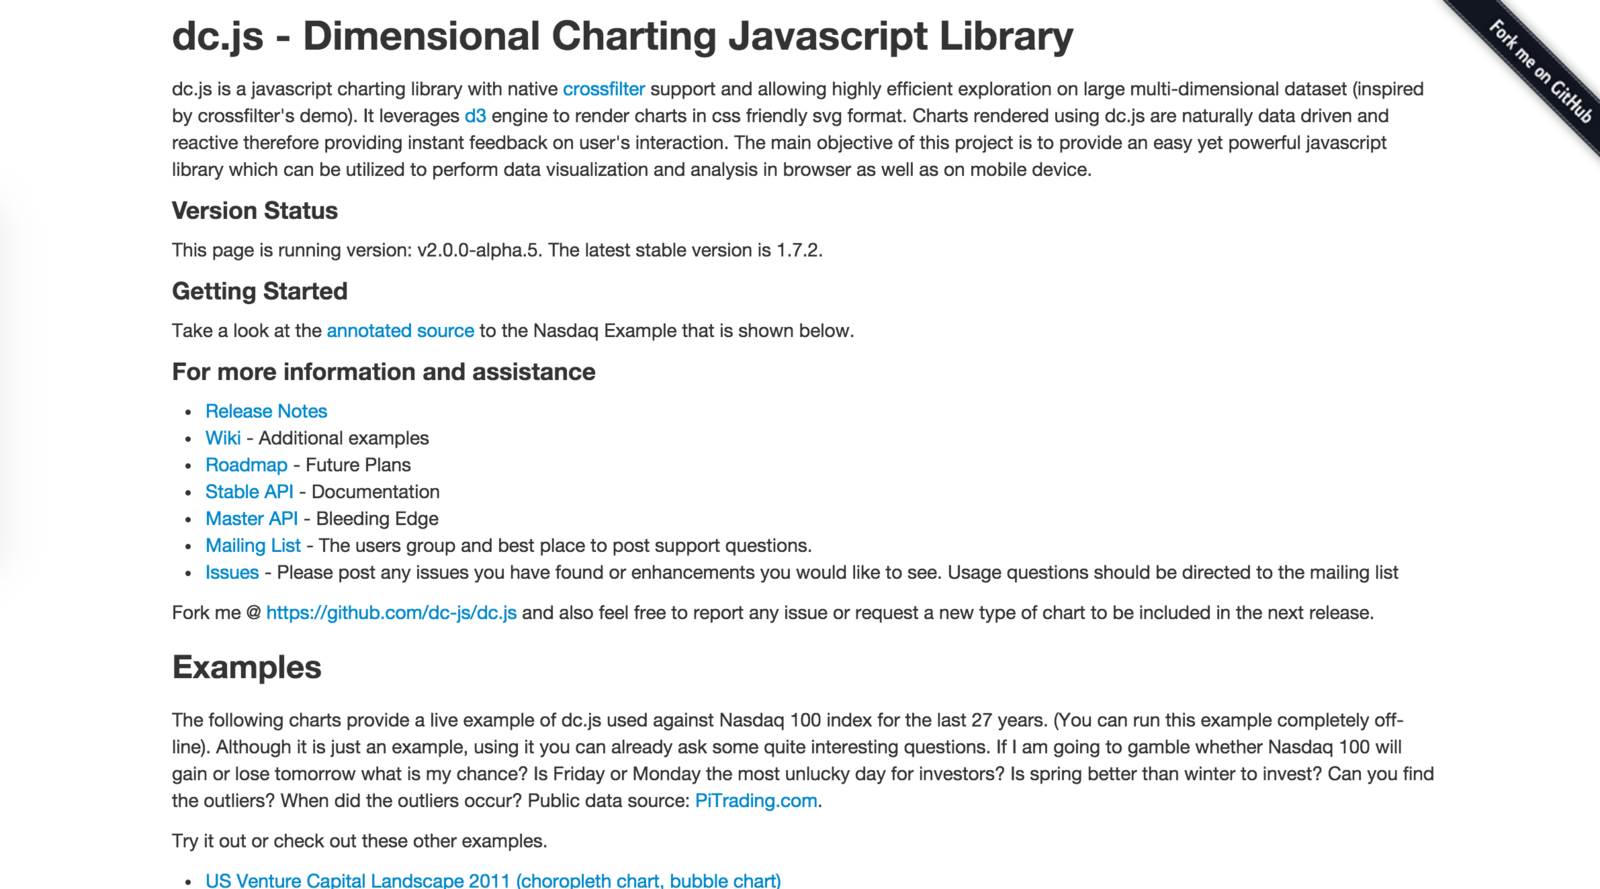
"Dimensional Charting Javascript Library"
- Apache licence
- Native Crossfilter support
- Started in 2012
- Actively developed (by 2 people!)
- 3,500 GitHub stars
var chart = dc.barChart("#test");
d3.csv("morley.csv", function(error, experiments) {

  experiments.forEach(function(x) {
    x.Speed = +x.Speed;
  });

  var ndx                 = crossfilter(experiments),
      runDimension        = ndx.dimension(function(d) {return +d.Run;}),
      speedSumGroup       = runDimension.group().reduceSum(function(d) {return d.Speed * d.Run / 1000;});

  chart
    .width(768)
    .height(480)
    .x(d3.scale.linear().domain([6,20]))
    .brushOn(false)
    .yAxisLabel("This is the Y Axis!")
    .dimension(runDimension)
    .group(speedSumGroup)
    .renderlet(function(chart) {
        chart.selectAll('rect').on("click", function(d) {
            console.log("click!", d);
        });
    });
    chart.render();
});
pros
- mature
- looks stable
- actively developed
- you can do impressive things with crossfilter + dc if you invest the time in learning to use it
cons
- needs upfront investment in learning to use it - imperative approach like nvd3
- documentation isn't brilliant
- probably good if you want to use crossfilter a lot and are willing to invest the time
plottable
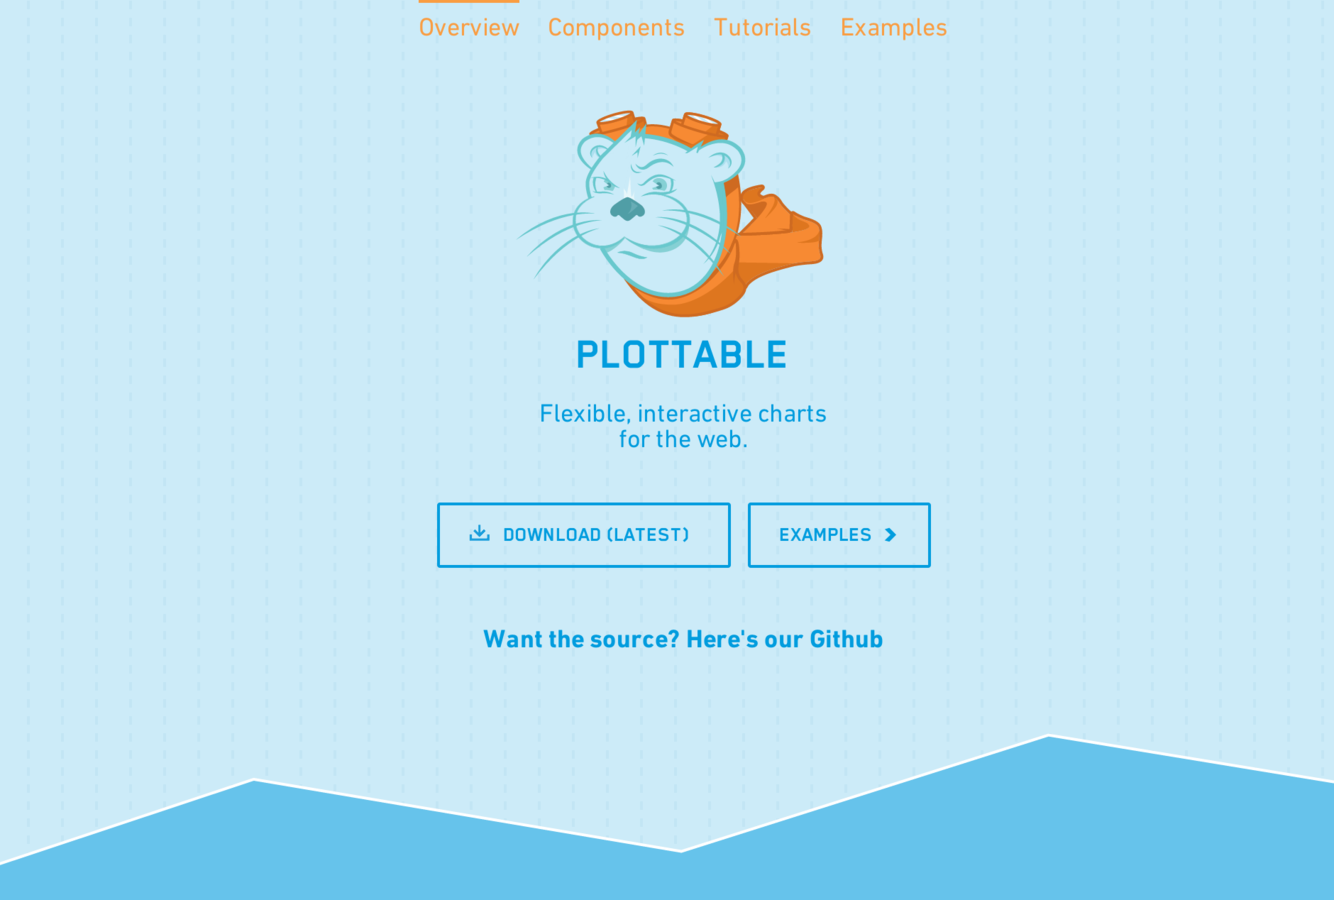
"Flexible, interactive charts for the web"
- developed by Palantir
- launched at JSConf EU 2014
- MIT licence
- actively developed (not surprising since it's so new)
- "didn't want to use raw D3, and no other library supported interactive drag and zoom"
// Scales
var xScale = new Plottable.Scale.Ordinal();
var yScale = new Plottable.Scale.Linear();

// Plot Components
var title  = new Plottable.Component.TitleLabel("Celebrities");
var yLabel = new Plottable.Component.Label("Height (cm)", "left");
var xAxis  = new Plottable.Axis.Category(xScale, "bottom");
var yAxis  = new Plottable.Axis.Numeric(yScale, "left");
var lines  = new Plottable.Component.Gridlines(null, yScale);
var plot   = new Plottable.Plot.VerticalBar(xScale, yScale)
  .addDataset(data)
  .project("x", "name", xScale)
  .project("y", "height", yScale)
  .animate(true);

// Layout and render
new Plottable.Component.Table([
  [null,    null, title],
  [yLabel, yAxis, lines.merge(plot)],
  [null,    null, xAxis]
])
.renderTo("svg#example");
pros and cons
- nice table layout idea
- actively developed, but on company time
- why'd they build a new library rather than
extend an existing one?
phew

Y so many?
1. d3 is hard
d3 is low-level
2. d3 is finished
d3 is stable
3. devs ❤ reinventing the wheel
people are different
4. perhaps because earlier libraries have had a learning curve
what now?

the inconclusive conclusion
1. there have always been lots of chart libraries. that probably isn't going to change

i like c3. but you might not
2. in your toolkit: tools for exploration, for workhorse
charts, + for one-off designs
tools for exploration
post talk note: people think raw is a great tool for exploration (but lament the lack of bar + line chart support)
"Learn as much as you can about existing tools which help you create standard charts quickly. Especially at the beginning of a project, it is super-important to generate a lot of charts quickly... Personally, I use Tableau and Gephi"
@moritz_stefaner
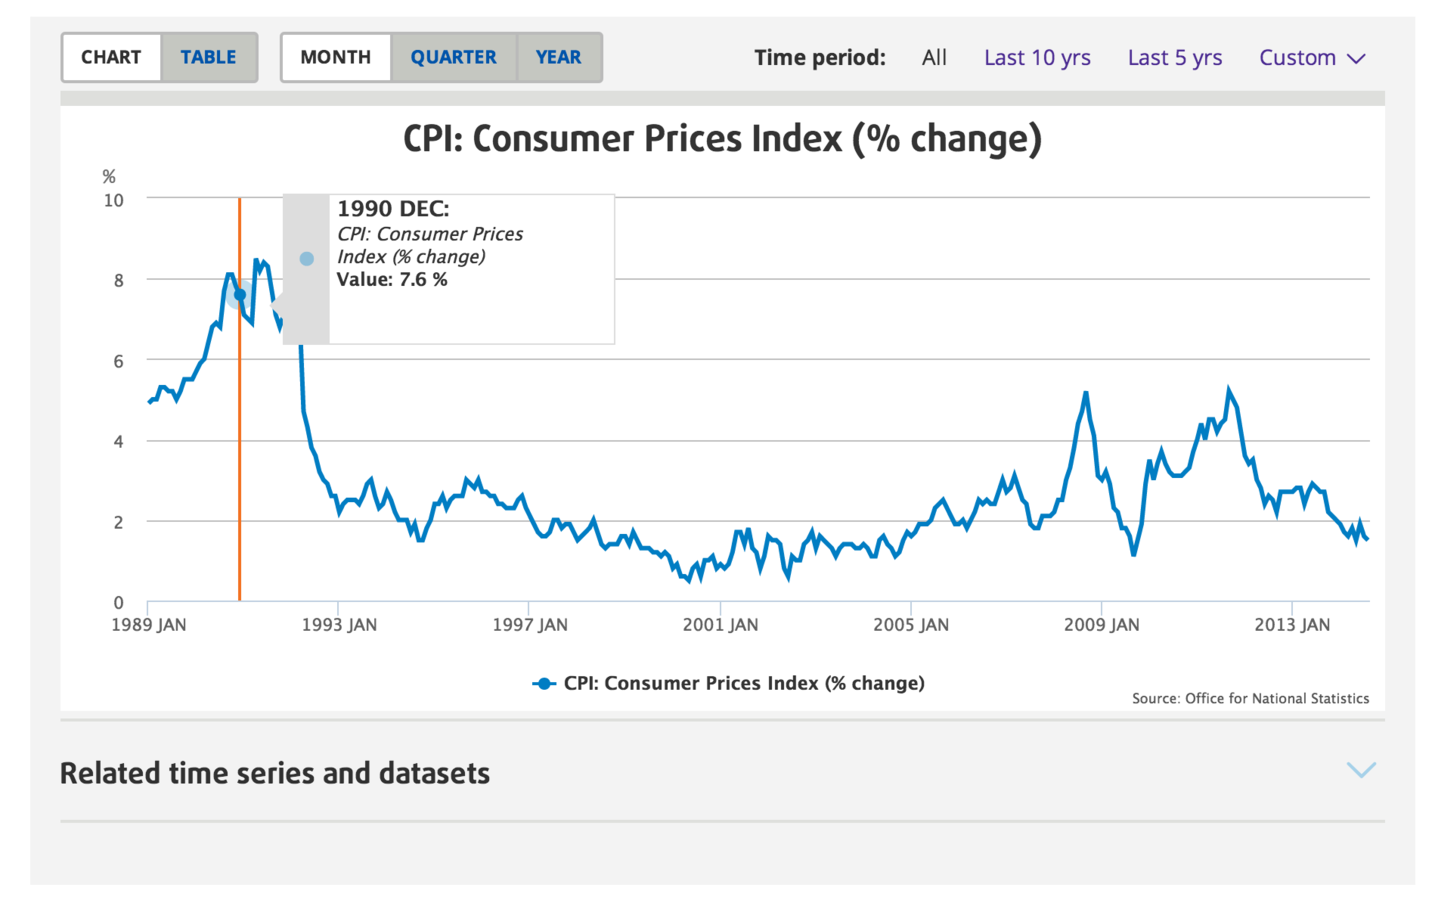
tools for
workhorse charts
alpha.ons.gov.uk
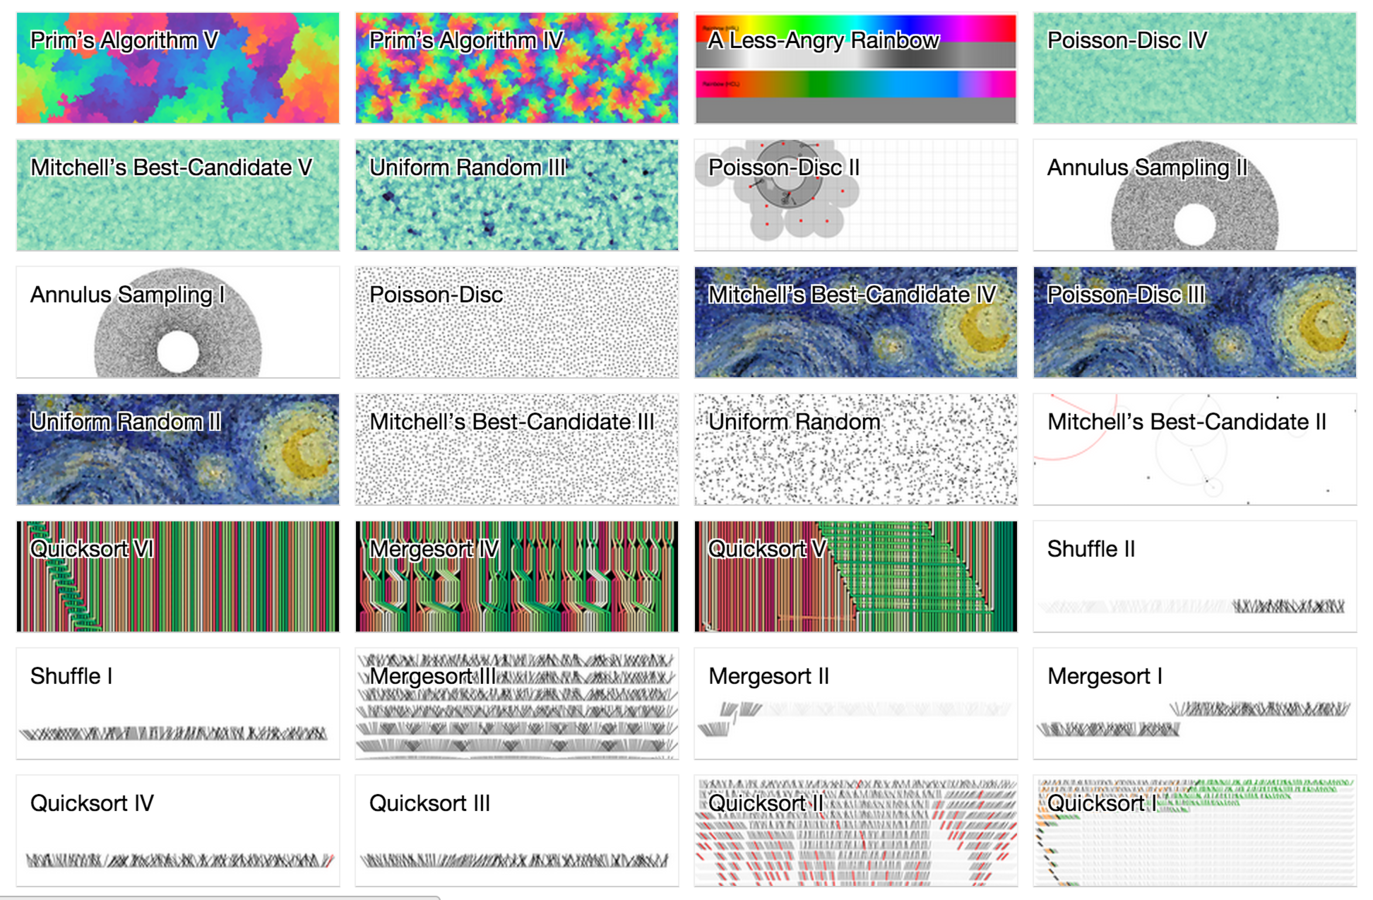
tools for beautiful
one-off designs
woah, algorithms!

3. maybe evolution is good too, as well as intelligent design?
"Maybe that’s the reason why people are sharing a lot of their work on http://bost.ocks.org/, doing some small experiments, laying down some building block...
...perhaps currently that is the most efficient way of building re-usable chart."
@muyueh on HN
4. more re-use would be a fine thing
how can we encourage re-use?
over to you
(and thanks)
state of the chart
By annaps
state of the chart
a short, personal and incomplete survey of d3 charting libraries


