data as a language
northwestern university knight lab
a beginner's guide to thinking about data, according to anne miao li (@annemiaoli)
how many journalists would consider themselves "math people"?
numbers are not scary.
they create a language, with their own hidden meanings, definitions and connotations.
what do you care about?
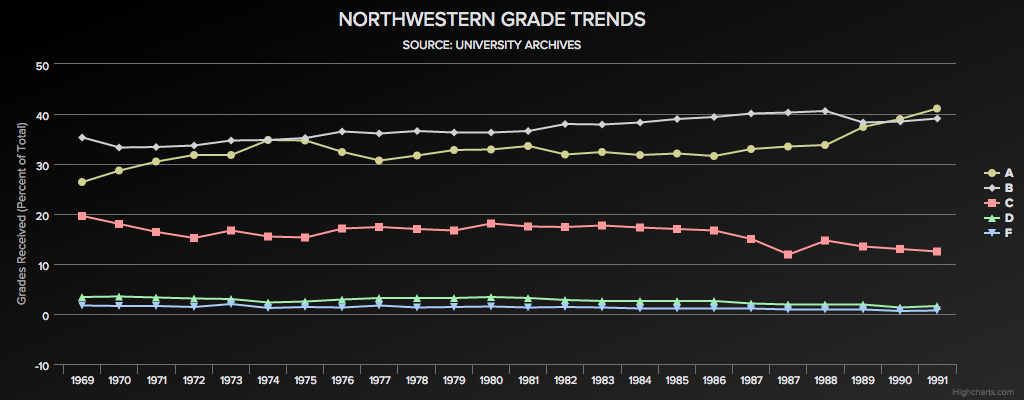
Created by Mallory Busch and myself with Highcharts. See the interactive real deal, The Grade Escape.
data spotted at:
- Census Reporter
- public institutions (like IDOE)
- federal/niche resources (like NCES or Fan Graphs)
a .xlxs is pretty and powerful, but a .csv is more versatile.
question
visualize
question, again
data is powerful.
data can also be deceiving.
as journalists, we bear the responsibility of translating what data is capable of showing and hiding to our audience.
numbers are not our enemy.
they strengthen our work and our words.
Tools and terms to know
- Excel
- R
- standard deviation
- mean/median/mode
- regression
- Python
- Javascript
- to FOIA
- to scrape
- scatterplot
- box-and-whiskers plot
- bar graph
- line graph
- (etc.)
software
verbs
descriptive stats
languages
visualizations
extra readings
- "What do I do when I get a new data set as told through tweets" by Jeff Leek
- "Bulletproofing the data project" by Sarah Cohen
- MuckRock and FOIA Machine (FOIA generators)
thank you!
Data as a Language
By annemiaoli
Data as a Language
A lightning talk for Open Lab Hours at the Northwestern University Knight Lab, 06-02-2015