R Script
Practice-2
Advanced Data Processing and Visualization
Asu Su 2016.08.26
Why R?
-
一行指令完成很多事情
-
套件很多,不用自己做 -
強大的數據處理、分析與視覺化功能
處理、分析、視覺化
Read Raw Data
> rawData <- read.csv(url("https://goo.gl/UqcioS"));
> View(rawData);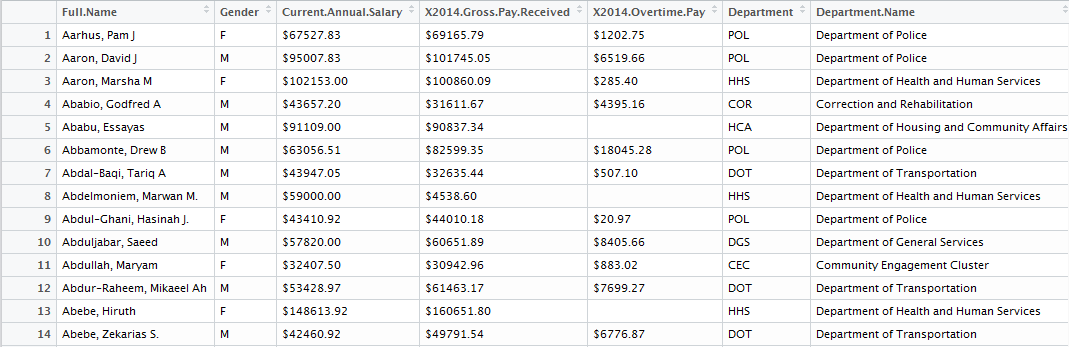
What do you want to know from data?
Question 1:
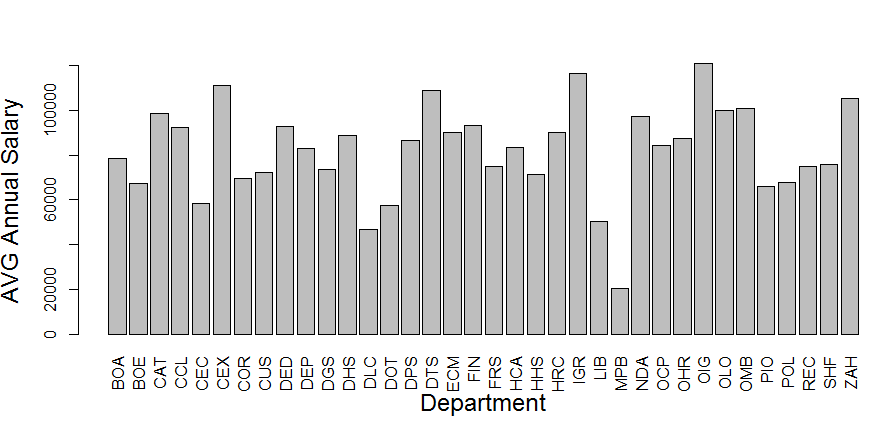
What's the average annual salary of each department?
REVIEW
Step1: understand question
What's the average annual salary of each department?
Two Columns
- Annual Salary
- Department
Two Actions
- Aggregate data by department
- Average salary of each department
Step2: manage&clean data
##### create Q1 data frame, clean and aggregate salary data
> Q1 <- data.frame(rawData$Department,
rawData$Current.Annual.Salary);
> Q1$rawData.Current.Annual.Salary <-
as.numeric(gsub("[\\$,]","",
Q1$rawData.Current.Annual.Salary));
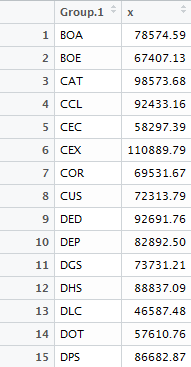
> Q1 <- aggregate(Q1$rawData.Current.Annual.Salary,
by = list(Q1$rawData.Department), FUN = mean);
> View(Q1);
Step3: visualize data
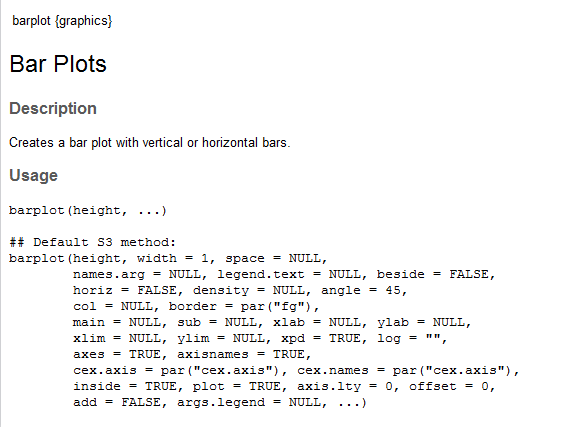
> ?barplot
Step3: visualize data
 > barplot(Q1$x, names.arg=Q1$Group.1, xlab="Department",
   ylab="AVG Annual Salary", las=3);
What do you want to know from data?
Question 2:
What's the male female ratio of each department?
Step1: understand question
What's the male female ratio of each department?
Two Columns
- Gender
- Department
Two Actions
- Aggregate data by department
- Find male female ratio of each department
Step2: manage&clean data
##### create Q2 data frame and clean data
> Q2 <- data.frame(rawData$Department, rawData$Gender);
> Q2$rawData.Gender <- as.numeric(Q2$rawData.Gender);
> View(Q2);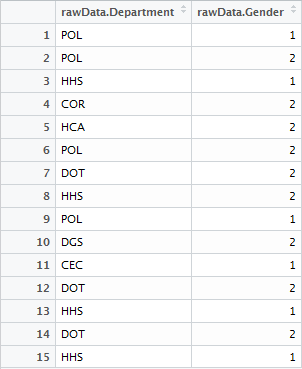
Step2: manage&clean data
##### aggregate data
> Q2 <- aggregate(Q2$rawData.Gender-1,
  by = list(Q2$rawData.Department), FUN = mean);
> Q2$x <- round(Q2$x,3)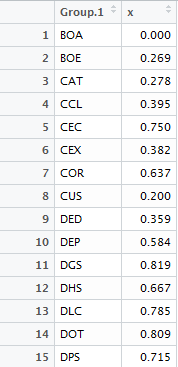
Step2: manage&clean data
##### change column names
> colnames(Q2)[2]<-"Male";
> colnames(Q2)[1]<-"Dept";

##### create female column
> Q2["Female"] <- 1-Q2$Male;
> View(Q2);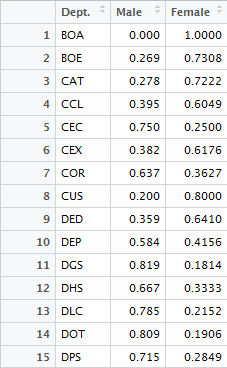
Step3: visualize data
> barplot(as.matrix(rbind(Q2$Male[1:15], Q2$Female[1:15])), xlim=c(0,1),
  col=c("green","pink"), las=1, names.arg=Q2$Dept[1:15], horiz=TRUE,
  xlab="Male Female Ratio", ylab="Department");
> legend("topright",legend=c("male", "female"), fill=c("green","pink"));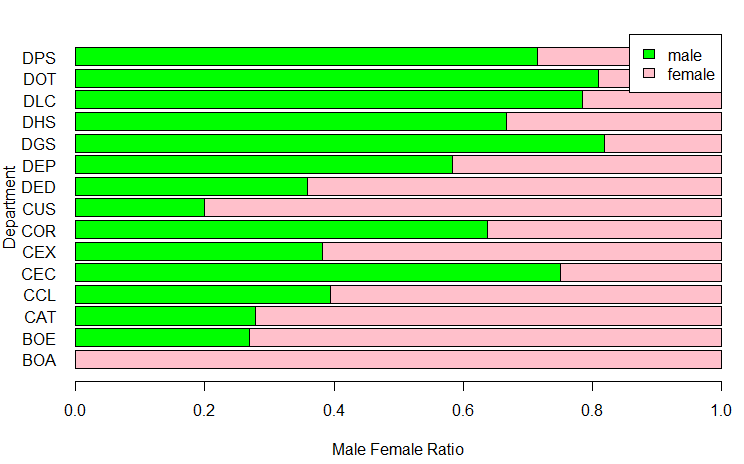
What do you want to know from data?
Question 3:
What's the correlation between experience year and annual salary of each department?
Step1: understand question
What's the correlation between experience year and annual salary of each department?
Three Columns
- Annual Salary
- Department
- Date.First.Hired
Two Actions
- Aggregate data by department
- Find out the correlation between experience year and annual salay
Step2: manage&clean data
##### create Q3 data frame and clean salary data
> Q3<-data.frame(rawData$Department, rawData$Current.Annual.Salary,
  rawData$Date.First.Hired);
> Q3$rawData.Current.Annual.Salary =
    as.numeric(gsub("[\\$,]","", Q3$rawData.Current.Annual.Salary));
> View(Q3);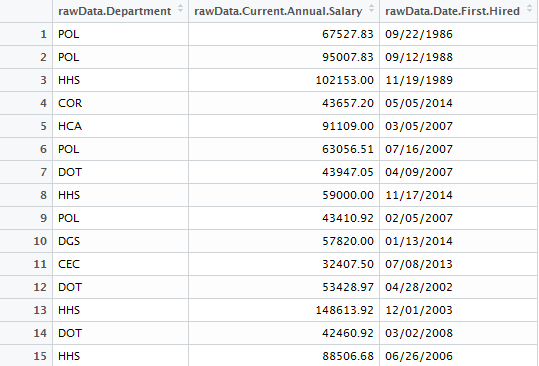
Step2: manage&clean data
##### clean and get experience year data
> Q3$rawData.Date.First.Hired <- as.Date(Q3$rawData.Date.First.Hired, "%m/%d/%Y");
> Q3$rawData.Date.First.Hired <-(Sys.Date()-Q3$rawData.Date.First.Hired)/365;
> Q3$rawData.Date.First.Hired <- round(Q3$rawData.Date.First.Hired,3);
> View(Q3);

##### rename column name
> colnames(Q3)[1]<-"Dept";
> colnames(Q3)[2]<-"Annual Salary";
> colnames(Q3)[3]<-"Experience Year";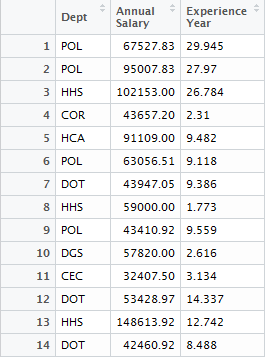
Step2: manage&clean data
##### aggregate data and use correlation function
> Result <- as.data.frame(rownames(table(Q3$Dept)));
> colnames(Result)[1] <- "Dept";
> Result["COR"] <- 0;
> View(Result);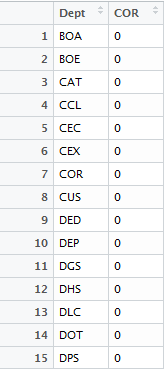
Step2: manage&clean data
##### calculate correlation function
> Q3$`Experience Year` <- as.numeric(Q3$`Experience Year`);
> for(i in 1:nrow(Result)) {
      temp = subset(Q3, Q3$Dept==Result$Dept[i]);
      Result$COR[i] <- cor(temp$`Annual Salary`, temp$`Experience Year`);
  };
> View(Result);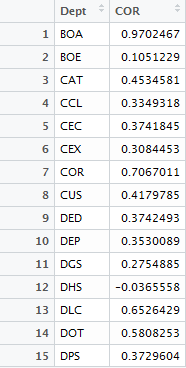
Result
Q3
calculate correlation
Step3: visualize data
> install.packages("devtools"); library("devtools");
> install.packages("htmltools"); library("htmltools");
> devtools::install_github("jcheng5/bubbles");
> ?bubbles
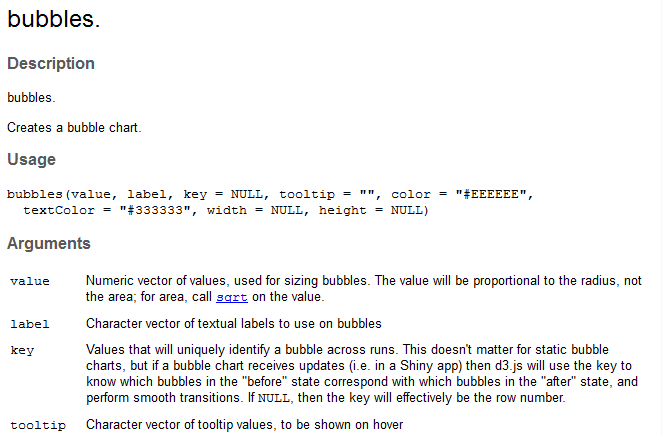
Step3: visualize data
> library(bubbles);
> bubbles(value = Result$COR[Result$COR>0],
  label=Result$Dept[Result$COR>0], color = "pink");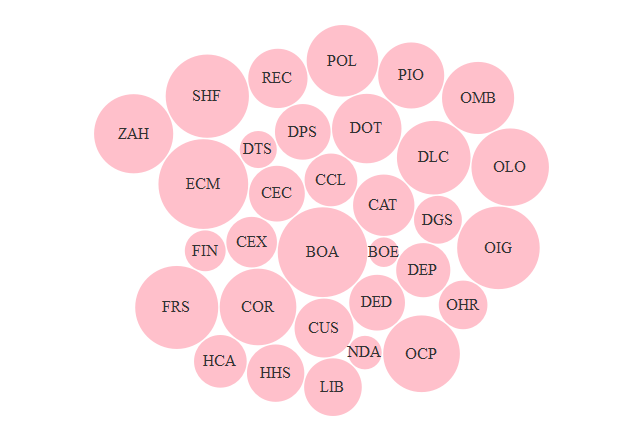
Reference
- Data Montgomery https://data.montgomerycountymd.gov/Human-Resources/Employee-Salaries-2014/54rh-89p8/data
- How to in R http://howtoinr.weebly.com/
- Big Data University http://bigdatauniversity.com/
- R語言與Excel數據分析功能比較 http://iguang.tw/u/4219580/article/493161.html
- IBM Data Scientist Workbench https://datascientistworkbench.com/
Thank you!
deck
By PeiHua Su